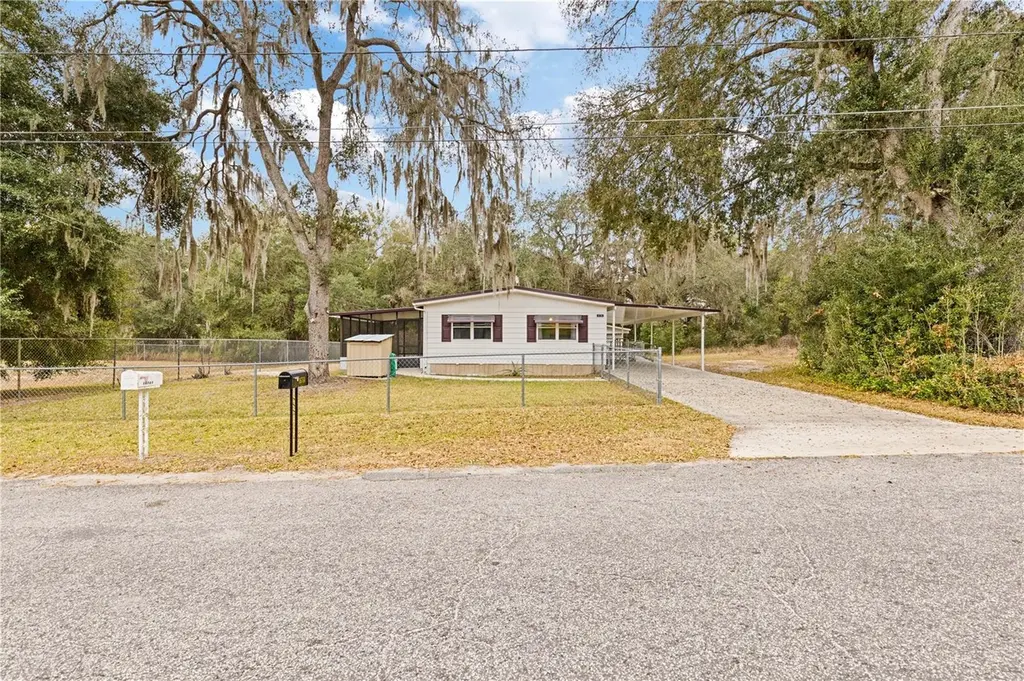
16760 SE 102nd Avenue Rd · The Villages, FL
Flood risk 7/10 · Major
- FEMA flood zone
- X (unshaded)
- Chance of flooding over 30 yrs
- 0.78%
- Est. flood insurance / yr
- $507 – $1,088
Fire risk 4/10 · Minor
- Est. fire insurance / yr
- $947 – $1,759
Heat risk 8/10 · Major
- Hot days now (above 109°F)
- 7 days/yr
- Hot days in 30 yrs
- 21 days/yr
Wind risk 9/10 · Severe
- Chance of severe wind over 30 yrs
- 99.0%
Air-quality risk 3/10 · Minor
- Unhealthy air days now
- 2 days/yr
- Unhealthy air days in 30 yrs
- 2 days/yr
Risk factors via First Street. Map © Google.
Why this score? — see what drove the C grade
The composite is a weighted blend of 9 inputs, each scored 0–100. Each bar is that input's sub-score; the figure is the points it added to the 100-point composite (weight × sub-score).
- Cash flow +28.4/30.0
- DSCR +10.0/10.0
- 1% rule +7.4/10.0
- Schools +3.6/10.0
- Livability +3.5/5.0
- Rent growth +2.5/5.0
- Condition / age +2.5/5.0
- ARV discount +0.0/15.0
- Appreciation +0.0/10.0
$149,000
🖨 Deal sheet 📄 Offer letter ✓ Due diligence
Listing remarks MLS
Charming 2/2 mobile home on an oversized, fully fenced lot in the heart of Summerfield! Tucked into a no-HOA neighborhood, this property offers rare privacy with no rear or side neighbors and a central location just minutes from Lady Lake, Ocala, and The Villages. Perfect as a starter home, winter retreat, or investment property, this home features a covered carport, handicap-accessible entry, backyard shed, an oversized screened patio, and built-in doggy doors for your furry friends. Enjoy the freedom of extra outdoor space, rental potential, and easy access to shopping, dining, and major roadways. Affordable, private, and full of opportunity! This one checks all the boxes.
Key facts
- 9,583 sq ft lot
- Parking
- Built 1981
Neighborhood map
What this means for you Summary
Snapshot
- This is a 2-bed/2.0-bath manufactured listed at $149k.
Deal economics
- At list price, monthly cash flow is $414 ($5k/yr) — positive.
- The deal already cash-flows at list — no discount required.
- Meets the 1% rule at list price ($2k rent vs $149k).
- Recommended offer: $131k (12.0% below list) — sets the bar for market timing.
- Cap rate 10.2% vs local median 5.0% in The Villages — top-decile yield for the area; either an underpriced asset or a hidden risk that comps aren't pricing in. Stress-test before assuming the spread holds.
Location & tenants
- Location reads 70/100 on livability (#431 in FL) — a middle-class / working-renter tenant base. Strengths: schools A+, crime A+, housing A; Watch: amenities F, commute F, health & safety F.
- Marion (rural): math 42% / reading 43% proficiency, ranked #61 of 73 in FL (top 84%) — families likely to look elsewhere, expect single-tenant / working-renter base with shorter leases; 61% free/reduced lunch — lower-income household profile, screen leases tightly.
- Market conditions: 705 active listings in the ZIP; 12 comparable units currently listed for rent nearby; rentals at typical pace (median 22d on market — plan ~3-4 weeks tenant-placement turnaround); 7,071 units permitted in Marion County in 2024 (534 in 5+ unit buildings).
- This rent runs 33% of the median local income ($67k/yr) — at the standard rent-burdened threshold; future hikes will face affordability resistance.
Forward outlook
- Local home prices are declining (-3.0%/yr); year-one equity from $1k of loan paydown is wiped out by about $4k of value loss. Plan a longer hold.
- Marion County population projected at +13% by 2050 — modest demand growth; plan on rents tracking national, not racing it.
- At projected returns (-3.0% appreciation + 3.0% rent growth), your $42k cash investment doubles in ~10 years — after that, you're playing with house money.
Negotiation context
- It's been on market 123 days — a 12% lower offer ($131k) is reasonable based on typical stale-listing flexibility.
- 4 sale attempts since 21y ago; this cycle's ask has dropped $8k (5%) from the opening price — seller is motivated, your offer sets the floor, not the list.
Risks & watch-outs
- Watch-outs: flood insurance adds $66/mo.
- Climate carrying-cost: major flood risk; severe wind risk, 99% chance of damaging wind over 30y; extreme-heat days projected 7→21/yr by 2055 (HVAC capex compounding) — expect insurance premiums to compound above CPI over the hold.
Questions for the listing agent
- It's been on market 123 days. Have you received any prior offers? Is the seller open to a 12% concession, seller financing, or rate buy-down credit?
- What's the actual annual flood-insurance premium (NFIP or private), and is the property in a SFHA with mandatory coverage?
- Why hasn't it sold? Are there any deal-killer items the seller is aware of (foundation, flood, title, zoning, code violations)?
- Is there a deadline driving the sale (1031 exchange, divorce, estate, relocation)? That informs how much negotiation room exists.
- Schools are A-rated — typically a magnet for longer-tenancy family renters. What's the average tenant stay here, and is there a school-zone premium baked into asking?
- What's the average days-on-market for RENTAL listings here right now (not sales)? A rising rental-DOM trend means longer vacancies and softer asking-rent achievability than the comps imply.
- What's the recent tenant-quality profile in this submarket — average credit score on applications, eviction rate, late-payment / NSF rate, and stable-employment percentage? A property-management company in the area should have these aggregated.
- How much new for-sale + rental construction is in the pipeline within 1–3 miles? Heavy new supply typically softens prices + rents 12–24 months out; constrained supply supports both.
Investment metrics
- 1% rule
- 1.24% ✓
- Cap rate
- 10.16%
- Cash-on-cash
- 13.81%
- DSCR
- 1.61
- GRM
- 6.7
CMA / ARV
- ARV (median comp)
- $100,000
- List price
- $149,000
- Delta
- 49.00%
- Verdict
- OVERPRICED
- Comps
- 3 within 1.0 mi
Show comp detail 1 sale within ~0.75 mi
| Address | Dist | Beds/Ba | Sqft | Sold | Price | $/sf | Match |
|---|---|---|---|---|---|---|---|
| 16653 SE 96th Ct | 0.69mi | 2/2.0 | 1,226 (+11%) | 12mo | $215,000 | $175 | 39 |
Match score weights: distance 35% · size 25% · config 20% · recency 20%. Top-matched comps best support the ARV.
Projected returns pro-forma
-3.0% appreciation · 3.0% rent growth · sell at horizon
- IRR
- 1.4%
- Equity multiple
- 1.05×
- Total profit
- $2,243
- Equity at exit
- $22,216
- IRR
- 11.0%
- Equity multiple
- 1.86×
- Total profit
- $36,046
- Equity at exit
- $12,883
Cash invested: $41,720 (down + closing). Projections, not guarantees.
Landlord ↔ Tenant lean methodology
- Overall (STATE)
- 87 Strongly Landlord-Friendly
- State Florida
- 87 Strongly Landlord-Friendly · R+3
- County
- — inherits STATE
- City
- — inherits STATE
ZIP-level market 34491
- Home prices YoY
- -35.0%
- Active inventory
- 705
- Price-to-rent
- 6.7×
Monthly cashflow live
- Estimated rent
- $1,855 high interval (Pro) →
- Mortgage (P&I)
- −$781
- Tax from tax record
- −$142 /mo · $1,701/yr
- Insurance
- −$62
- Flood insurance flood zone
- −$66 /mo · $798/yr
- HOA
- −$0
- Vacancy / Maint / Mgmt
- −$390
- Net cashflow
- $414
Break-even live
UW: 25.0% down · 7.5% · 30yr · 1.5% tax · 5.0% vac · 8.0% maint · 8.0% mgmt
Financing live
Cash to close
- Down payment
- $37,250
- Closing costs
- $4,470
- Reserves months
- —
- Total cash needed
- —
Loan-product check · same deal, 3 products live
Conventional
25% down · 7.5% · 30yr
- Down + closing
- —
- Monthly P&I
- —
- Monthly cashflow
- —
- DSCR
- —
- Eligible?
- —
Personal DTI + credit; lowest rate.
DSCR
20% down · 8.5% · 30yr
- Down + closing
- —
- Monthly P&I
- —
- Monthly cashflow
- —
- DSCR
- —
- Eligible?
- —
No personal income docs; deal must DSCR.
Hard money
10% down · 12.0% · 12mo
- Down + closing
- —
- Monthly P&I
- —
- Monthly cashflow
- —
- DSCR
- —
- Eligible?
- —
Short-term bridge; refi at stabilization.
Rent comps 12 comps
| Address | Beds | Baths | Sqft | Rent | $/sqft | DOM | Units | Dist |
|---|---|---|---|---|---|---|---|---|
| 9990 SE 166th St Summerfield, FL | 3.0 | 2.0 | 962 | $1,395 | $1.45 | 14d | 1 | 0.38mi |
| 10326 SE 162nd Place Rd Summerfield, FL | 3.0 | 2.0 | 1419 | $2,300 | $1.62 | 14d | 1 | 0.54mi |
| 17199 SE 97th Ter Summerfield, FL | 3.0 | 2.0 | 1404 | $1,990 | $1.42 | 21d | 1 | 0.68mi |
| 9523 SE 168th Maplesong Ln The Villages, FL | 3.0 | 2.0 | 1265 | $1,975 | $1.56 | 21d | 1 | 0.82mi |
| 17532 SE 100th Ct Summerfield, FL | 2.0 | 2.0 | 1217 | $1,800 | $1.48 | 21d | 1 | 0.83mi |
| 11001 SE Sunset Harbor Rd Unit H52 Summerfield, FL | 2.0 | 2.5 | 1224 | $1,440 | $1.18 | 21d | 1 | 0.88mi |
| 10397 SE 176th St Summerfield, FL | 2.0 | 2.0 | 1296 | $2,150 | $1.66 | 21d | 1 | 0.89mi |
| 11001 SE Sunset Harbor Rd Summerfield, FL | 2.0 | 1.5–2.0 | 1244 | $1,770 | $1.42 | 21d | 2 | 0.92mi |
| 11001 SE Sunset Harbor Rd Unit A08 Summerfield, FL | 2.0 | 1.5 | 1200 | $2,000 | $1.67 | 21d | 1 | 0.95mi |
| 16962 SE 94th Sunnybrook Cir The Villages, FL | 2.0 | 2.0 | 1160 | $2,000 | $1.72 | 21d | 1 | 0.96mi |
| 9195 SE 163rd St Summerfield, FL | 3.0 | 2.0 | 1410 | $1,800 | $1.28 | 21d | 1 | 1.24mi |
| 17713 SE 95th Cir Summerfield, FL | 3.0 | 2.0 | 1450 | $2,000 | $1.38 | 21d | 1 | 1.31mi |
Listing history 23 events
-
2026-06-14remarks 699-char remark
-
2026-06-14statusdays on market $149,000 Pending 123 DOM
-
2026-06-13days on market $149,000 Active 122 DOM
-
2026-06-10days on market $149,000 Active 120 DOM
-
2026-06-09days on market $149,000 Active 119 DOM
-
2026-06-08days on market $149,000 Active 118 DOM
-
2026-06-07days on market $149,000 Active 117 DOM
-
2026-06-03days on market $149,000 Active 113 DOM
-
2026-06-02days on market $149,000 Active 112 DOM
-
2026-06-01days on market $149,000 Active 111 DOM
-
2026-05-31days on market $149,000 Active 110 DOM
-
2026-05-30days on market $149,000 Active 109 DOM
-
2026-04-19price $149,000 683-char remark
Show marketing remark (683 chars)
Charming 2/2 mobile home on an oversized, fully fenced lot in the heart of Summerfield! Tucked into a no-HOA neighborhood, this property offers rare privacy with no rear or side neighbors and a central location just minutes from Lady Lake, Ocala, and The Villages. Perfect as a starter home, winter retreat, or investment property, this home features a covered carport, handicap-accessible entry, backyard shed, an oversized screened patio, and built-in doggy doors for your furry friends. Enjoy the freedom of extra outdoor space, rental potential, and easy access to shopping, dining, and major roadways. Affordable, private, and full of opportunity! This one checks all the boxes.
-
2026-02-10$157,500 Active 683-char remark
Show marketing remark (683 chars)
Charming 2/2 mobile home on an oversized, fully fenced lot in the heart of Summerfield! Tucked into a no-HOA neighborhood, this property offers rare privacy with no rear or side neighbors and a central location just minutes from Lady Lake, Ocala, and The Villages. Perfect as a starter home, winter retreat, or investment property, this home features a covered carport, handicap-accessible entry, backyard shed, an oversized screened patio, and built-in doggy doors for your furry friends. Enjoy the freedom of extra outdoor space, rental potential, and easy access to shopping, dining, and major roadways. Affordable, private, and full of opportunity! This one checks all the boxes.
-
2023-10-11soldstatus $134,000
-
2008-05-16soldstatus $63,000
-
2008-05-07soldstatus $63,000 541-char remark
Show marketing remark (541 chars)
REMODELED & UPGRADED Mobile Home near the Villages. 2 BR/2BA, 2 car carport, 12x19 screened porch & Detached Workshop with electric. This home has been remodeled with new kitchen & baths, upgraded all electric & plumbing, new flooring & freshly painted, kitchen-newer appliances & pantry; Large living rm, Dining rm, large master bedrm, privacy with retention area 1 side & vacant lot on other (additional 75x125 lot available), 12x20 workshop w/ carport area, roofover, gutters, awnings. Nice home.
-
2007-10-05$68,500 541-char remark
Show marketing remark (541 chars)
REMODELED & UPGRADED Mobile Home near the Villages. 2 BR/2BA, 2 car carport, 12x19 screened porch & Detached Workshop with electric. This home has been remodeled with new kitchen & baths, upgraded all electric & plumbing, new flooring & freshly painted, kitchen-newer appliances & pantry; Large living rm, Dining rm, large master bedrm, privacy with retention area 1 side & vacant lot on other (additional 75x125 lot available), 12x20 workshop w/ carport area, roofover, gutters, awnings. Nice home.
-
2006-03-15soldstatus $36,000
-
2005-12-28$54,900
-
2005-12-28historical
-
2005-08-24$94,900
-
1986-01-01soldstatus $24,900
ⓘ Source: listings_history table (triggers on properties + properties_extension) + one-shot
backfill from property_details.listing_events for pre-trigger history.
Tax reassessment forecast FL · Resets to sale price
- Current annual tax
- $1,701 · $142/mo
- Projected year-2 tax
- $1,701 · $142/mo
- Expected delta
- $0/yr ($0/mo · 0.0%)
ⓘ Screening estimate from a state-policy table — verify with the county assessor before closing.
Climate risk First Street
- Flood 7/10 Severe FEMA zone X (unshaded) · 78% chance over 30 yrs
- Wildfire 4/10 Moderate
- Heat 8/10 Severe 7 d/yr ≥109°F today · 21 d/yr by 30 yrs out
- Wind 9/10 Extreme 99% chance of damaging wind over 30 yrs
- Air quality 3/10 Moderate 2 unhealthy d/yr today · 2 by 30 yrs out
Nearby sold comps map
Loading sold comps map…
Walkable amenities ~0.75 mi
Loading nearby amenities…
Taxation est. · year 1
- Rental income
- $22,258
- − Mortgage interest
- −$8,346
- − Property taxes
- −$1,701
- − Insurance
- −$1,542
- − Repairs & maintenance
- −$1,781
- − Management
- −$1,781
- − Depreciation
- −$4,335
- Taxable income
- $2,772
- Est. tax owed @ 24.0%
- −$665
- After-tax cash flow
- $4,299/yr
For passive investors: Depreciation is non-cash, so a rental often shows a tax loss while cash-flowing — sheltering income. Rental losses are passive: they offset passive income freely, and up to $25,000/yr can offset ordinary (W-2) income if you actively participate and your MAGI is under $100k (phasing out to $0 by $150k); unused losses carry forward. On sale, claimed depreciation is recaptured at up to 25%, and gains may owe capital-gains tax (a 1031 exchange can defer both). Figures are a year-1 estimate at your 24.0% rate — not tax advice; consult a CPA.
Schools (NCES district)
- District
- Marion
- NCES district ID
- 1201260
- Math proficiency
- 42% ▼ -7.00%
- Reading proficiency
- 43% ▼ -4.00%
- Median HH income
- $40,015
- Composite
- 35.61/100
- National rank
- #4890
- State rank
- #61 of 73 in FL
Livability — The Villages
- Score
- 70/100
- State rank
- #431
- US rank
- #7363
Category grades
Schools grade is shown separately in the Schools card above.
Census & demographics
- County
- Marion County · 315,796 people
- City population
- 83,973
- Metro
- Ocala, FL
- Population (ZIP)
- 33,318
- Household income
- $66,679
- Rent vs Own
- Severe rent burden
- 256.0
Population outlook (Marion County) Hauer SSP2
- Today (2025)
- 365,905 people
- By 2030
- 376,768 · +3.0%
- By 2040
- 396,555 · +8.4%
- By 2050
- 412,723 · +12.8%
- By 2075
- 446,090 · +21.9%
- By 2100
- 436,193 · +19.2%
Race, ethnicity, and origin ACS 2023
- Neighborhood character
- Predominantly White (77%)
- Race & ethnicity
- White 77% Hispanic / Latino 14% Two or more races 9% Black 4% Asian 2%
- Hispanic origin (detail)
- Mexican 3% Puerto Rican 6% Cuban 1%
- Common ancestry
- Lithuanian 3% Slovak 2% Romanian 2%
- Foreign-born
- 8% · Canada, Vietnam, Jamaica
- Languages at home
- 85% English-only · Spanish 11% Vietnamese 1% French/Haitian/Cajun 1%
Political lean MEDSL · Marion
- 2024 margin
- Solid R (+31.6) · D 33.8% · R 65.5%
- 2008→2024 swing
- -20.0pp toward R · 2008: -11.6pp · 2024: -31.6pp
- All cycles
- 2024: R+31.6 2020: R+25.9 2016: R+26.2 2012: R+16.2 2008: R+11.6
Not yet ingested
- Civics
- —
Market trends
- HPI YoY
- ▼ -107.67%
- Current HPI
- 200.0792
- Rent YoY
- —
- Metro
- Ocala, FL
- State GDP YoY
- ▲ 3.28%
- F500 in state
- 36
Industry mix (Fortune 500 HQ in FL)
| Industry | F500 HQs | Revenue |
|---|---|---|
| Industrial Technology | 2 | $29B |
|
||
| Insurance | 2 | $17B |
|
||
| Retail | 1 | $60B |
|
||
| Technology Distribution | 1 | $58B |
|
||
| Homebuilding | 1 | $35B |
|
||
| Technology Manufacturing | 1 | $35B |
|
||
Price history
+498.4% since first listed11 events — show timeline
- 2026-04-19 Price Changed $149,000 Stellar MLS as Distributed by MLS Grid
- 2026-02-10 Listed $157,500 Stellar MLS as Distributed by MLS Grid
- 2023-10-11 Sold (Public Records) $134,000 Public Records
- 2008-05-16 Sold (Public Records) $63,000 Public Records
- 2008-05-07 Sold (MLS) $63,000 Stellar MLS as Distributed by MLS Grid
- 2007-10-05 Listed $68,500 Stellar MLS as Distributed by MLS Grid
- 2006-03-15 Sold (MLS) $36,000 Stellar MLS as Distributed by MLS Grid
- 2005-12-28 Listing Removed — Stellar MLS as Distributed by MLS Grid
- 2005-12-28 Listed $54,900 Stellar MLS as Distributed by MLS Grid
- 2005-08-24 Listed $94,900 Stellar MLS as Distributed by MLS Grid
- 1986-01-01 Sold (Public Records) $24,900 Public Records
Property tax history
+18.3%/yrLatest (2025): $1,701 · +7.6% YoY. Source: county tax records.
Cash-flow waterfall
monthlySold comps — $/sqft
last 12 mo · ≤1 miLoading sold comps…