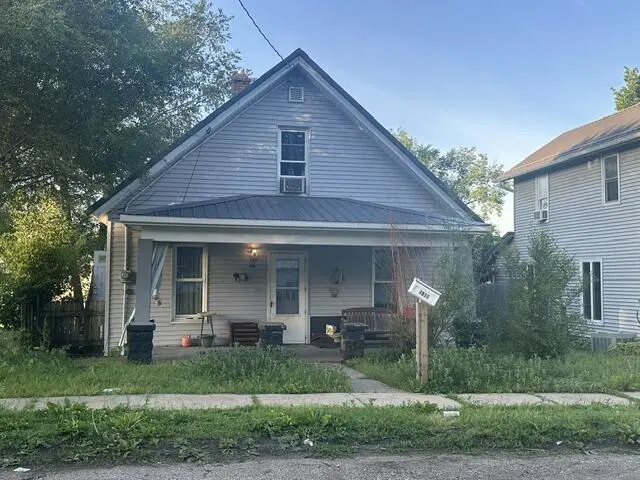
1812 New Hampshire St · Muscatine, IA
Flood risk 1/10 · Minimal
- FEMA flood zone
- X
- Chance of flooding over 30 yrs
- 0.0%
- Est. flood insurance / yr
- $507 – $1,088
Fire risk 1/10 · Minimal
- Est. fire insurance / yr
- $902 – $1,676
Heat risk 3/10 · Minor
- Hot days now (above 106°F)
- 7 days/yr
- Hot days in 30 yrs
- 16 days/yr
Wind risk 2/10 · Minimal
- Chance of severe wind over 30 yrs
- —
Air-quality risk 2/10 · Minimal
- Unhealthy air days now
- 1 days/yr
- Unhealthy air days in 30 yrs
- 1 days/yr
Risk factors via First Street. Map © Google.
Why this score? — see what drove the B grade
The composite is a weighted blend of 9 inputs, each scored 0–100. Each bar is that input's sub-score; the figure is the points it added to the 100-point composite (weight × sub-score).
- Cash flow +30.0/30.0
- 1% rule +10.0/10.0
- DSCR +10.0/10.0
- ARV discount +7.5/15.0
- Schools +4.9/10.0
- Livability +3.5/5.0
- Rent growth +2.5/5.0
- Condition / age +2.5/5.0
- Appreciation +0.0/10.0
$45,000
🖨 Deal sheet 📄 Offer letter ✓ Due diligence
Listing remarks MLS
Nice home loaded with potential! Roof new '10, siding '06. Many more recent updates, inc: some bathroom fixtures, window, patio door, water heater. Possible 3rd bedroom. Garage has alley access. HSA Home Warranty, Sq. Ft. and lot size are approx.
Key facts
- 6,098 sq ft lot
- Garage
- Built 1900
Neighborhood map
What this means for you Summary
Snapshot
- This is a 3-bed/1.5-bath single-family listed at $45k.
Deal economics
- At list price, monthly cash flow is $270 ($3k/yr) — positive.
- The deal already cash-flows at list — no discount required.
- Meets the 1% rule at list price ($797 rent vs $45k).
Location & tenants
- Location reads 70/100 on livability (#358 in IA) — a middle-class / working-renter tenant base. Strengths: cost of living A+, housing A+, crime B; Watch: health & safety D+, amenities F, commute F.
- Muscatine Community School District (town): math 55% / reading 59% proficiency, ranked #257 of 289 in IA (top 89%) — acceptable for families but not a draw, mixed tenant base, ~2y average lease.
- Market conditions: 188 active listings in the ZIP; 8 comparable units currently listed for rent nearby; rentals lingering (median 44d on market — plan ~5-8 weeks vacancy on turnover, expect pricing pressure); 50% of comp listings sitting > 30 days — soft ceiling on asking rent; 65 units permitted in Muscatine County in 2024 (45 in 5+ unit buildings).
Forward outlook
- Local home prices are declining (-3.0%/yr); year-one equity from $311 of loan paydown is wiped out by about $1k of value loss. Plan a longer hold.
- Muscatine County population projected at +8% by 2050 — modest demand growth; plan on rents tracking national, not racing it.
- At projected returns (-3.0% appreciation + 3.0% rent growth), your $13k cash investment doubles in ~5 years — after that, you're playing with house money.
Negotiation context
- Only 0 days on market — expect competitive offers; lowballing is unlikely to land.
- 2 sale attempts since 15y ago with the ask held roughly flat each time — persistent listings suggest the price (not the market) is what's stuck; bring a comps-based counter.
Risks & watch-outs
- Watch-outs: property tax is 2.8% of price; built in 1900 — expect roof / HVAC / electrical / plumbing capex.
Questions for the listing agent
- Built in 1900 — when were the roof, HVAC, electrical panel, plumbing, and water heater last replaced?
- Property tax is high relative to price — has the assessment been appealed recently, and will the sale trigger a re-assessment?
- Is there a deadline driving the sale (1031 exchange, divorce, estate, relocation)? That informs how much negotiation room exists.
- What's the average days-on-market for RENTAL listings here right now (not sales)? A rising rental-DOM trend means longer vacancies and softer asking-rent achievability than the comps imply.
- What's the recent tenant-quality profile in this submarket — average credit score on applications, eviction rate, late-payment / NSF rate, and stable-employment percentage? A property-management company in the area should have these aggregated.
- How much new for-sale + rental construction is in the pipeline within 1–3 miles? Heavy new supply typically softens prices + rents 12–24 months out; constrained supply supports both.
Investment metrics
- 1% rule
- 1.77% ✓
- Cap rate
- 13.50%
- Cash-on-cash
- 25.76%
- DSCR
- 2.15
- GRM
- 4.7
CMA / ARV
No comps found within radius.
Projected returns pro-forma
-3.0% appreciation · 3.0% rent growth · sell at horizon
- IRR
- 19.5%
- Equity multiple
- 1.79×
- Total profit
- $9,974
- Equity at exit
- $6,710
- IRR
- 27.8%
- Equity multiple
- 3.46×
- Total profit
- $31,034
- Equity at exit
- $3,891
Cash invested: $12,600 (down + closing). Projections, not guarantees.
Landlord ↔ Tenant lean methodology
- Overall (STATE)
- 83 Strongly Landlord-Friendly
- State Iowa
- 83 Strongly Landlord-Friendly · R+6
- County
- — inherits STATE
- City
- — inherits STATE
ZIP-level market 52761
- Active inventory
- 188
- Price-to-rent
- 4.7×
Monthly cashflow live
- Estimated rent
- $797 high interval (Pro) →
- Mortgage (P&I)
- −$236
- Tax from tax record
- −$104 /mo · $1,254/yr
- Insurance
- −$19
- HOA
- −$0
- Vacancy / Maint / Mgmt
- −$167
- Net cashflow
- $270
Break-even live
UW: 25.0% down · 7.5% · 30yr · 1.5% tax · 5.0% vac · 8.0% maint · 8.0% mgmt
Financing live
Cash to close
- Down payment
- $11,250
- Closing costs
- $1,350
- Reserves months
- —
- Total cash needed
- —
Loan-product check · same deal, 3 products live
Conventional
25% down · 7.5% · 30yr
- Down + closing
- —
- Monthly P&I
- —
- Monthly cashflow
- —
- DSCR
- —
- Eligible?
- —
Personal DTI + credit; lowest rate.
DSCR
20% down · 8.5% · 30yr
- Down + closing
- —
- Monthly P&I
- —
- Monthly cashflow
- —
- DSCR
- —
- Eligible?
- —
No personal income docs; deal must DSCR.
Hard money
10% down · 12.0% · 12mo
- Down + closing
- —
- Monthly P&I
- —
- Monthly cashflow
- —
- DSCR
- —
- Eligible?
- —
Short-term bridge; refi at stabilization.
Rent comps 8 comps
| Address | Beds | Baths | Sqft | Rent | $/sqft | DOM | Units | Dist |
|---|---|---|---|---|---|---|---|---|
| 1807 Hershey Ave Unit 1 Muscatine, IA | 2.0 | 1.0 | 600 | $700 | $1.17 | 43d | 1 | 0.12mi |
| 400 Grandview Ave Unit 2 Muscatine, IA | 2.0 | 1.0 | 896 | $700 | $0.78 | 43d | 1 | 0.27mi |
| 611 W 7th St Muscatine, IA | 3.0 | 1.5 | 964 | $1,250 | $1.30 | 43d | 1 | 0.69mi |
| 307 W 3rd St Unit A Muscatine, IA | 2.0 | 1.0 | 935 | $800 | $0.86 | 13d | 1 | 0.90mi |
| 318 1/2 Pine St Muscatine, IA | 2.0 | 1.0 | 816 | $775 | $0.95 | 20d | 1 | 0.91mi |
| 2715 Lucas St Muscatine, IA | 3.0 | 1.0 | 1000 | $1,000 | $1.00 | 20d | 1 | 0.97mi |
| 1609 Indiana St Muscatine, IA | 2.0 | 1.0 | 676 | $900 | $1.33 | 13d | 1 | 1.02mi |
| 101 W 7th St Muscatine, IA | 3.0 | 1.0 | 750 | $800 | $1.07 | 43d | 1 | 1.07mi |
Listing history 6 events
-
2026-05-20$45,000
-
2026-05-20historical
-
2011-08-29soldstatus $45,000
-
2011-08-26soldstatus $45,000 248-char remark
Show marketing remark (248 chars)
Nice home loaded with potential! Roof new '10, siding '06. Many more recent updates, inc: some bathroom fixtures, window, patio door, water heater. Possible 3rd bedroom. Garage has alley access. HSA Home Warranty, Sq. Ft. and lot size are approx.
-
2011-06-15$48,900 248-char remark
Show marketing remark (248 chars)
Nice home loaded with potential! Roof new '10, siding '06. Many more recent updates, inc: some bathroom fixtures, window, patio door, water heater. Possible 3rd bedroom. Garage has alley access. HSA Home Warranty, Sq. Ft. and lot size are approx.
-
1995-06-24soldstatus $40,000 237-char remark
Show marketing remark (237 chars)
SLIDING GLASS DOORS TO DECK OFF OF CUTE PORCH AREA LOCATED DIRECTLY BY DINING AREA. NEWER FLOOR COVERING IN SOME OF THE HOME. * * STOVE & REFRIG NEGO. SUBJECT TO PURCHASING HOME OF CHOICE. 0 POINTS AND CLOSING COSTS PAID BY SELLER
ⓘ Source: listings_history table (triggers on properties + properties_extension) + one-shot
backfill from property_details.listing_events for pre-trigger history.
Tax reassessment forecast IA · Partial reset (capped growth)
- Current annual tax
- $1,254 · $104/mo
- Projected year-2 tax
- $1,254 · $104/mo
- Expected delta
- $0/yr ($0/mo · 0.0%)
ⓘ Screening estimate from a state-policy table — verify with the county assessor before closing.
Climate risk First Street
- Flood 1/10 Low FEMA zone X · 0% chance over 30 yrs
- Wildfire 1/10 Low
- Heat 3/10 Moderate 7 d/yr ≥106°F today · 16 d/yr by 30 yrs out
- Wind 2/10 Low
- Air quality 2/10 Low 1 unhealthy d/yr today · 1 by 30 yrs out
Nearby sold comps map
Loading sold comps map…
Walkable amenities ~0.75 mi
Loading nearby amenities…
Taxation est. · year 1
- Rental income
- $9,565
- − Mortgage interest
- −$2,521
- − Property taxes
- −$1,254
- − Insurance
- −$225
- − Repairs & maintenance
- −$765
- − Management
- −$765
- − Depreciation
- −$1,309
- Taxable income
- $2,726
- Est. tax owed @ 24.0%
- −$654
- After-tax cash flow
- $2,591/yr
For passive investors: Depreciation is non-cash, so a rental often shows a tax loss while cash-flowing — sheltering income. Rental losses are passive: they offset passive income freely, and up to $25,000/yr can offset ordinary (W-2) income if you actively participate and your MAGI is under $100k (phasing out to $0 by $150k); unused losses carry forward. On sale, claimed depreciation is recaptured at up to 25%, and gains may owe capital-gains tax (a 1031 exchange can defer both). Figures are a year-1 estimate at your 24.0% rate — not tax advice; consult a CPA.
Schools (NCES district)
- District
- Muscatine Community School District
- NCES district ID
- 1920130
- Math proficiency
- 55% ▼ -7.00%
- Reading proficiency
- 59% ▲ 2.00%
- Median HH income
- $50,193
- Composite
- 48.6/100
- National rank
- #2110
- State rank
- #257 of 289 in IA
Livability — Muscatine
- Score
- 70/100
- State rank
- #358
- US rank
- #7508
Category grades
Schools grade is shown separately in the Schools card above.
Census & demographics
- Census place
- Muscatine, IA
- City population
- 29,800
- Population (ZIP)
- 29,800
Population outlook (Muscatine County) Hauer SSP2
- Today (2025)
- 44,820 people
- By 2030
- 45,461 · +1.4%
- By 2040
- 46,765 · +4.3%
- By 2050
- 48,609 · +8.5%
- By 2075
- 56,014 · +25.0%
- By 2100
- 63,513 · +41.7%
Race, ethnicity, and origin ACS 2023
- Neighborhood character
- Predominantly White (76%)
- Race & ethnicity
- White 76% Hispanic / Latino 17% Two or more races 5% Black 4%
- Hispanic origin (detail)
- Mexican 13%
- Common ancestry
- Portuguese 2% Romanian 2% Iranian 2%
- Foreign-born
- 7% · Canada
- Languages at home
- 86% English-only · Spanish 11% French/Haitian/Cajun 1% Other Indo-European 1%
Political lean MEDSL · Muscatine
- 2024 margin
- R (+14.9) · D 41.7% · R 56.6% · Other 1.7%
- 2008→2024 swing
- -30.6pp toward R · 2008: 15.7pp · 2024: -14.9pp
- All cycles
- 2024: R+14.9 2020: R+7.0 2016: R+6.6 2012: D+15.5 2008: D+15.7
Not yet ingested
- Civics
- —
Market trends
- HPI YoY
- ▼ -130.30%
- Current HPI
- 182.4493
- Rent YoY
- —
- Metro
- —
- State GDP YoY
- ▲ 2.48%
- F500 in state
- 4
Industry mix (Fortune 500 HQ in IA)
| Industry | F500 HQs | Revenue |
|---|---|---|
| Financial Services | 1 | $16B |
|
||
| Retail / Convenience | 1 | $15B |
|
||
Price history
+12.5% since first listed6 events — show timeline
- 2026-05-20 Delisted — Muscatine BOR
- 2026-05-20 Listed $45,000 Muscatine BOR
- 2011-08-29 Sold (Public Records) $45,000 Public Records
- 2011-08-26 Sold (MLS) $45,000 Muscatine BOR
- 2011-06-15 Listed $48,900 Muscatine BOR
- 1995-06-24 Sold (MLS) $40,000 Muscatine BOR
Property tax history
+1.0%/yrLatest (2025): $1,254 · +3.3% YoY. Source: county tax records.
Cash-flow waterfall
monthlySold comps — $/sqft
last 12 mo · ≤1 miLoading sold comps…