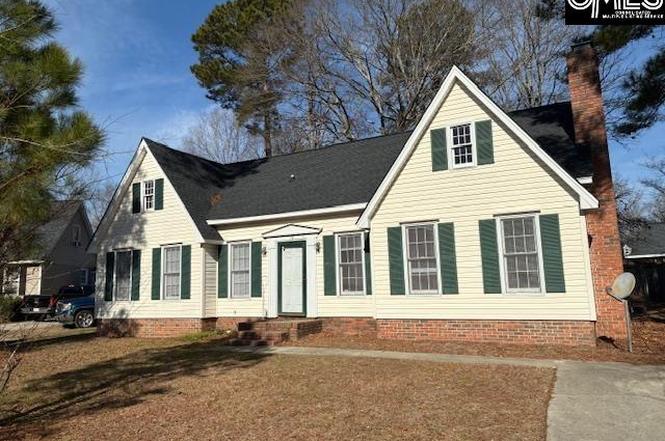
10 Cockspur Cir · Irmo, SC
Flood risk 1/10 · Minimal
- FEMA flood zone
- X (unshaded)
- Chance of flooding over 30 yrs
- 0.0%
- Est. flood insurance / yr
- $507 – $1,088
Fire risk 3/10 · Minor
- Est. fire insurance / yr
- $783 – $1,453
Heat risk 6/10 · Moderate
- Hot days now (above 108°F)
- 7 days/yr
- Hot days in 30 yrs
- 16 days/yr
Wind risk 6/10 · Moderate
- Chance of severe wind over 30 yrs
- 64.0%
Air-quality risk 3/10 · Minor
- Unhealthy air days now
- 3 days/yr
- Unhealthy air days in 30 yrs
- 3 days/yr
Risk factors via First Street. Map © Google.
Why this score? — see what drove the D grade
The composite is a weighted blend of 9 inputs, each scored 0–100. Each bar is that input's sub-score; the figure is the points it added to the 100-point composite (weight × sub-score).
- Cash flow +9.0/30.0
- ARV discount +7.5/15.0
- Appreciation +5.0/10.0
- Schools +4.5/10.0
- Livability +3.7/5.0
- 1% rule +2.8/10.0
- DSCR +2.5/10.0
- Rent growth +2.5/5.0
- Condition / age +2.5/5.0
$229,900
🖨 Deal sheet 📄 Offer letter ✓ Due diligence
Listing remarks
Home has been new paint entire house and repair done and wash look very nice neighbors home has through-out hardwood floor 3 bed 2 bath and nice large back yard locate cul-de-Sac area much more . .. .. . Disclaimer: CMLS has not reviewed and, therefore, does not endorse vendors who may appear in listings.
Key facts
- Hardwood floor
- Cul-de-sac area
- New paint
Tags
Property features AI
Exterior
- Utilities: Public water; Public sewer
- Home design: Single-story/main-level living (primary living spaces on main level)
- Construction: Slab foundation
- Exterior features: Vinyl exterior; Paved road access
Interior
- Kitchen: Eat-in kitchen with Formica countertops and stained wood cabinets; Dishwasher; Refrigerator; Free-standing range
- Bedrooms: Master bedroom on the main level with his-and-hers closets and private bath; Two additional main-level bedrooms with shared bath
- Flooring: Hardwood floors in formal living and great room
- Bathrooms: Two full bathrooms (including master bath)
- Heating & cooling: Central heating and cooling; Heat pump on the first level
- Interior features: Bay window in the formal living room; Hardwood floors in the formal living and great room; Fireplace (1)
- Laundry & utility: Mud room laundry on the main level
Neighborhood map
What this means for you Summary
Snapshot
- This is a 3-bed/2.0-bath single-family listed at $230k.
Deal economics
- At list price, monthly cash flow is $-180 ($-2k/yr) — negative.
- To cash-flow at today's rent, offer at most $198k (13.8% below list).
- To meet the 1% rule (rent ≥ 1% of price), the offer needs to be $180k (21.8% below list).
- Recommended offer: $180k (21.8% below list) — sets the bar for 1% rule.
Location & tenants
- Location reads 73/100 on livability (#38 in SC) — a middle-class / working-renter tenant base. Strengths: cost of living A+, housing A+, employment B; Watch: amenities F, commute F.
- Lexington 05 (suburban): math 47% / reading 55% proficiency, ranked #5 of 80 in SC (top 6%) — acceptable for families but not a draw, mixed tenant base, ~2y average lease.
- Zoned schools: H. E. Corley Elementary (math 42% / reading 52%, grade D-, #209 of 597 statewide, top 36%, 558 students, 74% FRL); Dutch Fork High (math 54% / reading 86%, grade B+, #58 of 196 statewide, top 30%, 1,726 students, 52% FRL) — zoned schools average 63% FRL vs 27% district-wide (36 pts higher); higher-poverty schools than district average — tighter screening recommended.
- Market conditions: 1 active listings in the ZIP; 10 comparable units currently listed for rent nearby; rentals at typical pace (median 14d on market — plan ~3-4 weeks tenant-placement turnaround); 3,472 units permitted in Richland County in 2024 (1,096 in 5+ unit buildings).
Forward outlook
- In year one you build about $8k of equity ($2k loan paydown + $7k appreciation (3.0% local appreciation)).
- Richland County population projected at +30% by 2050 — long-run rental-demand tailwind backs the buy-and-hold thesis.
- By year 5, paydown + projected appreciation supports a ~$37k cash-out refi (75% LTV) — recoverable capital for the next deal without selling this one.
Negotiation context
- It's been on market 131 days — a 12% lower offer ($202k) is reasonable based on typical stale-listing flexibility.
- Current owner paid $90k; list at $230k implies a 156% gain — meaningful room to come down on a strong offer.
Risks & watch-outs
- Climate carrying-cost: major wind risk, 64% chance of damaging wind over 30y; extreme-heat days projected 7→16/yr by 2055 (HVAC capex compounding) — expect insurance premiums to compound above CPI over the hold.
Questions for the listing agent
- What do current leases actually rent for vs. the listed asking? Can we see a recent rent roll and the last 12 months of T-12 income?
- It's been on market 131 days. Have you received any prior offers? Is the seller open to a 22% concession, seller financing, or rate buy-down credit?
- Why hasn't it sold? Are there any deal-killer items the seller is aware of (foundation, flood, title, zoning, code violations)?
- Is there a deadline driving the sale (1031 exchange, divorce, estate, relocation)? That informs how much negotiation room exists.
- Schools are B-rated — typically a magnet for longer-tenancy family renters. What's the average tenant stay here, and is there a school-zone premium baked into asking?
- The area grade is low — what's the realistic commute time and amenity access for the typical tenant pool here? Any planned neighborhood developments (good or bad) we should know about?
- What's the average days-on-market for RENTAL listings here right now (not sales)? A rising rental-DOM trend means longer vacancies and softer asking-rent achievability than the comps imply.
- What's the recent tenant-quality profile in this submarket — average credit score on applications, eviction rate, late-payment / NSF rate, and stable-employment percentage? A property-management company in the area should have these aggregated.
- How much new for-sale + rental construction is in the pipeline within 1–3 miles? Heavy new supply typically softens prices + rents 12–24 months out; constrained supply supports both.
Investment metrics
- 1% rule
- 0.78% ✗
- Cap rate
- 5.36%
- Cash-on-cash
- -3.35%
- DSCR
- 0.85
- GRM
- 10.7
CMA / ARV
No comps found within radius.
Projected returns pro-forma
3.0% appreciation · 3.0% rent growth · sell at horizon
- IRR
- 4.4%
- Equity multiple
- 1.25×
- Total profit
- $16,290
- Equity at exit
- $103,373
- IRR
- 7.6%
- Equity multiple
- 2.15×
- Total profit
- $74,106
- Equity at exit
- $159,310
Cash invested: $64,372 (down + closing). Projections, not guarantees.
Landlord ↔ Tenant lean methodology
- Overall (STATE)
- 90 Strongly Landlord-Friendly
- State South Carolina
- 90 Strongly Landlord-Friendly · R+6
- County
- — inherits STATE
- City
- — inherits STATE
ZIP-level market 29063-2760
- Active inventory
- 1
- Price-to-rent
- 10.7×
Monthly cashflow live
- Estimated rent
- $1,798 high interval (Pro) →
- Mortgage (P&I)
- −$1,206
- Tax from tax record
- −$299 /mo · $3,586/yr
- Insurance
- −$96
- HOA
- −$0
- Vacancy / Maint / Mgmt
- −$378
- Net cashflow
- $-180
Break-even live
UW: 25.0% down · 7.5% · 30yr · 1.5% tax · 5.0% vac · 8.0% maint · 8.0% mgmt
Financing live
Cash to close
- Down payment
- $57,475
- Closing costs
- $6,897
- Reserves months
- —
- Total cash needed
- —
Loan-product check · same deal, 3 products live
Conventional
25% down · 7.5% · 30yr
- Down + closing
- —
- Monthly P&I
- —
- Monthly cashflow
- —
- DSCR
- —
- Eligible?
- —
Personal DTI + credit; lowest rate.
DSCR
20% down · 8.5% · 30yr
- Down + closing
- —
- Monthly P&I
- —
- Monthly cashflow
- —
- DSCR
- —
- Eligible?
- —
No personal income docs; deal must DSCR.
Hard money
10% down · 12.0% · 12mo
- Down + closing
- —
- Monthly P&I
- —
- Monthly cashflow
- —
- DSCR
- —
- Eligible?
- —
Short-term bridge; refi at stabilization.
Rent comps 10 comps
| Address | Beds | Baths | Sqft | Rent | $/sqft | DOM | Units | Dist |
|---|---|---|---|---|---|---|---|---|
| 530 Chadford Rd Irmo, SC | 3.0 | 2.0 | 1196 | $1,695 | $1.42 | 14d | 1 | 0.12mi |
| 312 Bow Church Rd Irmo, SC | 3.0 | 2.0 | 1505 | $1,861 | $1.24 | 11d | 1 | 0.14mi |
| 508 Cornerstone Cir Irmo, SC | 3.0 | 2.0 | 1867 | $2,200 | $1.18 | 23d | 1 | 0.30mi |
| 228 Chadford Rd Irmo, SC | 3.0 | 2.0 | 1318 | $1,861 | $1.41 | 14d | 1 | 0.42mi |
| 22 Dean Crest Ct Irmo, SC | 3.0 | 2.0 | 1301 | $1,695 | $1.30 | 3d | 1 | 0.43mi |
| 136 Weston Watch Rd Irmo, SC | 3.0 | 2.0 | 1200 | $1,695 | $1.41 | 3d | 1 | 0.65mi |
| 13 Dyers Hall Ct Irmo, SC | 3.0 | 2.0 | 1127 | $1,699 | $1.51 | 23d | 1 | 0.78mi |
| 1 Crescent Ln Columbia, SC | 2.0 | 1.5 | 1300 | $1,380 | $1.06 | 2d | 1 | 1.00mi |
| 108 Cranewater Dr Columbia, SC | 3.0 | 2.5 | 1600 | $1,795 | $1.12 | 23d | 1 | 1.40mi |
| 104 Tuscany Ct Irmo, SC | 3.0 | 2.5 | 1248 | $1,850 | $1.48 | 14d | 1 | 1.47mi |
Listing history 17 events
-
2026-06-18days on market $229,900 Active 131 DOM
-
2026-06-17days on market $229,900 Active 130 DOM
-
2026-06-16days on market $229,900 Active 129 DOM
-
2026-06-15days on market $229,900 Active 128 DOM
-
2026-06-14days on market $229,900 Active 126 DOM
-
2026-06-13days on market $229,900 Active 125 DOM
-
2026-06-10days on market $229,900 Active 123 DOM
-
2026-06-09days on market $229,900 Active 122 DOM
-
2026-06-08days on market $229,900 Active 121 DOM
-
2026-06-07days on market $229,900 Active 120 DOM
-
2026-06-03days on market $229,900 Active 116 DOM
-
2026-06-03days on market $229,900 Active 115 DOM
-
2026-06-01days on market $229,900 Active 114 DOM
-
2026-05-31days on market $229,900 Active 113 DOM
-
2026-02-06$229,900 Active
-
2000-01-27soldstatus $89,900
-
1983-12-01soldstatus $10,000
ⓘ Source: listings_history table (triggers on properties + properties_extension) + one-shot
backfill from property_details.listing_events for pre-trigger history.
Tax reassessment forecast SC · Resets to sale price
- Current annual tax
- $3,586 · $299/mo
- Projected year-2 tax
- $3,586 · $299/mo
- Expected delta
- $0/yr ($0/mo · 0.0%)
ⓘ Screening estimate from a state-policy table — verify with the county assessor before closing.
Climate risk First Street
- Flood 1/10 Low FEMA zone X (unshaded) · 0% chance over 30 yrs
- Wildfire 3/10 Moderate
- Heat 6/10 Major 7 d/yr ≥108°F today · 16 d/yr by 30 yrs out
- Wind 6/10 Major 64% chance of damaging wind over 30 yrs
- Air quality 3/10 Moderate 3 unhealthy d/yr today · 3 by 30 yrs out
Nearby sold comps map
Loading sold comps map…
Walkable amenities ~0.75 mi
Loading nearby amenities…
Taxation est. · year 1
- Rental income
- $21,579
- − Mortgage interest
- −$12,878
- − Property taxes
- −$3,586
- − Insurance
- −$1,150
- − Repairs & maintenance
- −$1,726
- − Management
- −$1,726
- − Depreciation
- −$6,688
- Taxable loss
- −$6,175
- Est. tax savings @ 24.0%
- +$1,482
- After-tax cash flow
- $-673/yr
For passive investors: Depreciation is non-cash, so a rental often shows a tax loss while cash-flowing — sheltering income. Rental losses are passive: they offset passive income freely, and up to $25,000/yr can offset ordinary (W-2) income if you actively participate and your MAGI is under $100k (phasing out to $0 by $150k); unused losses carry forward. On sale, claimed depreciation is recaptured at up to 25%, and gains may owe capital-gains tax (a 1031 exchange can defer both). Figures are a year-1 estimate at your 24.0% rate — not tax advice; consult a CPA.
Schools (NCES district)
- District
- Lexington 05
- NCES district ID
- 4502820
- Math proficiency
- 47% ▼ -7.00%
- Reading proficiency
- 55% ▼ -4.00%
- Median HH income
- $67,732
- Composite
- 45.28/100
- National rank
- #2656
- State rank
- #5 of 80 in SC
Livability — Irmo
- Score
- 73/100
- State rank
- #38
- US rank
- #5024
Category grades
Schools grade is shown separately in the Schools card above.
Census & demographics
- Census place
- Irmo, SC
Population outlook (Richland County) Hauer SSP2
- Today (2025)
- 459,667 people
- By 2030
- 487,524 · +6.1%
- By 2040
- 542,035 · +17.9%
- By 2050
- 595,371 · +29.5%
- By 2075
- 732,998 · +59.5%
- By 2100
- 820,415 · +78.5%
Not yet ingested
- Political lean
- —
- Race & ethnicity
- —
- Common origin
- —
- Civics
- —
Market trends
- HPI YoY
- —
- Current HPI
- —
- Rent YoY
- —
- Metro
- —
- State GDP YoY
- ▲ 4.51%
- F500 in state
- 2
Industry mix (Fortune 500 HQ in SC)
| Industry | F500 HQs | Revenue |
|---|---|---|
| Packaging | 1 | $7B |
|
||
Price history
+2199.0% since first listed3 events — show timeline
- 2026-02-06 Listed $229,900 Consolidated MLS
- 2000-01-27 Sold (Public Records) $89,900 Public Records
- 1983-12-01 Sold (Public Records) $10,000 Public Records
Property tax history
+3.7%/yrLatest (2025): $3,586 · +0.7% YoY. Source: county tax records.
Cash-flow waterfall
monthlySold comps — $/sqft
last 12 mo · ≤1 miLoading sold comps…