227 Portage Lakes Dr · Portage Lakes, OH
Flood risk 4/10 · Minor
- FEMA flood zone
- X (unshaded)
- Chance of flooding over 30 yrs
- 0.22%
- Est. flood insurance / yr
- $507 – $1,088
Fire risk 1/10 · Minimal
- Est. fire insurance / yr
- $713 – $1,323
Heat risk 3/10 · Minor
- Hot days now (above 97°F)
- 7 days/yr
- Hot days in 30 yrs
- 17 days/yr
Wind risk 1/10 · Minimal
- Chance of severe wind over 30 yrs
- —
Air-quality risk 2/10 · Minimal
- Unhealthy air days now
- 1 days/yr
- Unhealthy air days in 30 yrs
- 2 days/yr
Risk factors via First Street. Map © Google.
Why this score? — see what drove the B grade
The composite is a weighted blend of 9 inputs, each scored 0–100. Each bar is that input's sub-score; the figure is the points it added to the 100-point composite (weight × sub-score).
- Cash flow +30.0/30.0
- 1% rule +10.0/10.0
- DSCR +10.0/10.0
- ARV discount +7.5/15.0
- Schools +5.0/10.0
- Livability +3.2/5.0
- Rent growth +2.5/5.0
- Condition / age +2.5/5.0
- Appreciation +0.0/10.0
$169,000
🖨 Deal sheet 📄 Offer letter ✓ Due diligence
Listing remarks MLS
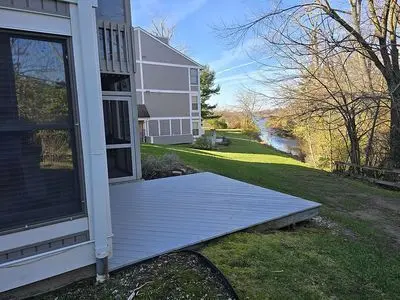
Close to boating and fishing, screened porch, lakeview. Extra garage (#10) to be sold with condo
Key facts
- Built 1986
Neighborhood map
What this means for you Summary
Snapshot
- This is a 2-bed/2.0-bath condo listed at $169k.
Deal economics
- At list price, monthly cash flow is $1k ($16k/yr) — positive.
- The deal already cash-flows at list — no discount required.
- Meets the 1% rule at list price ($4k rent vs $169k).
Location & tenants
- Location reads 64/100 on livability (#772 in OH) — a middle-class / working-renter tenant base. Strengths: cost of living A+, housing A+, crime B+; Watch: employment D+, schools D-, amenities F.
- Coventry Local (suburban): math 52% / reading 64% proficiency, ranked #315 of 656 in OH (top 48%) — acceptable for families but not a draw, mixed tenant base, ~2y average lease.
- Market conditions: 90 active listings in the ZIP; 3 comparable units currently listed for rent nearby; rentals at typical pace (median 14d on market — plan ~3-4 weeks tenant-placement turnaround); 1,114 units permitted in Summit County in 2024 (397 in 5+ unit buildings).
- At $3,763/mo this rent would consume 60% of the median local household income ($75k/yr) — very limited rent-growth headroom before tenants either downsize or default.
Forward outlook
- Local home prices are declining (-3.0%/yr); year-one equity from $1k of loan paydown is wiped out by about $5k of value loss. Plan a longer hold.
- Summit County population projected to shrink 6% by 2050 — rents likely to lag national; underwrite the cash flow, not the appreciation.
- At projected returns (-3.0% appreciation + 3.0% rent growth), your $47k cash investment doubles in ~4 years — after that, you're playing with house money.
Negotiation context
- Only 0 days on market — expect competitive offers; lowballing is unlikely to land.
- 2 sale attempts since 24y ago with the ask held roughly flat each time — persistent listings suggest the price (not the market) is what's stuck; bring a comps-based counter.
- Current owner paid $110k; list at $169k implies a 54% gain — meaningful room to come down on a strong offer.
Questions for the listing agent
- What does the HOA fee cover, when was the last increase, and are there any pending special assessments or reserve-fund shortfalls?
- Any open or pending special assessments — roof, HVAC, plumbing, elevator, façade? What's the per-unit balance and payoff schedule, and is the seller paying it off at close or rolling it to the buyer?
- Is there a deadline driving the sale (1031 exchange, divorce, estate, relocation)? That informs how much negotiation room exists.
- Schools are D-rated, which usually means shorter tenancies and higher turnover. Who's the typical renter profile here, and what's been the actual vacancy rate?
- What's the average days-on-market for RENTAL listings here right now (not sales)? A rising rental-DOM trend means longer vacancies and softer asking-rent achievability than the comps imply.
- What's the recent tenant-quality profile in this submarket — average credit score on applications, eviction rate, late-payment / NSF rate, and stable-employment percentage? A property-management company in the area should have these aggregated.
- How much new apartment / multifamily construction is in the pipeline within 1–3 miles? Heavy new supply (>2% of stock underway) typically softens rents 12–24 months out; light construction supports rent growth.
Investment metrics
- 1% rule
- 2.23% ✓
- Cap rate
- 15.95%
- Cash-on-cash
- 34.50%
- DSCR
- 2.54
- GRM
- 3.7
CMA / ARV
No comps found within radius.
Projected returns pro-forma
-3.0% appreciation · 3.0% rent growth · sell at horizon
- IRR
- 30.1%
- Equity multiple
- 2.26×
- Total profit
- $59,599
- Equity at exit
- $25,198
- IRR
- 37.4%
- Equity multiple
- 4.48×
- Total profit
- $164,819
- Equity at exit
- $14,612
Cash invested: $47,320 (down + closing). Projections, not guarantees.
Landlord ↔ Tenant lean methodology
- Overall (STATE)
- 73 Landlord-Friendly
- State Ohio
- 73 Landlord-Friendly · R+6
- County
- — inherits STATE
- City
- — inherits STATE
ZIP-level market 44319
- Active inventory
- 90
- Price-to-rent
- 3.7×
Monthly cashflow live
- Estimated rent
- $3,763 medium interval (Pro) →
- Mortgage (P&I)
- −$886
- Tax from tax record
- −$311 /mo · $3,726/yr
- Insurance
- −$70
- HOA est. from 4 same-building comps
- −$345
- Vacancy / Maint / Mgmt
- −$790
- Net cashflow
- $1,361
Break-even live
UW: 25.0% down · 7.5% · 30yr · 1.5% tax · 5.0% vac · 8.0% maint · 8.0% mgmt
Financing live
Cash to close
- Down payment
- $42,250
- Closing costs
- $5,070
- Reserves months
- —
- Total cash needed
- —
Loan-product check · same deal, 3 products live
Conventional
25% down · 7.5% · 30yr
- Down + closing
- —
- Monthly P&I
- —
- Monthly cashflow
- —
- DSCR
- —
- Eligible?
- —
Personal DTI + credit; lowest rate.
DSCR
20% down · 8.5% · 30yr
- Down + closing
- —
- Monthly P&I
- —
- Monthly cashflow
- —
- DSCR
- —
- Eligible?
- —
No personal income docs; deal must DSCR.
Hard money
10% down · 12.0% · 12mo
- Down + closing
- —
- Monthly P&I
- —
- Monthly cashflow
- —
- DSCR
- —
- Eligible?
- —
Short-term bridge; refi at stabilization.
Rent comps 3 comps
| Address | Beds | Baths | Sqft | Rent | $/sqft | DOM | Units | Dist |
|---|---|---|---|---|---|---|---|---|
| 686 Portage Lakes Dr Coventry Township, OH | 2.0 | 1.0 | 882 | $1,695 | $1.92 | 23d | 1 | 0.48mi |
| 829 Portage Lakes Dr Unit 1496076P Akron, OH | 3.0 | 1.0 | 1356 | $7,700 | $5.68 | 14d | 1 | 0.62mi |
| 234 Mallard Point Dr Akron, OH | 1.0–2.0 | 1.0–2.0 | 945 | $1,530 | $1.62 | 14d | 18 | 0.81mi |
HOA detail condo
- Monthly dues
- $0 · $0/yr
- Assessments
- None detected in remarks — confirm with the listing agent.
Listing history 6 events
-
2026-05-26$169,000
-
2017-07-17soldstatus $110,000
-
2013-12-31soldstatus $72,000
-
2003-04-03soldstatus $89,000 96-char remark
Show marketing remark (96 chars)
Close to boating and fishing, screened porch, lakeview. Extra garage (#10) to be sold with condo
-
2003-04-02soldstatus $89,000
-
2002-09-20$93,000 96-char remark
Show marketing remark (96 chars)
Close to boating and fishing, screened porch, lakeview. Extra garage (#10) to be sold with condo
ⓘ Source: listings_history table (triggers on properties + properties_extension) + one-shot
backfill from property_details.listing_events for pre-trigger history.
Tax reassessment forecast OH · Partial reset (capped growth)
- Current annual tax
- $3,726 · $311/mo
- Projected year-2 tax
- $3,726 · $311/mo
- Expected delta
- $0/yr ($0/mo · 0.0%)
ⓘ Screening estimate from a state-policy table — verify with the county assessor before closing.
Climate risk First Street
- Flood 4/10 Moderate FEMA zone X (unshaded) · 22% chance over 30 yrs
- Wildfire 1/10 Low
- Heat 3/10 Moderate 7 d/yr ≥97°F today · 17 d/yr by 30 yrs out
- Wind 1/10 Low
- Air quality 2/10 Low 1 unhealthy d/yr today · 2 by 30 yrs out
Nearby sold comps map
Loading sold comps map…
Walkable amenities ~0.75 mi
Loading nearby amenities…
Taxation est. · year 1
- Rental income
- $45,156
- − Mortgage interest
- −$9,467
- − Property taxes
- −$3,726
- − Insurance
- −$845
- − Repairs & maintenance
- −$3,612
- − Management
- −$3,612
- − HOA
- −$4,140
- − Depreciation
- −$4,916
- Taxable income
- $14,836
- Est. tax owed @ 24.0%
- −$3,561
- After-tax cash flow
- $12,766/yr
For passive investors: Depreciation is non-cash, so a rental often shows a tax loss while cash-flowing — sheltering income. Rental losses are passive: they offset passive income freely, and up to $25,000/yr can offset ordinary (W-2) income if you actively participate and your MAGI is under $100k (phasing out to $0 by $150k); unused losses carry forward. On sale, claimed depreciation is recaptured at up to 25%, and gains may owe capital-gains tax (a 1031 exchange can defer both). Figures are a year-1 estimate at your 24.0% rate — not tax advice; consult a CPA.
Schools (NCES district)
- District
- Coventry Local
- NCES district ID
- 3904999
- Math proficiency
- 52% ▼ -13.00%
- Reading proficiency
- 64% ▼ -2.00%
- Median HH income
- $52,981
- Composite
- 49.66/100
- National rank
- #1976
- State rank
- #315 of 656 in OH
Livability — Portage Lakes
- Score
- 64/100
- State rank
- #772
- US rank
- #14032
Category grades
Schools grade is shown separately in the Schools card above.
Census & demographics
- Census place
- Portage Lakes, OH
- County
- Summit · 539,389 people
- Metro
- Akron, OH
- Population (ZIP)
- 21,469
- Household income
- $74,781
- Rent vs Own
- Severe rent burden
- 12.4
Population outlook (Summit County) Hauer SSP2
- Today (2025)
- 546,583 people
- By 2030
- 544,028 · -0.5%
- By 2040
- 531,363 · -2.8%
- By 2050
- 514,923 · -5.8%
- By 2075
- 481,765 · -11.9%
- By 2100
- 432,265 · -20.9%
Race, ethnicity, and origin ACS 2023
- Neighborhood character
- Predominantly White (91%)
- Race & ethnicity
- White 91% Two or more races 4% Black 2% Hispanic / Latino 2% Asian 2%
- Common ancestry
- Romanian 5% Slovak 2% Serbian 1%
- Foreign-born
- 2% · China, Vietnam
- Languages at home
- 97% English-only · Other Indo-European 1% Spanish 1% Chinese 1%
Political lean MEDSL · Summit
- 2024 margin
- Lean D (+7.0) · D 53.0% · R 46.0%
- 2008→2024 swing
- -9.6pp toward R · 2008: 16.6pp · 2024: 7.0pp
- All cycles
- 2024: D+7.0 2020: D+9.6 2016: D+8.2 2012: D+14.8 2008: D+16.6
Not yet ingested
- Civics
- —
Market trends
- HPI YoY
- ▼ -236.58%
- Current HPI
- 213.2267
- Rent YoY
- —
- Metro
- —
- State GDP YoY
- ▲ 1.98%
- F500 in state
- 48
Industry mix (Fortune 500 HQ in OH)
| Industry | F500 HQs | Revenue |
|---|---|---|
| Insurance | 3 | $145B |
|
||
| Industrial Machinery | 3 | $49B |
|
||
| Financial Services | 3 | $24B |
|
||
| Consumer Goods | 2 | $93B |
|
||
| Aerospace / Defense | 2 | $47B |
|
||
| Utilities | 2 | $33B |
|
||
Price history
+81.7% since first listed6 events — show timeline
- 2026-05-26 Listed $169,000 FSBO.com
- 2017-07-17 Sold (Public Records) $110,000 Public Records
- 2013-12-31 Sold (Public Records) $72,000 Public Records
- 2003-04-03 Sold (MLS) $89,000 MLSNOW
- 2003-04-02 Sold (Public Records) $89,000 Public Records
- 2002-09-20 Listed $93,000 MLSNOW
Property tax history
+8.2%/yrLatest (2025): $3,726 · +2.2% YoY. Source: county tax records.
Cash-flow waterfall
monthlySold comps — $/sqft
last 12 mo · ≤1 miLoading sold comps…