4834 Center Point Rd · Tompkinsville, KY
Flood risk No data
- FEMA flood zone
- —
- Chance of flooding over 30 yrs
- —
- Est. flood insurance / yr
- —
Fire risk No data
- Est. fire insurance / yr
- —
Heat risk No data
- Hot days now (above threshold)
- —
- Hot days in 30 yrs
- —
Wind risk No data
- Chance of severe wind over 30 yrs
- —
Air-quality risk No data
- Unhealthy air days now
- —
- Unhealthy air days in 30 yrs
- —
Risk factors via First Street. Map © Google.
Why this score? — see what drove the B- grade
The composite is a weighted blend of 9 inputs, each scored 0–100. Each bar is that input's sub-score; the figure is the points it added to the 100-point composite (weight × sub-score).
- Cash flow +30.0/30.0
- DSCR +10.0/10.0
- 1% rule +9.2/10.0
- ARV discount +7.5/15.0
- Livability +3.7/5.0
- Schools +3.4/10.0
- Rent growth +2.5/5.0
- Condition / age +1.0/5.0
- Appreciation +0.0/10.0
$65,000
🖨 Deal sheet (PDF) 📄 Offer letter ✓ Due diligence
Listing remarks MLS
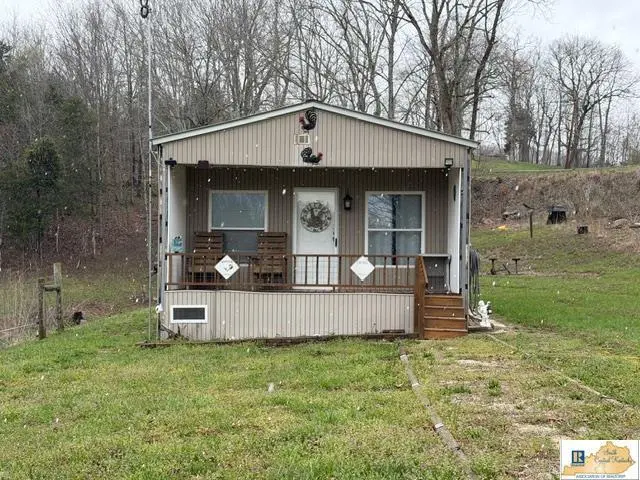
Looking for a getaway then look no further. This mini home is located approx. 4 miles from McMillans Ferry on the mighty Cumberland river. This home sets on 1.45 acres of country. This home is heated by solar, has county water available and the location speaks for itself.
Key facts
- County water
- Cumberland river
- Solar heating
Tags
Neighborhood map
What this means for you Summary
Snapshot
- This is a 1-bed/1.0-bath single-family listed at $65k. Condition is rated poor.
Deal economics
- At list price, monthly cash flow is $278 ($3k/yr) — positive.
- The deal already cash-flows at list — no discount required.
- Meets the 1% rule at list price ($921 rent vs $65k).
- Recommended offer: $59k (9.0% below list) — sets the bar for market timing.
- Cap rate 11.4% vs local median 4.3% in Tompkinsville — top-decile yield for the area; either an underpriced asset or a hidden risk that comps aren't pricing in. Stress-test before assuming the spread holds.
Location & tenants
- Location reads 73/100 on livability (#116 in KY) — a middle-class / working-renter tenant base. Strengths: crime A+, cost of living A+, housing A+; Watch: schools C-, health & safety C-, amenities F.
- Monroe County (rural): math 36% / reading 48% proficiency, ranked #28 of 165 in KY (top 17%) — families likely to look elsewhere, expect single-tenant / working-renter base with shorter leases.
- Market conditions: 29 active listings in the ZIP.
Forward outlook
- Local home prices are declining (-3.0%/yr); year-one equity from $449 of loan paydown is wiped out by about $2k of value loss. Plan a longer hold.
- Monroe County population projected at -20% by 2050 — secular population decline; favor cash flow + early exit over multi-decade hold.
- At projected returns (-3.0% appreciation + 3.0% rent growth), your $18k cash investment doubles in ~7 years — after that, you're playing with house money.
Negotiation context
- It's been on market 94 days — a 9% lower offer ($59k) is reasonable based on typical stale-listing flexibility.
Questions for the listing agent
- It's been on market 94 days. Have you received any prior offers? Is the seller open to a 9% concession, seller financing, or rate buy-down credit?
- Have any recent inspections been done? Can we get a copy of the seller's disclosures and any deferred-maintenance estimates?
- Why hasn't it sold? Are there any deal-killer items the seller is aware of (foundation, flood, title, zoning, code violations)?
- Is there a deadline driving the sale (1031 exchange, divorce, estate, relocation)? That informs how much negotiation room exists.
- What's the average days-on-market for RENTAL listings here right now (not sales)? A rising rental-DOM trend means longer vacancies and softer asking-rent achievability than the comps imply.
- What's the recent tenant-quality profile in this submarket — average credit score on applications, eviction rate, late-payment / NSF rate, and stable-employment percentage? A property-management company in the area should have these aggregated.
- How much new for-sale + rental construction is in the pipeline within 1–3 miles? Heavy new supply typically softens prices + rents 12–24 months out; constrained supply supports both.
Investment metrics
- 1% rule
- 1.42% ✓
- Cap rate
- 11.43%
- Cash-on-cash
- 18.36%
- DSCR
- 1.82
- GRM
- 5.9
CMA / ARV
No comps found within radius.
Projected returns pro-forma
-3.0% appreciation · 3.0% rent growth · sell at horizon
- IRR
- 10.0%
- Equity multiple
- 1.40×
- Total profit
- $7,214
- Equity at exit
- $9,692
- IRR
- 19.2%
- Equity multiple
- 2.60×
- Total profit
- $29,172
- Equity at exit
- $5,620
Cash invested: $18,200 (down + closing). Projections, not guarantees.
Landlord ↔ Tenant lean methodology
- Overall (STATE)
- 83 Strongly Landlord-Friendly
- State Kentucky
- 83 Strongly Landlord-Friendly · R+16
- County
- — inherits STATE
- City
- — inherits STATE
ZIP-level market 42167
- Home prices YoY
- -10.6%
- Active inventory
- 29
- Price-to-rent
- 5.9×
Monthly cashflow live
- Estimated rent
- $921 medium interval (Pro) →
- Mortgage (P&I)
- −$341
- Tax est. 1.5%
- −$81 /mo · $975/yr
- Insurance
- −$27
- HOA
- −$0
- Vacancy / Maint / Mgmt
- −$193
- Net cashflow
- $278
Break-even live
Sensitivity live
| Price | -10% $323 | -5% $301 | +0% $278 | +5% $256 | +10% $234 |
|---|---|---|---|---|---|
| Rent | -10% $206 | -5% $242 | +0% $278 | +5% $315 | +10% $351 |
| Rate | -1.0pp $311 | -0.5pp $295 | base $278 | +0.5pp $262 | +1.0pp $244 |
UW: 25.0% down · 7.5% · 30yr · 1.5% tax · 5.0% vac · 8.0% maint · 8.0% mgmt
Financing live
Cash to close
- Down payment
- $16,250
- Closing costs
- $1,950
- Reserves months
- —
- Total cash needed
- —
Loan-product check · same deal, 3 products live
Conventional
25% down · 7.5% · 30yr
- Down + closing
- —
- Monthly P&I
- —
- Monthly cashflow
- —
- DSCR
- —
- Eligible?
- —
Personal DTI + credit; lowest rate.
DSCR
20% down · 8.5% · 30yr
- Down + closing
- —
- Monthly P&I
- —
- Monthly cashflow
- —
- DSCR
- —
- Eligible?
- —
No personal income docs; deal must DSCR.
Hard money
10% down · 12.0% · 12mo
- Down + closing
- —
- Monthly P&I
- —
- Monthly cashflow
- —
- DSCR
- —
- Eligible?
- —
Short-term bridge; refi at stabilization.
Listing history 17 events
-
2026-06-21days on market $65,000 Active 94 DOM
-
2026-06-18days on market $65,000 Active 92 DOM
-
2026-06-17days on market $65,000 Active 91 DOM
-
2026-06-16days on market $65,000 Active 90 DOM
-
2026-06-15days on market $65,000 Active 89 DOM
-
2026-06-13days on market $65,000 Active 87 DOM
-
2026-06-12days on market $65,000 Active 86 DOM
-
2026-06-09days on market $65,000 Active 83 DOM
-
2026-06-08days on market $65,000 Active 82 DOM
-
2026-06-07days on market $65,000 Active 81 DOM
-
2026-06-07days on market $65,000 Active 80 DOM
-
2026-06-04days on market $65,000 Active 77 DOM
-
2026-06-02days on market $65,000 Active 76 DOM
-
2026-06-01days on market $65,000 Active 75 DOM
-
2026-05-31days on market $65,000 Active 74 DOM
-
2026-05-31days on market $65,000 Active 73 DOM
-
2026-03-18$65,000 Active 272-char remark
Show marketing remark (272 chars)
Looking for a getaway then look no further. This mini home is located approx. 4 miles from McMillans Ferry on the mighty Cumberland river. This home sets on 1.45 acres of country. This home is heated by solar, has county water available and the location speaks for itself.
ⓘ Source: listings_history table (triggers on properties + properties_extension) + one-shot
backfill from property_details.listing_events for pre-trigger history.
Nearby sold comps map
Loading sold comps map…
Walkable amenities ~0.75 mi
Loading nearby amenities…
Taxation est. · year 1
- Rental income
- $11,052
- − Mortgage interest
- −$3,641
- − Property taxes
- −$975
- − Insurance
- −$325
- − Repairs & maintenance
- −$884
- − Management
- −$884
- − Depreciation
- −$1,891
- Taxable income
- $2,452
- Est. tax owed @ 24.0%
- −$589
- After-tax cash flow
- $2,753/yr
For passive investors: Depreciation is non-cash, so a rental often shows a tax loss while cash-flowing — sheltering income. Rental losses are passive: they offset passive income freely, and up to $25,000/yr can offset ordinary (W-2) income if you actively participate and your MAGI is under $100k (phasing out to $0 by $150k); unused losses carry forward. On sale, claimed depreciation is recaptured at up to 25%, and gains may owe capital-gains tax (a 1031 exchange can defer both). Figures are a year-1 estimate at your 24.0% rate — not tax advice; consult a CPA.
Condition & rehab AI · 7 photos
This property requires extensive repairs and maintenance to improve its condition and increase its value. The roof, exterior siding, flooring, interior walls, HVAC system, landscaping, and fencing are all in poor condition and need significant work.
Repairs flagged
- Major roof — The roof appears to be made of corrugated metal and shows signs of wear and tear.
- Major exterior siding — The siding is weathered and shows significant wear.
- Major flooring — The flooring appears to be vinyl or linoleum and is in poor condition.
- Major interior walls — The interior walls are bare and show signs of wear.
- Major HVAC system — The HVAC system appears to be old and may need replacement.
- Major landscaping — The landscaping is sparse and unkempt.
- Major fencing — The fencing is in poor condition and appears to be made of wood planks that are rotting and broken.
Value-add opportunities
- Both roof replacement — A new roof would significantly improve the home's appearance and increase its value.
- Both exterior siding repair — Repairing the siding would improve the home's appearance and increase its value.
- Both flooring replacement — Replacing the flooring would improve the home's appearance and increase its value.
- Both interior wall repair — Repairing the interior walls would improve the home's appearance and increase its value.
- Both HVAC system replacement — Replacing the HVAC system would improve the home's comfort and increase its value.
- Both landscaping — Landscaping would improve the home's curb appeal and increase its value.
- Both fencing repair — Repairing the fencing would improve the home's appearance and increase its value.
Renovation cost estimate screening
| Repair item | Severity | Est. cost |
|---|---|---|
| roof · The roof appears to be made of corrugated metal and shows signs of wear and tear. | Major | $15,000–50,000 |
| exterior siding · The siding is weathered and shows significant wear. | Major | $15,000–50,000 |
| flooring · The flooring appears to be vinyl or linoleum and is in poor condition. | Major | $15,000–50,000 |
| interior walls · The interior walls are bare and show signs of wear. | Major | $15,000–50,000 |
| HVAC system · The HVAC system appears to be old and may need replacement. | Major | $15,000–50,000 |
| landscaping · The landscaping is sparse and unkempt. | Major | $15,000–50,000 |
| fencing · The fencing is in poor condition and appears to be made of wood planks that are rotting and broken. | Major | $15,000–50,000 |
| Total estimated repair cost · 7 items | $105,000–350,000 |
Value-add ROI direction
- Both roof replacement — A new roof would significantly improve the home's appearance and increase its value. ↑
- Both exterior siding repair — Repairing the siding would improve the home's appearance and increase its value. ↑
- Both flooring replacement — Replacing the flooring would improve the home's appearance and increase its value. ↑
- Both interior wall repair — Repairing the interior walls would improve the home's appearance and increase its value. ↑
- Both HVAC system replacement — Replacing the HVAC system would improve the home's comfort and increase its value. ↑
- Both landscaping — Landscaping would improve the home's curb appeal and increase its value. ↑
- Both fencing repair — Repairing the fencing would improve the home's appearance and increase its value. ↑
ⓘ Cost ranges are severity-bucket heuristics (US national rule-of-thumb). Get contractor quotes + a written scope before underwriting a rehab budget.
Schools (NCES district)
- District
- Monroe County
- NCES district ID
- 2104200
- Math proficiency
- 36% ▼ -23.00%
- Reading proficiency
- 48% ▼ -16.00%
- Median HH income
- $31,073
- Composite
- 34.3/100
- National rank
- #5241
- State rank
- #28 of 165 in KY
Livability — Tompkinsville
- Score
- 73/100
- State rank
- #116
- US rank
- #5249
Category grades
Schools grade is shown separately in the Schools card above.
Census & demographics
- Population (ZIP)
- 8,393
Population outlook (Monroe County) Hauer SSP2
- Today (2025)
- 10,011 people
- By 2030
- 9,596 · -4.1%
- By 2040
- 8,766 · -12.4%
- By 2050
- 7,971 · -20.4%
- By 2075
- 6,249 · -37.6%
- By 2100
- 4,466 · -55.4%
Race, ethnicity, and origin ACS 2023
- Neighborhood character
- Predominantly White (89%)
- Race & ethnicity
- White 89% Hispanic / Latino 6% Black 3% Two or more races 2%
- Hispanic origin (detail)
- Mexican 5%
- Common ancestry
- Slovak 2% Serbian 1%
- Foreign-born
- 3% · Canada, Guatemala, China
- Languages at home
- 95% English-only · Spanish 4%
Political lean MEDSL · Monroe
- 2024 margin
- Solid R (+77.3) · D 10.8% · R 88.2% · Other 1.0%
- 2008→2024 swing
- -24.3pp toward R · 2008: -53.0pp · 2024: -77.3pp
- All cycles
- 2024: R+77.3 2020: R+74.5 2016: R+73.7 2012: R+59.5 2008: R+53.0
Not yet ingested
- Civics
- —
Market trends
- HPI YoY
- ▼ -27.73%
- Current HPI
- 234.7064
- Rent YoY
- —
- Metro
- —
- State GDP YoY
- ▲ 1.81%
- F500 in state
- 4
Industry mix (Fortune 500 HQ in KY)
| Industry | F500 HQs | Revenue |
|---|---|---|
| Healthcare | 1 | $118B |
|
||
| Food / Beverage | 1 | $7B |
|
||
Price history
1 event — show timeline
- 2026-03-18 Listed $65,000 SCKMLSKY
Cash-flow waterfall
monthlySold comps — $/sqft
last 12 mo · ≤1 miLoading sold comps…