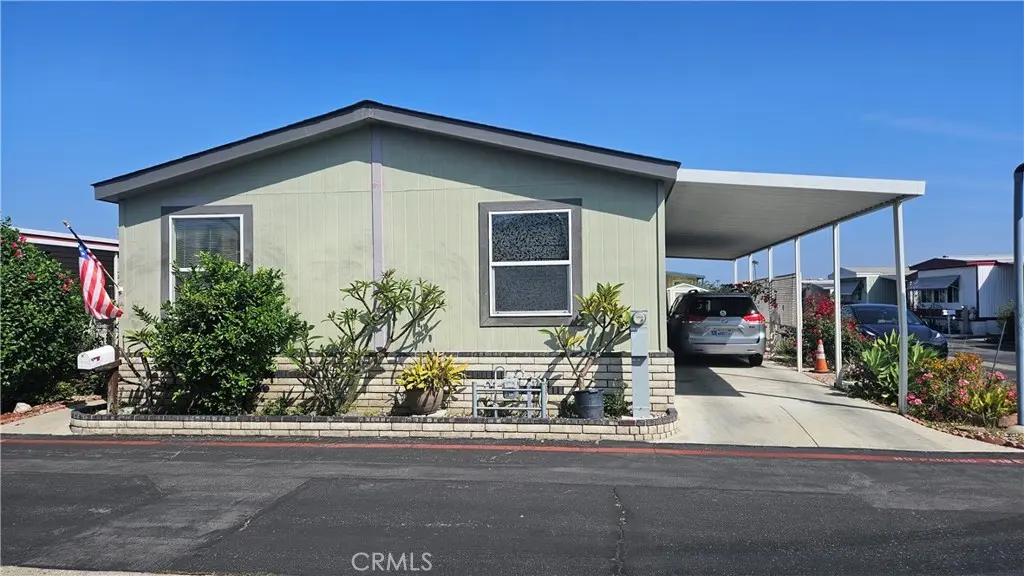
14362 Bushard St #17 · Westminster, CA
Flood risk 1/10 · Minimal
- FEMA flood zone
- X (shaded)
- Chance of flooding over 30 yrs
- 0.0%
- Est. flood insurance / yr
- $507 – $1,088
Fire risk 1/10 · Minimal
- Est. fire insurance / yr
- $659 – $1,223
Heat risk 5/10 · Moderate
- Hot days now (above 88°F)
- 7 days/yr
- Hot days in 30 yrs
- 22 days/yr
Wind risk 1/10 · Minimal
- Chance of severe wind over 30 yrs
- —
Air-quality risk 5/10 · Moderate
- Unhealthy air days now
- 7 days/yr
- Unhealthy air days in 30 yrs
- 8 days/yr
Risk factors via First Street. Map © Google.
Why this score? — see what drove the B- grade
The composite is a weighted blend of 9 inputs, each scored 0–100. Each bar is that input's sub-score; the figure is the points it added to the 100-point composite (weight × sub-score).
- Cash flow +30.0/30.0
- DSCR +10.0/10.0
- 1% rule +8.4/10.0
- Appreciation +5.0/10.0
- Schools +4.5/10.0
- Livability +3.1/5.0
- Rent growth +2.5/5.0
- Condition / age +2.5/5.0
- ARV discount +0.0/15.0
$295,000
🖨 Deal sheet 📄 Offer letter ✓ Due diligence
Listing remarks MLS
* Move-in Ready 2011 Champion home. * Spacious 1608 sqft, 3 bedrooms and 2 baths home * In +55/18 Community!!! * * Central heater & window AC * flooring * Dual pane windows * Master bedroom suite with walk-in closet * Samsung washer/dry, SS refrigerator, 2 large TV's, all furniture are included * Corner lot with beautiful landscaping and brick planter * 2 sheds * Long driveway with 3-car parking spaces * Additional guest parking spaces are close by * Space rent $1,725 per month
Key facts
- Move-in ready
- Walk-in closet
- Central heater
Tags
Neighborhood map
What this means for you Summary
Snapshot
- This is a 3-bed/2.0-bath manufactured listed at $295k.
Deal economics
- At list price, monthly cash flow is $1k ($17k/yr) — positive.
- The deal already cash-flows at list — no discount required.
- Meets the 1% rule at list price ($4k rent vs $295k).
- Recommended offer: $277k (6.0% below list) — sets the bar for market timing.
- Cap rate 11.9% vs local median 2.0% in Westminster — top-decile yield for the area; either an underpriced asset or a hidden risk that comps aren't pricing in. Stress-test before assuming the spread holds.
Location & tenants
- Location reads 62/100 on livability (#509 in CA) — a middle-class / working-renter tenant base. Strengths: commute A+; Watch: crime D-, amenities F, cost of living F.
- Garden Grove Unified (suburban): math 38% / reading 65% proficiency, ranked #132 of 517 in CA (top 26%) — acceptable for families but not a draw, mixed tenant base, ~2y average lease; 60% free/reduced lunch — lower-income household profile, screen leases tightly.
- Market conditions: 2 active listings in the ZIP; 13 comparable units currently listed for rent nearby; rentals leasing fast (median 13d on market — plan ~1-2 weeks tenant-placement turnaround); 6,974 units permitted in Orange County in 2024 (3,839 in 5+ unit buildings).
Forward outlook
- In year one you build about $11k of equity ($2k loan paydown + $9k appreciation (3.0% local appreciation)).
- Orange County population projected at +14% by 2050 — modest demand growth; plan on rents tracking national, not racing it.
- At projected returns (3.0% appreciation + 3.0% rent growth), your $83k cash investment doubles in ~3 years — after that, you're playing with house money.
- By year 4, paydown + projected appreciation supports a ~$37k cash-out refi (75% LTV) — recoverable capital for the next deal without selling this one.
Negotiation context
- It's been on market 85 days — a 6% lower offer ($277k) is reasonable based on typical stale-listing flexibility.
- 3 sale attempts with the ask held roughly flat each time — persistent listings suggest the price (not the market) is what's stuck; bring a comps-based counter.
Risks & watch-outs
- Climate carrying-cost: extreme-heat days projected 7→22/yr by 2055 (HVAC capex compounding) — expect insurance premiums to compound above CPI over the hold.
Questions for the listing agent
- It's been on market 85 days. Have you received any prior offers? Is the seller open to a 6% concession, seller financing, or rate buy-down credit?
- Why hasn't it sold? Are there any deal-killer items the seller is aware of (foundation, flood, title, zoning, code violations)?
- Is there a deadline driving the sale (1031 exchange, divorce, estate, relocation)? That informs how much negotiation room exists.
- Crime grade is D in this area — have there been break-ins, vandalism, or insurance claims at this property in the last 3 years? What carrier currently insures it and at what premium?
- What's the average days-on-market for RENTAL listings here right now (not sales)? A rising rental-DOM trend means longer vacancies and softer asking-rent achievability than the comps imply.
- What's the recent tenant-quality profile in this submarket — average credit score on applications, eviction rate, late-payment / NSF rate, and stable-employment percentage? A property-management company in the area should have these aggregated.
- How much new for-sale + rental construction is in the pipeline within 1–3 miles? Heavy new supply typically softens prices + rents 12–24 months out; constrained supply supports both.
Investment metrics
- 1% rule
- 1.34% ✓
- Cap rate
- 11.94%
- Cash-on-cash
- 20.16%
- DSCR
- 1.90
- GRM
- 6.2
CMA / ARV
- ARV (median comp)
- $215,559
- List price
- $295,000
- Delta
- 36.85%
- Verdict
- OVERPRICED
- Comps
- 20 within 1.0 mi
Show comp detail 12 sales within ~0.75 mi
| Address | Dist | Beds/Ba | Sqft | Sold | Price | $/sf | Match |
|---|---|---|---|---|---|---|---|
| 14362 Bushard St #113 | 0.00mi | 3/2.0 | 1,649 (+2%) | 20mo | $270,000 | $164 | 79 |
| 14362-142 Bushard | 0.00mi | 2/2.0 (-1) | 1,545 (-4%) | 15mo | $219,000 | $142 | 76 |
| 14362 Bushard St #96 | 0.00mi | 3/2.0 | 1,450 (-10%) | 15mo | $190,000 | $131 | 71 |
| 9200 Westminster Blvd #71 | 0.58mi | 2/2.0 (-1) | 1,704 (+6%) | 1mo | $98,000 | $58 | 57 |
| 9800 BOLSA #48 | 0.67mi | 2/2.0 (-1) | 1,536 (-4%) | 5mo | $142,500 | $93 | 52 |
| 9851 Bolsa Ave #196 | 0.54mi | 3/2.0 | 1,420 (-12%) | 5mo | $400,000 | $282 | 51 |
| 9851 Bolsa Ave #198 | 0.54mi | 3/3.0 | 1,458 (-9%) | 6mo | $380,000 | $261 | 50 |
| 9851 Bolsa #168 | 0.54mi | 3/2.0 | 1,440 (-10%) | 11mo | $339,000 | $235 | 48 |
| 9200 Westminster Blvd #38 | 0.58mi | 3/2.0 | 1,440 (-10%) | 9mo | $163,000 | $113 | 48 |
| 9800 BOLSA Ave #14 | 0.67mi | 2/2.0 (-1) | 1,440 (-10%) | 5mo | $158,000 | $110 | 42 |
| 9800 Bolsa #79 | 0.67mi | 2/2.0 (-1) | 1,440 (-10%) | 5mo | $207,000 | $144 | 42 |
| 9800 Bolsa Ave #75 | 0.67mi | 2/2.0 (-1) | 1,440 (-10%) | 18mo | $150,900 | $105 | 31 |
Match score weights: distance 35% · size 25% · config 20% · recency 20%. Top-matched comps best support the ARV.
Projected returns pro-forma
3.0% appreciation · 3.0% rent growth · sell at horizon
- IRR
- 26.4%
- Equity multiple
- 2.50×
- Total profit
- $123,803
- Equity at exit
- $132,645
- IRR
- 27.1%
- Equity multiple
- 4.83×
- Total profit
- $316,704
- Equity at exit
- $204,421
Cash invested: $82,600 (down + closing). Projections, not guarantees.
Landlord ↔ Tenant lean methodology
- Overall (STATE)
- 18 Strongly Tenant-Friendly
- State California
- 18 Strongly Tenant-Friendly · D+13
- County
- — inherits STATE
- City
- — inherits STATE
ZIP-level market 92863
- Active inventory
- 2
- Price-to-rent
- 6.2×
Monthly cashflow live
- Estimated rent
- $3,942 high interval (Pro) →
- Mortgage (P&I)
- −$1,547
- Tax from tax record
- −$56 /mo · $673/yr
- Insurance
- −$123
- HOA
- −$0
- Vacancy / Maint / Mgmt
- −$828
- Net cashflow
- $1,388
Break-even live
UW: 25.0% down · 7.5% · 30yr · 1.5% tax · 5.0% vac · 8.0% maint · 8.0% mgmt
Financing live
Cash to close
- Down payment
- $73,750
- Closing costs
- $8,850
- Reserves months
- —
- Total cash needed
- —
Loan-product check · same deal, 3 products live
Conventional
25% down · 7.5% · 30yr
- Down + closing
- —
- Monthly P&I
- —
- Monthly cashflow
- —
- DSCR
- —
- Eligible?
- —
Personal DTI + credit; lowest rate.
DSCR
20% down · 8.5% · 30yr
- Down + closing
- —
- Monthly P&I
- —
- Monthly cashflow
- —
- DSCR
- —
- Eligible?
- —
No personal income docs; deal must DSCR.
Hard money
10% down · 12.0% · 12mo
- Down + closing
- —
- Monthly P&I
- —
- Monthly cashflow
- —
- DSCR
- —
- Eligible?
- —
Short-term bridge; refi at stabilization.
Rent comps 13 comps
| Address | Beds | Baths | Sqft | Rent | $/sqft | DOM | Units | Dist |
|---|---|---|---|---|---|---|---|---|
| 9869 Bria Ln Garden Grove, CA | 2.0 | 2.5 | 1780 | $3,995 | $2.24 | 2d | 1 | 0.30mi |
| 15100 Brookhurst St Unit 327 Westminster, CA | 2.0 | 2.0 | 1254 | $4,490 | $3.58 | 12d | 1 | 0.79mi |
| 15100 Moran St Westminster, CA | 1.0–2.0 | 1.0–2.0 | 1204 | $3,847 | $3.19 | 2d | 8 | 0.80mi |
| 15100 Brookhurst St Westminster, CA | 2.0 | 2.0 | 1254 | $4,828 | $3.85 | 12d | 1 | 0.85mi |
| 10500 Westminster Ave Garden Grove, CA | 1.0–3.0 | 1.0–2.0 | 1001 | $3,100 | $3.10 | 15d | 5 | 0.97mi |
| 10402 Bowen Cir Garden Grove, CA | 3.0 | 2.0 | 1219 | $3,900 | $3.20 | 44d | 1 | 0.99mi |
| 8842 Enloe Ave Garden Grove, CA | 3.0 | 2.0 | 1300 | $3,950 | $3.04 | 1d | 1 | 1.02mi |
| 9551 Robin Ave Westminster, CA | 3.0 | 2.0 | 1302 | $4,000 | $3.07 | 44d | 1 | 1.06mi |
| 13392 Magnolia St Unit 13392-C Garden Grove, CA | 2.0 | 2.0 | 1129 | $2,595 | $2.30 | 22d | 1 | 1.13mi |
| 9155 Central Ave Garden Grove, CA | 1.0–3.0 | 1.0–2.0 | 1139 | $3,877 | $3.40 | 2d | 6 | 1.26mi |
| 8431 Aspenwood Ave Westminster, CA | 4.0 | 2.5 | 1991 | $4,700 | $2.36 | 1d | 1 | 1.46mi |
| 9900 Acacia Ave Garden Grove, CA | 1.0–2.0 | 1.0–1.5 | 939 | $2,965 | $3.16 | 4d | 5 | 1.47mi |
| 10206 Andy Reese Ct Garden Grove, CA | 3.0 | 2.5 | 1509 | $3,850 | $2.55 | 44d | 1 | 1.48mi |
Listing history 23 events
-
2026-06-18days on market $295,000 Active 85 DOM
-
2026-06-17days on market $295,000 Active 84 DOM
-
2026-06-16days on market $295,000 Active 83 DOM
-
2026-06-15days on market $295,000 Active 82 DOM
-
2026-06-13days on market $295,000 Active 80 DOM
-
2026-06-13days on market $295,000 Active 79 DOM
-
2026-06-09days on market $295,000 Active 76 DOM
-
2026-06-08days on market $295,000 Active 75 DOM
-
2026-06-07days on market $295,000 Active 74 DOM
-
2026-06-04days on market $295,000 Active 71 DOM
-
2026-06-03days on market $295,000 Active 70 DOM
-
2026-06-02days on market $295,000 Active 69 DOM
-
2026-06-01days on market $295,000 Active 68 DOM
-
2026-05-31days on market $295,000 Active 67 DOM
-
2026-05-07price $295,000 542-char remark
Show marketing remark (542 chars)
* Move-in Ready 2011 Champion home. * Spacious 1608 sqft, 3 bedrooms and 2 baths home * In +55/18 Community!!! * * Central heater & window AC * flooring * Dual pane windows * Master bedroom suite with walk-in closet * Samsung washer/dry, SS refrigerator, 2 large TV's, all furniture are included * Corner lot with beautiful landscaping and brick planter * 2 sheds * Long driveway with 3-car parking spaces * Additional guest parking spaces are close by * Space rent $1,725 per month
-
2026-03-25$305,000 Active 542-char remark
Show marketing remark (542 chars)
* Move-in Ready 2011 Champion home. * Spacious 1608 sqft, 3 bedrooms and 2 baths home * In +55/18 Community!!! * * Central heater & window AC * flooring * Dual pane windows * Master bedroom suite with walk-in closet * Samsung washer/dry, SS refrigerator, 2 large TV's, all furniture are included * Corner lot with beautiful landscaping and brick planter * 2 sheds * Long driveway with 3-car parking spaces * Additional guest parking spaces are close by * Space rent $1,725 per month
-
2026-03-24historical
-
2026-03-08price $310,000
-
2026-02-27$299,900 Active
-
2026-02-25historical
-
2026-02-22price $299,990
-
2026-02-17price $330,000
-
2026-01-08$350,000 Active
ⓘ Source: listings_history table (triggers on properties + properties_extension) + one-shot
backfill from property_details.listing_events for pre-trigger history.
Tax reassessment forecast CA · Resets to sale price
- Current annual tax
- $673 · $56/mo
- Projected year-2 tax
- $2,242 · $187/mo
- Expected delta
- +$1,569/yr (+$131/mo · 233.1%)
ⓘ Screening estimate from a state-policy table — verify with the county assessor before closing.
Climate risk First Street
- Flood 1/10 Low FEMA zone X (shaded) · 0% chance over 30 yrs
- Wildfire 1/10 Low
- Heat 5/10 Major 7 d/yr ≥88°F today · 22 d/yr by 30 yrs out
- Wind 1/10 Low
- Air quality 5/10 Major 7 unhealthy d/yr today · 8 by 30 yrs out
Nearby sold comps map
Loading sold comps map…
Walkable amenities ~0.75 mi
Loading nearby amenities…
Taxation est. · year 1
- Rental income
- $47,301
- − Mortgage interest
- −$16,525
- − Property taxes
- −$673
- − Insurance
- −$1,475
- − Repairs & maintenance
- −$3,784
- − Management
- −$3,784
- − Depreciation
- −$8,582
- Taxable income
- $12,478
- Est. tax owed @ 24.0%
- −$2,995
- After-tax cash flow
- $13,661/yr
For passive investors: Depreciation is non-cash, so a rental often shows a tax loss while cash-flowing — sheltering income. Rental losses are passive: they offset passive income freely, and up to $25,000/yr can offset ordinary (W-2) income if you actively participate and your MAGI is under $100k (phasing out to $0 by $150k); unused losses carry forward. On sale, claimed depreciation is recaptured at up to 25%, and gains may owe capital-gains tax (a 1031 exchange can defer both). Figures are a year-1 estimate at your 24.0% rate — not tax advice; consult a CPA.
Schools (NCES district)
- District
- Garden Grove Unified
- NCES district ID
- 0614880
- Math proficiency
- 38% ▼ -14.00%
- Reading proficiency
- 65% ▲ 4.00%
- Median HH income
- $60,089
- Composite
- 44.89/100
- National rank
- #2715
- State rank
- #132 of 517 in CA
Livability — Westminster
- Score
- 62/100
- State rank
- #509
- US rank
- #17242
Category grades
Schools grade is shown separately in the Schools card above.
Census & demographics
- Census place
- Westminster, CA
Population outlook (Orange County) Hauer SSP2
- Today (2025)
- 3,477,456 people
- By 2030
- 3,613,117 · +3.9%
- By 2040
- 3,835,945 · +10.3%
- By 2050
- 3,968,736 · +14.1%
- By 2075
- 4,097,053 · +17.8%
- By 2100
- 3,903,633 · +12.3%
Not yet ingested
- Political lean
- —
- Race & ethnicity
- —
- Common origin
- —
- Civics
- —
Market trends
- HPI YoY
- —
- Current HPI
- —
- Rent YoY
- —
- Metro
- —
- State GDP YoY
- ▲ 3.21%
- F500 in state
- 116
Industry mix (Fortune 500 HQ in CA)
| Industry | F500 HQs | Revenue |
|---|---|---|
| Technology | 27 | $1,492B |
|
||
| Financial Services | 3 | $174B |
|
||
| Retail | 3 | $44B |
|
||
| Insurance | 3 | $26B |
|
||
| Media / Entertainment | 2 | $115B |
|
||
| Pharmaceuticals / Biotech | 2 | $62B |
|
||
Price history
-15.7% since first listed9 events — show timeline
- 2026-05-07 Price Changed $295,000 CRMLS
- 2026-03-25 Listed $305,000 CRMLS
- 2026-03-24 Listing Removed — CRMLS
- 2026-03-08 Price Changed $310,000 CRMLS
- 2026-02-27 Listed $299,900 CRMLS
- 2026-02-25 Listing Removed — CRMLS
- 2026-02-22 Price Changed $299,990 CRMLS
- 2026-02-17 Price Changed $330,000 CRMLS
- 2026-01-08 Listed $350,000 CRMLS
Property tax history
-4.1%/yrLatest (2025): $673 · -10.3% YoY. Source: county tax records.
Cash-flow waterfall
monthlySold comps — $/sqft
last 12 mo · ≤1 miLoading sold comps…