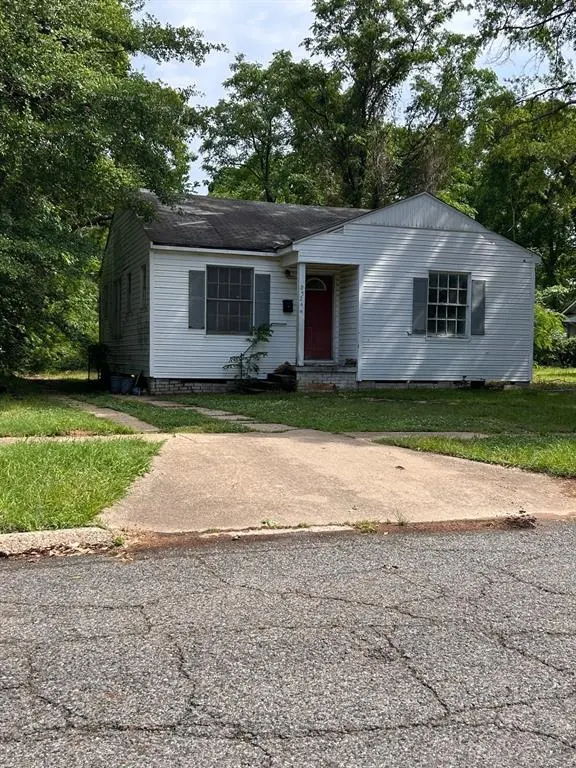
2524 Merwin St · Shreveport, LA
Flood risk 1/10 · Minimal
- FEMA flood zone
- X (unshaded)
- Chance of flooding over 30 yrs
- 0.0%
- Est. flood insurance / yr
- $507 – $1,088
Fire risk 1/10 · Minimal
- Est. fire insurance / yr
- $1,269 – $2,357
Heat risk 7/10 · Major
- Hot days now (above 110°F)
- 7 days/yr
- Hot days in 30 yrs
- 21 days/yr
Wind risk 6/10 · Moderate
- Chance of severe wind over 30 yrs
- 64.0%
Air-quality risk 2/10 · Minimal
- Unhealthy air days now
- 1 days/yr
- Unhealthy air days in 30 yrs
- 1 days/yr
Risk factors via First Street. Map © Google.
Why this score? — see what drove the B- grade
The composite is a weighted blend of 9 inputs, each scored 0–100. Each bar is that input's sub-score; the figure is the points it added to the 100-point composite (weight × sub-score).
- Cash flow +30.0/30.0
- 1% rule +10.0/10.0
- DSCR +10.0/10.0
- Appreciation +4.9/10.0
- Livability +3.0/5.0
- Rent growth +2.5/5.0
- Condition / age +2.5/5.0
- Schools +2.2/10.0
- ARV discount +0.5/15.0
$42,000
🖨 Deal sheet (PDF) 📄 Offer letter ✓ Due diligence
Listing remarks MLS
Currently tenant occupied. PLEASE DO NOT DISTURB THE TENANT without showing request. Investment Package Available with other homes! Please contact for additional details. See Private Notes.
Key facts
- 6,752 sq ft lot
- Built 1960
- Listed 239 days
Neighborhood map
What this means for you Summary
Snapshot
- This is a 2-bed/1.0-bath single-family listed at $42k.
Deal economics
- At list price, monthly cash flow is $291 ($3k/yr) — positive.
- The deal already cash-flows at list — no discount required.
- Meets the 1% rule at list price ($731 rent vs $42k).
- Recommended offer: $37k (12.0% below list) — sets the bar for market timing.
- Cap rate 14.6% vs local median 5.6% in Shreveport — top-decile yield for the area; either an underpriced asset or a hidden risk that comps aren't pricing in. Stress-test before assuming the spread holds.
Location & tenants
- Location reads 59/100 on livability (#270 in LA) — a working-class tenant base; expect higher turnover. Strengths: cost of living A+, housing A; Watch: crime F, amenities F, commute F.
- Caddo Parish (urban): math 21% / reading 32% proficiency, ranked #53 of 98 in LA (top 54%) — low school quality limits family demand, transient renter base, plan for 1-2y turnover; 64% free/reduced lunch — lower-income household profile, screen leases tightly.
- Zoned schools: Caddo Heights Math/Science Elementary School (math 12% / reading 12%, grade F, #568 of 646 statewide, top 89%, 383 students, 86% FRL); Caddo Parish Middle Magnet School (math 79% / reading 93%, grade A+, #1 of 218 statewide, top 0%, 1,003 students, 23% FRL).
- Zoned-school proficiency averages 49% at this address vs 26% district-wide (+22 pts) — the actual schools serving this property are materially stronger than the Caddo Parish average implies; a family-tenant draw the district grade alone would hide.
- Market conditions: 70 active listings in the ZIP; 26 comparable units currently listed for rent nearby; rentals at typical pace (median 23d on market — plan ~3-4 weeks tenant-placement turnaround); 221 units permitted in Caddo Parish in 2024 (0 in 5+ unit buildings).
Forward outlook
- In year one you build about $220 of equity ($290 loan paydown + $-70 appreciation (-0.2% local appreciation)).
- Caddo County population projected at -15% by 2050 — secular population decline; favor cash flow + early exit over multi-decade hold.
- At projected returns (-0.2% appreciation + 3.0% rent growth), your $12k cash investment doubles in ~3 years — after that, you're playing with house money.
Negotiation context
- It's been on market 239 days — a 12% lower offer ($37k) is reasonable based on typical stale-listing flexibility.
- 3 sale attempts with the ask held roughly flat each time — persistent listings suggest the price (not the market) is what's stuck; bring a comps-based counter.
Risks & watch-outs
- Climate carrying-cost: major wind risk, 64% chance of damaging wind over 30y; extreme-heat days projected 7→21/yr by 2055 (HVAC capex compounding) — expect insurance premiums to compound above CPI over the hold.
Questions for the listing agent
- It's been on market 239 days. Have you received any prior offers? Is the seller open to a 12% concession, seller financing, or rate buy-down credit?
- Built in 1960 — when were the roof, HVAC, electrical panel, plumbing, and water heater last replaced?
- Why hasn't it sold? Are there any deal-killer items the seller is aware of (foundation, flood, title, zoning, code violations)?
- Is there a deadline driving the sale (1031 exchange, divorce, estate, relocation)? That informs how much negotiation room exists.
- Schools are D-rated, which usually means shorter tenancies and higher turnover. Who's the typical renter profile here, and what's been the actual vacancy rate?
- Crime grade is F in this area — have there been break-ins, vandalism, or insurance claims at this property in the last 3 years? What carrier currently insures it and at what premium?
- What's the average days-on-market for RENTAL listings here right now (not sales)? A rising rental-DOM trend means longer vacancies and softer asking-rent achievability than the comps imply.
- What's the recent tenant-quality profile in this submarket — average credit score on applications, eviction rate, late-payment / NSF rate, and stable-employment percentage? A property-management company in the area should have these aggregated.
- How much new for-sale + rental construction is in the pipeline within 1–3 miles? Heavy new supply typically softens prices + rents 12–24 months out; constrained supply supports both.
Investment metrics
- 1% rule
- 1.74% ✓
- Cap rate
- 14.61%
- Cash-on-cash
- 29.69%
- DSCR
- 2.32
- GRM
- 4.8
CMA / ARV
- ARV (median comp)
- $36,335
- List price
- $42,000
- Delta
- 15.59%
- Verdict
- OVERPRICED
- Comps
- 20 within 1.0 mi
Show comp detail 12 sales within ~0.75 mi
| Address | Dist | Beds/Ba | Sqft | Sold | Price | $/sf | Match |
|---|---|---|---|---|---|---|---|
| 2560 Emery St | 0.08mi | 2/1.0 | 977 (-1%) | 12mo | $45,000 | $46 | 85 |
| 3726 Portland Ave | 0.09mi | 2/1.0 | 1,105 (+12%) | 2mo | $50,500 | $46 | 74 |
| 2446 Drexel St | 0.57mi | 2/1.0 | 979 (-0%) | 4mo | $15,000 | $15 | 69 |
| 2632 Desoto St | 0.34mi | 2/1.0 | 1,069 (+9%) | 10mo | $32,500 | $30 | 62 |
| 2511 Drexel St | 0.59mi | 2/1.0 | 1,005 (+2%) | 9mo | $45,000 | $45 | 61 |
| 2908 Hardy St | 0.66mi | 2/1.0 | 990 (+1%) | 12mo | $42,998 | $43 | 58 |
| 2540 Woodford St | 0.62mi | 2/1.0 | 971 (-1%) | 17mo | $44,000 | $45 | 55 |
| 3934 Fairfax Ave | 0.70mi | 3/1.0 (+1) | 1,036 (+5%) | 2mo | $84,000 | $81 | 52 |
| 2449 Midway St | 0.48mi | 2/2.0 | 1,103 (+12%) | 4mo | $35,000 | $32 | 50 |
| 2810 Milton St | 0.69mi | 2/1.0 | 869 (-12%) | 3mo | $24,900 | $29 | 46 |
| 2647 Drexel St | 0.62mi | 3/2.0 (+1) | 1,079 (+10%) | 2mo | $67,500 | $63 | 44 |
| 1747 Fulton St | 0.71mi | 3/2.0 (+1) | 1,072 (+9%) | 10mo | $63,000 | $59 | 35 |
Match score weights: distance 35% · size 25% · config 20% · recency 20%. Top-matched comps best support the ARV.
Projected returns pro-forma
-0.17% appreciation · 3.0% rent growth · sell at horizon
- IRR
- 29.9%
- Equity multiple
- 2.44×
- Total profit
- $16,984
- Equity at exit
- $11,849
- IRR
- 33.7%
- Equity multiple
- 4.73×
- Total profit
- $43,831
- Equity at exit
- $13,970
Cash invested: $11,760 (down + closing). Projections, not guarantees.
Landlord ↔ Tenant lean methodology
- Overall (STATE)
- 90 Strongly Landlord-Friendly
- State Louisiana
- 90 Strongly Landlord-Friendly · R+12
- County
- — inherits STATE
- City
- — inherits STATE
ZIP-level market 71103
- Home prices YoY
- -0.6%
- Active inventory
- 70
- Price-to-rent
- 4.8×
Monthly cashflow live
- Estimated rent
- $731 high interval (Pro) →
- Mortgage (P&I)
- −$220
- Tax from tax record
- −$49 /mo · $590/yr
- Insurance
- −$18
- HOA
- −$0
- Vacancy / Maint / Mgmt
- −$154
- Net cashflow
- $291
Break-even live
Sensitivity live
| Price | -10% $315 | -5% $303 | +0% $291 | +5% $279 | +10% $267 |
|---|---|---|---|---|---|
| Rent | -10% $233 | -5% $262 | +0% $291 | +5% $320 | +10% $349 |
| Rate | -1.0pp $312 | -0.5pp $302 | base $291 | +0.5pp $280 | +1.0pp $269 |
UW: 25.0% down · 7.5% · 30yr · 1.5% tax · 5.0% vac · 8.0% maint · 8.0% mgmt
Financing live
Cash to close
- Down payment
- $10,500
- Closing costs
- $1,260
- Reserves months
- —
- Total cash needed
- —
Loan-product check · same deal, 3 products live
Conventional
25% down · 7.5% · 30yr
- Down + closing
- —
- Monthly P&I
- —
- Monthly cashflow
- —
- DSCR
- —
- Eligible?
- —
Personal DTI + credit; lowest rate.
DSCR
20% down · 8.5% · 30yr
- Down + closing
- —
- Monthly P&I
- —
- Monthly cashflow
- —
- DSCR
- —
- Eligible?
- —
No personal income docs; deal must DSCR.
Hard money
10% down · 12.0% · 12mo
- Down + closing
- —
- Monthly P&I
- —
- Monthly cashflow
- —
- DSCR
- —
- Eligible?
- —
Short-term bridge; refi at stabilization.
Rent comps 26 comps
| Address | Beds | Baths | Sqft | Rent | $/sqft | DOM | Units | Dist |
|---|---|---|---|---|---|---|---|---|
| 2520 Merwin St Shreveport, LA | 3.0 | 1.0 | 924 | $700 | $0.76 | 22d | 1 | 0.04mi |
| 2544 DuPont St Shreveport, LA | 2.0 | 1.0 | 683 | $600 | $0.88 | 22d | 1 | 0.22mi |
| 2714 DuPont St Shreveport, LA | 2.0 | 1.0 | 980 | $565 | $0.58 | 15d | 1 | 0.30mi |
| 2924 DuPont St Shreveport, LA | 2.0 | 1.0 | 768 | $750 | $0.98 | 22d | 1 | 0.42mi |
| 2503 Malcolm St Shreveport, LA | 1.0 | 1.0 | 650 | $600 | $0.92 | 45d | 1 | 0.81mi |
| 3240 Jackson St Shreveport, LA | 2.0 | 1.0 | 1014 | $700 | $0.69 | 15d | 1 | 0.83mi |
| 4122 Cherokee St Apt 4 Shreveport, LA | 2.0 | 1.0 | 960 | $850 | $0.89 | 45d | 1 | 0.90mi |
| 4122 Cherokee St Apt 4 Shreveport, LA | 2.0 | 1.0 | 750 | $850 | $1.13 | 22d | 1 | 0.90mi |
| 5218 Fairfax Ave Shreveport, LA | 2.0 | 1.0 | 971 | $825 | $0.85 | 22d | 1 | 1.09mi |
| 3022 Lillian St Shreveport, LA | 2.0 | 1.0 | 1115 | $695 | $0.62 | 22d | 1 | 1.11mi |
| 1353 Glen Oak Pl Shreveport, LA | 2.0 | 1.0 | 1116 | $800 | $0.72 | 15d | 1 | 1.14mi |
| 1353 Glen Oak Pl Shreveport, LA | 2.0 | 1.0 | 1116 | $850 | $0.76 | 22d | 1 | 1.14mi |
| 3628 Sumner St Shreveport, LA | 3.0 | 1.0 | 956 | $950 | $0.99 | 46d | 1 | 1.16mi |
| 5306 Prentiss Ave Shreveport, LA | 3.0 | 1.0 | 957 | $975 | $1.02 | 45d | 1 | 1.17mi |
| 1954 State St Shreveport, LA | 3.0 | 1.0 | 900 | $900 | $1.00 | 45d | 1 | 1.20mi |
| 3515 Stonewall St Shreveport, LA | 2.0 | 1.0 | 1000 | $600 | $0.60 | 15d | 1 | 1.23mi |
| 2042 Laurel St Shreveport, LA | 3.0 | 1.0 | 1100 | $800 | $0.73 | 45d | 1 | 1.25mi |
| 1430 Grigsby St Shreveport, LA | 3.0 | 1.0 | 1052 | $775 | $0.74 | 45d | 1 | 1.28mi |
| 1316 Wilkinson St Shreveport, LA | 1.0 | 1.0 | 1000 | $600 | $0.60 | 45d | 1 | 1.28mi |
| 1340 Lincoln St Shreveport, LA | 2.0 | 1.0 | 1120 | $850 | $0.76 | 15d | 1 | 1.29mi |
| 1340 Lincoln St Shreveport, LA | 2.0 | 1.0 | 1120 | $950 | $0.85 | 45d | 1 | 1.29mi |
| 2641 Valley Ridge Rd Shreveport, LA | 3.0 | 1.0 | 1045 | $725 | $0.69 | 22d | 1 | 1.31mi |
| 3553 W College St Shreveport, LA | 1.0 | 1.0 | 600 | $600 | $1.00 | 22d | 1 | 1.36mi |
| 1421 Clover St Shreveport, LA | 2.0 | 1.0 | 900 | $675 | $0.75 | 15d | 1 | 1.38mi |
| 3902 Sumner St Shreveport, LA | 2.0 | 1.0 | 900 | $700 | $0.78 | 45d | 1 | 1.44mi |
| 3100 Fairfield Ave Shreveport, LA | 1.0–2.0 | 1.5–2.0 | 1001 | $1,400 | $1.40 | 22d | 1 | 1.50mi |
Listing history 25 events
-
2026-06-21days on market $42,000 Active 239 DOM
-
2026-06-18days on market $42,000 Active 236 DOM
-
2026-06-17days on market $42,000 Active 235 DOM
-
2026-06-16days on market $42,000 Active 234 DOM
-
2026-06-15days on market $42,000 Active 233 DOM
-
2026-06-14days on market $42,000 Active 231 DOM
-
2026-06-13days on market $42,000 Active 230 DOM
-
2026-06-10days on market $42,000 Active 228 DOM
-
2026-06-09days on market $42,000 Active 227 DOM
-
2026-06-08days on market $42,000 Active 226 DOM
-
2026-06-07days on market $42,000 Active 225 DOM
-
2026-06-05days on market $42,000 Active 222 DOM
-
2026-06-03days on market $42,000 Active 221 DOM
-
2026-06-02days on market $42,000 Active 220 DOM
-
2026-06-01days on market $42,000 Active 219 DOM
-
2026-05-31days on market $42,000 Active 218 DOM
-
2026-05-30days on market $42,000 Active 217 DOM
-
2026-03-16status Active 190-char remark
Show marketing remark (190 chars)
Currently tenant occupied. PLEASE DO NOT DISTURB THE TENANT without showing request. Investment Package Available with other homes! Please contact for additional details. See Private Notes.
-
2026-02-16historical Active Contingent 190-char remark
Show marketing remark (190 chars)
Currently tenant occupied. PLEASE DO NOT DISTURB THE TENANT without showing request. Investment Package Available with other homes! Please contact for additional details. See Private Notes.
-
2025-10-25$42,000 Active 190-char remark
Show marketing remark (190 chars)
Currently tenant occupied. PLEASE DO NOT DISTURB THE TENANT without showing request. Investment Package Available with other homes! Please contact for additional details. See Private Notes.
-
2025-07-21historical $775
-
2025-04-25$775
-
2012-02-17soldstatus $729,826
-
2010-03-01soldstatus $13,350
-
1995-03-27soldstatus
ⓘ Source: listings_history table (triggers on properties + properties_extension) + one-shot
backfill from property_details.listing_events for pre-trigger history.
Tax reassessment forecast LA · Resets to sale price
- Current annual tax
- $590 · $49/mo
- Projected year-2 tax
- $590 · $49/mo
- Expected delta
- $0/yr ($0/mo · 0.0%)
ⓘ Screening estimate from a state-policy table — verify with the county assessor before closing.
Climate risk First Street
- Flood 1/10 Low FEMA zone X (unshaded) · 0% chance over 30 yrs
- Wildfire 1/10 Low
- Heat 7/10 Severe 7 d/yr ≥110°F today · 21 d/yr by 30 yrs out
- Wind 6/10 Major 64% chance of damaging wind over 30 yrs
- Air quality 2/10 Low 1 unhealthy d/yr today · 1 by 30 yrs out
Nearby sold comps map
Loading sold comps map…
Walkable amenities ~0.75 mi
Loading nearby amenities…
Taxation est. · year 1
- Rental income
- $8,777
- − Mortgage interest
- −$2,353
- − Property taxes
- −$590
- − Insurance
- −$210
- − Repairs & maintenance
- −$702
- − Management
- −$702
- − Depreciation
- −$1,222
- Taxable income
- $2,999
- Est. tax owed @ 24.0%
- −$720
- After-tax cash flow
- $2,771/yr
For passive investors: Depreciation is non-cash, so a rental often shows a tax loss while cash-flowing — sheltering income. Rental losses are passive: they offset passive income freely, and up to $25,000/yr can offset ordinary (W-2) income if you actively participate and your MAGI is under $100k (phasing out to $0 by $150k); unused losses carry forward. On sale, claimed depreciation is recaptured at up to 25%, and gains may owe capital-gains tax (a 1031 exchange can defer both). Figures are a year-1 estimate at your 24.0% rate — not tax advice; consult a CPA.
Schools (NCES district)
- District
- Caddo Parish
- NCES district ID
- 2200300
- Math proficiency
- 21% ▼ -33.00%
- Reading proficiency
- 32% ▼ -30.00%
- Median HH income
- $39,227
- Composite
- 22.23/100
- National rank
- #8148
- State rank
- #53 of 98 in LA
Livability — Shreveport
- Score
- 59/100
- State rank
- #270
- US rank
- #19730
Category grades
Schools grade is shown separately in the Schools card above.
Census & demographics
- Census place
- Shreveport, LA
- City population
- 164,123
- Population (ZIP)
- 6,142
Population outlook (Caddo County) Hauer SSP2
- Today (2025)
- 243,190 people
- By 2030
- 237,231 · -2.5%
- By 2040
- 222,502 · -8.5%
- By 2050
- 206,516 · -15.1%
- By 2075
- 165,706 · -31.9%
- By 2100
- 122,262 · -49.7%
Race, ethnicity, and origin ACS 2023
- Neighborhood character
- Predominantly Black (81%)
- Race & ethnicity
- Black 81% White 17% Hispanic / Latino 1%
- Common ancestry
- Slovak 3% Hispanic 1%
- Languages at home
- 99% English-only · Spanish 1%
Political lean MEDSL · Caddo
- 2024 margin
- Toss-up / Even · D 51.6% · R 47.0% · Other 1.4%
- 2008→2024 swing
- +1.6pp toward D · 2008: 3.0pp · 2024: 4.6pp
- All cycles
- 2024: D+4.6 2020: D+6.8 2016: D+4.2 2012: D+4.9 2008: D+3.0
Not yet ingested
- Civics
- —
Market trends
- HPI YoY
- ▼ -0.17%
- Current HPI
- 26.3904
- Rent YoY
- —
- Metro
- —
- State GDP YoY
- ▲ 3.29%
- F500 in state
- 10
Industry mix (Fortune 500 HQ in LA)
| Industry | F500 HQs | Revenue |
|---|---|---|
| Telecommunications | 2 | $23B |
|
||
| Utilities | 1 | $12B |
|
||
| Wholesale / Distribution | 1 | $5B |
|
||
| Advertising | 1 | $2B |
|
||
Price history
+214.6% since first listed8 events — show timeline
- 2026-03-16 Relisted — NTREIS
- 2026-02-16 Contingent — NTREIS
- 2025-10-25 Listed $42,000 NTREIS
- 2025-07-21 Rental Removed $775 NTREIS
- 2025-04-25 Listed for Rent $775 NTREIS
- 2012-02-17 Sold (Public Records) $729,826 Public Records
- 2010-03-01 Sold (Public Records) $13,350 Public Records
- 1995-03-27 Sold (Public Records) — Public Records
Property tax history
-0.8%/yrLatest (2025): $590 · +0.4% YoY. Source: county tax records.
Cash-flow waterfall
monthlySold comps — $/sqft
last 12 mo · ≤1 miLoading sold comps…