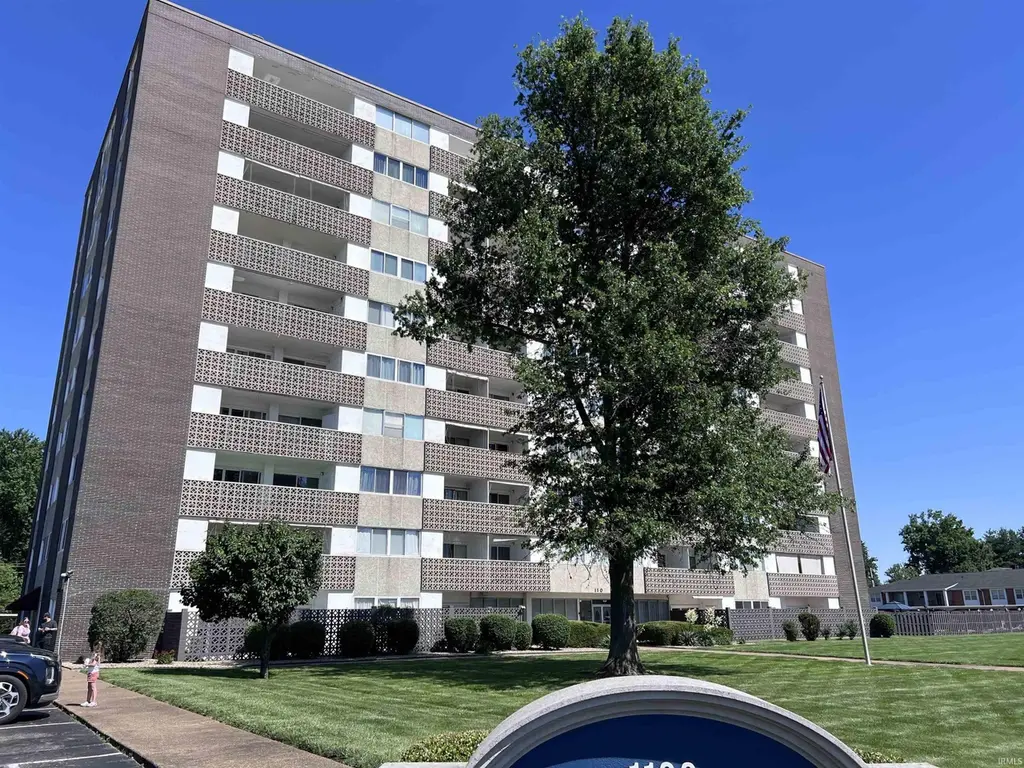
1100 Erie Ave #411 · Evansville, IN
Flood risk No data
- FEMA flood zone
- —
- Chance of flooding over 30 yrs
- —
- Est. flood insurance / yr
- —
Fire risk No data
- Est. fire insurance / yr
- —
Heat risk No data
- Hot days now (above threshold)
- —
- Hot days in 30 yrs
- —
Wind risk No data
- Chance of severe wind over 30 yrs
- —
Air-quality risk No data
- Unhealthy air days now
- —
- Unhealthy air days in 30 yrs
- —
Risk factors via First Street. Map © Google.
Why this score? — see what drove the D grade
The composite is a weighted blend of 9 inputs, each scored 0–100. Each bar is that input's sub-score; the figure is the points it added to the 100-point composite (weight × sub-score).
- Cash flow +10.0/30.0
- 1% rule +10.0/10.0
- ARV discount +7.5/15.0
- Schools +3.3/10.0
- Livability +3.2/5.0
- DSCR +2.8/10.0
- Rent growth +2.5/5.0
- Condition / age +2.5/5.0
- Appreciation +0.0/10.0
$79,900
🖨 Deal sheet 📄 Offer letter ✓ Due diligence
Listing remarks MLS
Check out this spacious 2-bedroom, 2-bath fourth floor condo overlooking the pool at Continental Towers. With seven closets, a built-in hutch above the dining area, tons of cabinetry in the kitchen, and a balcony with a large outdoor closet, you'll never run out of storage options! The home opens to the living room with two sets of sliding doors offering panoramic balcony views and a sun-drenched space to entertain. The kitchen provides plenty of room for meal prep and a space to sit and dine if you don't want to create a formal dining space. Both bedrooms have two closets, a full bath with linen closet, and over-look the pool. HOA fees include water, sewer, basic cable, lawn care, snow removal, light plumbing, and so much more. See attached document for a comprehensive list of what is covered by the HOA fees. Community amenities make this deal even sweeter with a social room with fitness equipment, a laundry room, indoor mailboxes in the lobby, a community pool, covered parking available, and so much more!
Key facts
- $527 HOA
- Pool
- Built 1965
Neighborhood map
What this means for you Summary
Snapshot
- This is a 2-bed/2.0-bath condo listed at $80k.
Deal economics
- At list price, monthly cash flow is $-49 ($-582/yr) — negative.
- To cash-flow at today's rent, offer at most $71k (10.7% below list).
- Meets the 1% rule at list price ($1k rent vs $80k).
- Recommended offer: $71k (10.7% below list) — sets the bar for cash-flow.
- Cap rate 5.6% vs local median 4.6% in Evansville — meaningfully above typical; check what's discounted (condition, days-on-market, listing class) to confirm the premium yield is real.
Location & tenants
- Location reads 63/100 on livability (#416 in IN) — a middle-class / working-renter tenant base. Strengths: cost of living A+, housing A+, health & safety A+; Watch: crime F, commute F, employment D-.
- Evansville Vanderburgh School Corporation (urban): math 36% / reading 43% proficiency, ranked #153 of 301 in IN (top 51%) — families likely to look elsewhere, expect single-tenant / working-renter base with shorter leases.
- Zoned schools: Hebron Elementary School (math 37% / reading 35%, grade F, #577 of 994 statewide, top 59%, 758 students, 56% FRL); Plaza Park International Prep Acad (math 27% / reading 37%, grade F, #190 of 330 statewide, top 59%, 650 students, 65% FRL); William Henry Harrison High School (math 29% / reading 54%, grade F, #211 of 369 statewide, top 58%, 1,158 students, 61% FRL).
- Market conditions: 177 active listings in the ZIP; 19 comparable units currently listed for rent nearby; rentals leasing fast (median 13d on market — plan ~1-2 weeks tenant-placement turnaround); 508 units permitted in Vanderburgh County in 2024 (32 in 5+ unit buildings).
Forward outlook
- Local home prices are declining (-3.0%/yr); year-one equity from $552 of loan paydown is wiped out by about $2k of value loss. Plan a longer hold.
Negotiation context
- Only 0 days on market — expect competitive offers; lowballing is unlikely to land.
- 2 sale attempts since 5y ago with the ask held roughly flat each time — persistent listings suggest the price (not the market) is what's stuck; bring a comps-based counter.
Risks & watch-outs
- Watch-outs: HOA is 43% of rent.
Questions for the listing agent
- What do current leases actually rent for vs. the listed asking? Can we see a recent rent roll and the last 12 months of T-12 income?
- Built in 1965 — when were the roof, HVAC, electrical panel, plumbing, and water heater last replaced?
- What does the HOA fee cover, when was the last increase, and are there any pending special assessments or reserve-fund shortfalls?
- Any open or pending special assessments — roof, HVAC, plumbing, elevator, façade? What's the per-unit balance and payoff schedule, and is the seller paying it off at close or rolling it to the buyer?
- Is there a deadline driving the sale (1031 exchange, divorce, estate, relocation)? That informs how much negotiation room exists.
- Schools are D-rated, which usually means shorter tenancies and higher turnover. Who's the typical renter profile here, and what's been the actual vacancy rate?
- Crime grade is F in this area — have there been break-ins, vandalism, or insurance claims at this property in the last 3 years? What carrier currently insures it and at what premium?
- The area grade is low — what's the realistic commute time and amenity access for the typical tenant pool here? Any planned neighborhood developments (good or bad) we should know about?
- What's the average days-on-market for RENTAL listings here right now (not sales)? A rising rental-DOM trend means longer vacancies and softer asking-rent achievability than the comps imply.
- What's the recent tenant-quality profile in this submarket — average credit score on applications, eviction rate, late-payment / NSF rate, and stable-employment percentage? A property-management company in the area should have these aggregated.
- How much new apartment / multifamily construction is in the pipeline within 1–3 miles? Heavy new supply (>2% of stock underway) typically softens rents 12–24 months out; light construction supports rent growth.
Investment metrics
- 1% rule
- 1.53% ✓
- Cap rate
- 5.56%
- Cash-on-cash
- -2.60%
- DSCR
- 0.88
- GRM
- 5.5
CMA / ARV
No comps found within radius.
Projected returns pro-forma
-3.0% appreciation · 3.0% rent growth · sell at horizon
- IRR
- -20.1%
- Equity multiple
- 0.30×
- Total profit
- $-15,736
- Equity at exit
- $11,913
- IRR
- -12.2%
- Equity multiple
- 0.26×
- Total profit
- $-16,459
- Equity at exit
- $6,908
Cash invested: $22,372 (down + closing). Projections, not guarantees.
Landlord ↔ Tenant lean methodology
- Overall (STATE)
- 90 Strongly Landlord-Friendly
- State Indiana
- 90 Strongly Landlord-Friendly · R+11
- County
- — inherits STATE
- City
- — inherits STATE
ZIP-level market 47715
- Active inventory
- 177
- Price-to-rent
- 5.5×
Monthly cashflow live
- Estimated rent
- $1,219 high interval (Pro) →
- Mortgage (P&I)
- −$419
- Tax from tax record
- −$32 /mo · $383/yr
- Insurance
- −$33
- HOA
- −$527
- Vacancy / Maint / Mgmt
- −$256
- Net cashflow
- $-49
Break-even live
UW: 25.0% down · 7.5% · 30yr · 1.5% tax · 5.0% vac · 8.0% maint · 8.0% mgmt
Financing live
Cash to close
- Down payment
- $19,975
- Closing costs
- $2,397
- Reserves months
- —
- Total cash needed
- —
Loan-product check · same deal, 3 products live
Conventional
25% down · 7.5% · 30yr
- Down + closing
- —
- Monthly P&I
- —
- Monthly cashflow
- —
- DSCR
- —
- Eligible?
- —
Personal DTI + credit; lowest rate.
DSCR
20% down · 8.5% · 30yr
- Down + closing
- —
- Monthly P&I
- —
- Monthly cashflow
- —
- DSCR
- —
- Eligible?
- —
No personal income docs; deal must DSCR.
Hard money
10% down · 12.0% · 12mo
- Down + closing
- —
- Monthly P&I
- —
- Monthly cashflow
- —
- DSCR
- —
- Eligible?
- —
Short-term bridge; refi at stabilization.
Rent comps 19 comps
| Address | Beds | Baths | Sqft | Rent | $/sqft | DOM | Units | Dist |
|---|---|---|---|---|---|---|---|---|
| 1100 Erie Ave Evansville, IN | 1.0–3.0 | 1.0–2.0 | 962 | $1,188 | $1.23 | 21d | 2 | 0.04mi |
| 5301 Stonehedge Dr Evansville, IN | 1.0–2.0 | 1.0–2.0 | 914 | $1,170 | $1.28 | 13d | 19 | 0.23mi |
| 815 Erie Ave Evansville, IN | 1.0–2.0 | 1.0–2.5 | 1038 | $1,349 | $1.30 | 13d | 17 | 0.33mi |
| 950 S Hebron Ave Apt 301 Evansville, IN | 2.0 | 1.0 | 1088 | $1,900 | $1.75 | 21d | 1 | 0.44mi |
| 700 Chateau Dr Evansville, IN | 2.0 | 1.0 | 825 | $695 | $0.84 | 13d | 2 | 0.54mi |
| 1165 Shiloh Sq Evansville, IN | 1.0–2.0 | 1.0–2.0 | 907 | $1,145 | $1.26 | 13d | 15 | 0.55mi |
| 4689 Covert Ave Unit 4629 Evansville, IN | 2.0 | 1.0 | 725 | $775 | $1.07 | 13d | 1 | 0.56mi |
| 1900 Pueblo Pass Evansville, IN | 2.0–3.0 | 1.5 | 1081 | $899 | $0.83 | 13d | 5 | 0.73mi |
| 1621 Burdette Ave Evansville, IN | 2.0 | 1.0 | 720 | $1,050 | $1.46 | 21d | 1 | 0.76mi |
| 3951 Bellemeade Ave Unit D Evansville, IN | 2.0 | 1.0 | 825 | $1,100 | $1.33 | 21d | 1 | 0.86mi |
| 1411 Jeanette Ave Unit 1411 Evansville, IN | 3.0 | 1.5 | 1210 | $1,195 | $0.99 | 21d | 1 | 0.88mi |
| 4982 Tippecanoe Dr Evansville, IN | 1.0–2.0 | 1.0 | 897 | $910 | $1.01 | 13d | 3 | 0.94mi |
| 1320 Lee Ct Evansville, IN | 1.0–4.0 | 1.0–1.5 | 1007 | $1,032 | $1.03 | 13d | 36 | 0.99mi |
| 3700 Justus Ct Evansville, IN | 1.0–2.0 | 1.0–2.0 | 790 | $975 | $1.23 | 21d | 1 | 0.99mi |
| 100 Williamsburg Dr Evansville, IN | 1.0–3.0 | 1.0–1.5 | 960 | $1,187 | $1.24 | 13d | 10 | 1.20mi |
| 200 Kimber Ln Evansville, IN | 1.0–3.0 | 1.0–1.5 | 1025 | $1,149 | $1.12 | 13d | 5 | 1.32mi |
| 5560 E Virginia St Evansville, IN | 1.0 | 1.0 | 773 | $899 | $1.16 | 21d | 1 | 1.39mi |
| 2947 Ravenswood Dr Unit 2927 Evansville, IN | 2.0 | 1.0 | 1150 | $975 | $0.85 | 21d | 1 | 1.44mi |
| 7501 E Powell Ave Evansville, IN | 3.0 | 1.0 | 1100 | $1,650 | $1.50 | 21d | 1 | 1.45mi |
HOA detail condo
- Monthly dues
- $527 · $6,324/yr
- Likely covers
- watersewercablelandscapingsnow removalpool
- Assessments
- None detected in remarks — confirm with the listing agent.
Listing history 3 events
-
2026-06-17remarks 699-char remark
-
2026-06-07remarks 356-char remark
-
2026-06-07$79,900 Pending
ⓘ Source: listings_history table (triggers on properties + properties_extension) + one-shot
backfill from property_details.listing_events for pre-trigger history.
Tax reassessment forecast IN · Partial reset (capped growth)
- Current annual tax
- $383 · $32/mo
- Projected year-2 tax
- $531 · $44/mo
- Expected delta
- +$148/yr (+$12/mo · 38.6%)
ⓘ Screening estimate from a state-policy table — verify with the county assessor before closing.
Nearby sold comps map
Loading sold comps map…
Walkable amenities ~0.75 mi
Loading nearby amenities…
Taxation est. · year 1
- Rental income
- $14,624
- − Mortgage interest
- −$4,476
- − Property taxes
- −$383
- − Insurance
- −$400
- − Repairs & maintenance
- −$1,170
- − Management
- −$1,170
- − HOA
- −$6,324
- − Depreciation
- −$2,324
- Taxable loss
- −$1,623
- Est. tax savings @ 24.0%
- +$389
- After-tax cash flow
- $-193/yr
For passive investors: Depreciation is non-cash, so a rental often shows a tax loss while cash-flowing — sheltering income. Rental losses are passive: they offset passive income freely, and up to $25,000/yr can offset ordinary (W-2) income if you actively participate and your MAGI is under $100k (phasing out to $0 by $150k); unused losses carry forward. On sale, claimed depreciation is recaptured at up to 25%, and gains may owe capital-gains tax (a 1031 exchange can defer both). Figures are a year-1 estimate at your 24.0% rate — not tax advice; consult a CPA.
Schools (NCES district)
- District
- Evansville Vanderburgh School Corporation
- NCES district ID
- 1803450
- Math proficiency
- 36% ▼ -7.00%
- Reading proficiency
- 43% ▼ -3.00%
- Median HH income
- $43,270
- Composite
- 33.41/100
- National rank
- #5471
- State rank
- #153 of 301 in IN
Livability — Evansville
- Score
- 63/100
- State rank
- #416
- US rank
- #15047
Category grades
Schools grade is shown separately in the Schools card above.
Census & demographics
- Census place
- Evansville, IN
- County
- Vanderburgh County · 146,793 people
- City population
- 146,793
- Metro
- Evansville, IN-KY
- Population (ZIP)
- 29,280
- Household income
- $60,897
- Rent vs Own
- Severe rent burden
- 1652.0
Population outlook (Vanderburgh County) Hauer SSP2
- Today (2025)
- 187,038 people
- By 2030
- 188,907 · +1.0%
- By 2040
- 190,272 · +1.7%
- By 2050
- 188,871 · +1.0%
- By 2075
- 180,751 · -3.4%
- By 2100
- 163,015 · -12.8%
Race, ethnicity, and origin ACS 2023
- Neighborhood character
- Predominantly White (74%)
- Race & ethnicity
- White 74% Black 13% Hispanic / Latino 6% Two or more races 4% Asian 2% Native American 1%
- Hispanic origin (detail)
- Mexican 5%
- Common ancestry
- Slovak 3% Romanian 2% Italian 2%
- Foreign-born
- 6% · Canada, China
- Languages at home
- 93% English-only · Spanish 4% Chinese 1%
Political lean MEDSL · Vanderburgh
- 2024 margin
- R (+12.7) · D 43.0% · R 55.6% · Other 1.4%
- 2008→2024 swing
- -15.1pp toward R · 2008: 2.5pp · 2024: -12.7pp
- All cycles
- 2024: R+12.7 2020: R+9.6 2016: R+16.9 2012: R+10.8 2008: D+2.5
Not yet ingested
- Civics
- —
Market trends
- HPI YoY
- ▼ -113.01%
- Current HPI
- 195.7299
- Rent YoY
- —
- Metro
- Evansville, IN-KY
- State GDP YoY
- ▲ 2.90%
- F500 in state
- 18
Industry mix (Fortune 500 HQ in IN)
| Industry | F500 HQs | Revenue |
|---|---|---|
| Industrial Machinery | 2 | $37B |
|
||
| Healthcare | 1 | $177B |
|
||
| Pharmaceuticals | 1 | $45B |
|
||
| Metals / Steel | 1 | $18B |
|
||
| Agriculture | 1 | $17B |
|
||
| Packaging | 1 | $12B |
|
||
Price history
+6.7% since first listed4 events — show timeline
- 2026-06-05 Delisted — IRMLS
- 2026-06-05 Listed $79,900 IRMLS
- 2022-03-04 Sold (MLS) $73,700 IRMLS
- 2021-11-18 Listed $74,900 IRMLS
Property tax history
+13.7%/yrLatest (2024): $383 · -19.7% YoY. Source: county tax records.
Cash-flow waterfall
monthlySold comps — $/sqft
last 12 mo · ≤1 miLoading sold comps…