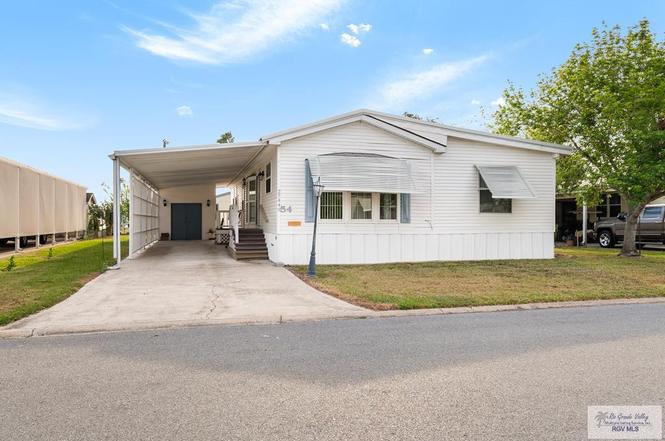
27449 Washington Ave · La Feria, TX
Flood risk 7/10 · Major
- FEMA flood zone
- X (unshaded)
- Chance of flooding over 30 yrs
- 0.95%
- Est. flood insurance / yr
- $507 – $1,088
Fire risk 4/10 · Minor
- Est. fire insurance / yr
- $1,222 – $2,270
Heat risk 9/10 · Severe
- Hot days now (above 111°F)
- 7 days/yr
- Hot days in 30 yrs
- 23 days/yr
Wind risk 9/10 · Severe
- Chance of severe wind over 30 yrs
- 99.0%
Air-quality risk 1/10 · Minimal
- Unhealthy air days now
- 0 days/yr
- Unhealthy air days in 30 yrs
- 0 days/yr
Risk factors via First Street. Map © Google.
Why this score? — see what drove the C- grade
The composite is a weighted blend of 9 inputs, each scored 0–100. Each bar is that input's sub-score; the figure is the points it added to the 100-point composite (weight × sub-score).
- Cash flow +21.4/30.0
- ARV discount +7.5/15.0
- DSCR +6.8/10.0
- 1% rule +5.6/10.0
- Condition / age +3.8/5.0
- Livability +3.2/5.0
- Rent growth +2.5/5.0
- Schools +2.5/10.0
- Appreciation +0.0/10.0
$142,000
🖨 Deal sheet 📄 Offer letter ✓ Due diligence
Listing remarks
Turn Key, Partially furnished 3 Bedroom, 2 Full bathroom home in the tranquil Green Bay South 55+ Community! Home offers an open kitchen with a large Butler's pantry with tons of additional storage space and a freezer. Large dining area with beautiful glass french doors that open to the separate living area. Primary bedroom boasts built-in cabinets and an updated en suite bathroom. Over-sized 3rd bedroom is currently being used as a crafting room, but could be used as a 3rd bedroom. 2nd full bathroom has been beautifully updated and features a large, tiled walk-in shower with hand rails. Home has a convenient laundry room with washer and dryer. Home has a 2-3 car covered carport plus an add
Key facts
- Tiled walk-in shower
- Covered carport
- Open kitchen
Tags
Property features AI
Finance
- HOA & community: Homeowners association present with monthly fees; Senior community
Exterior
- Security: Smoke detectors
- Utilities: Public water; Septic tank; Cable available
- Home design: Manufactured home; Single-story
- Construction: Aluminum siding; Vinyl siding; Metal roof
- Exterior features: Covered patio/porch; Deck; Workshop
Interior
- Flooring: Carpet
- Bathrooms: 2 full bathrooms
- Heating & cooling: Central heating (electric); Central air conditioning; Ceiling fans
- Interior features: Bay windows; Crawl space
- Laundry & utility: Washer and dryer included; Electric water heater
Neighborhood map
What this means for you Summary
Snapshot
- This is a 3-bed/2.0-bath manufactured listed at $142k. Condition is rated good.
Deal economics
- At list price, monthly cash flow is $144 ($2k/yr) — positive.
- The deal already cash-flows at list — no discount required.
- Meets the 1% rule at list price ($2k rent vs $142k).
- Recommended offer: $133k (6.0% below list) — sets the bar for market timing.
- Cap rate 8.1% vs local median 4.4% in La Feria — top-decile yield for the area; either an underpriced asset or a hidden risk that comps aren't pricing in. Stress-test before assuming the spread holds.
Location & tenants
- Location reads 65/100 on livability (#667 in TX) — a middle-class / working-renter tenant base. Strengths: cost of living A+, housing A+; Watch: crime D+, amenities F, commute F.
- La Feria ISD (suburban): math 27% / reading 35% proficiency, ranked #630 of 826 in TX (top 76%) — families likely to look elsewhere, expect single-tenant / working-renter base with shorter leases.
- Zoned schools: La Feria H S (math 32% / reading 52%, grade F, #730 of 1,632 statewide, top 47%, 909 students, 85% FRL) — zoned schools average 85% FRL vs 50% district-wide (35 pts higher); higher-poverty schools than district average — tighter screening recommended.
- Market conditions: 260 active listings in the ZIP; 2,326 units permitted in Cameron County in 2024 (503 in 5+ unit buildings).
Forward outlook
- Local home prices are declining (-3.0%/yr); year-one equity from $982 of loan paydown is wiped out by about $4k of value loss. Plan a longer hold.
- Cameron County population projected at +3% by 2050 — modest demand growth; plan on rents tracking national, not racing it.
Negotiation context
- It's been on market 74 days — a 6% lower offer ($133k) is reasonable based on typical stale-listing flexibility.
Risks & watch-outs
- Watch-outs: flood insurance adds $66/mo.
- Climate carrying-cost: major flood risk; severe wind risk, 99% chance of damaging wind over 30y; extreme-heat days projected 7→23/yr by 2055 (HVAC capex compounding) — expect insurance premiums to compound above CPI over the hold.
Questions for the listing agent
- It's been on market 74 days. Have you received any prior offers? Is the seller open to a 6% concession, seller financing, or rate buy-down credit?
- What's the actual annual flood-insurance premium (NFIP or private), and is the property in a SFHA with mandatory coverage?
- Why hasn't it sold? Are there any deal-killer items the seller is aware of (foundation, flood, title, zoning, code violations)?
- Is there a deadline driving the sale (1031 exchange, divorce, estate, relocation)? That informs how much negotiation room exists.
- Crime grade is D in this area — have there been break-ins, vandalism, or insurance claims at this property in the last 3 years? What carrier currently insures it and at what premium?
- What's the average days-on-market for RENTAL listings here right now (not sales)? A rising rental-DOM trend means longer vacancies and softer asking-rent achievability than the comps imply.
- What's the recent tenant-quality profile in this submarket — average credit score on applications, eviction rate, late-payment / NSF rate, and stable-employment percentage? A property-management company in the area should have these aggregated.
- How much new for-sale + rental construction is in the pipeline within 1–3 miles? Heavy new supply typically softens prices + rents 12–24 months out; constrained supply supports both.
Investment metrics
- 1% rule
- 1.06% ✓
- Cap rate
- 8.07%
- Cash-on-cash
- 6.36%
- DSCR
- 1.28
- GRM
- 7.8
CMA / ARV
No comps found within radius.
Projected returns pro-forma
-3.0% appreciation · 3.0% rent growth · sell at horizon
- IRR
- -9.5%
- Equity multiple
- 0.65×
- Total profit
- $-13,766
- Equity at exit
- $21,173
- IRR
- 0.0%
- Equity multiple
- 1.00×
- Total profit
- $93
- Equity at exit
- $12,278
Cash invested: $39,760 (down + closing). Projections, not guarantees.
Landlord ↔ Tenant lean methodology
- Overall (STATE)
- 87 Strongly Landlord-Friendly
- State Texas
- 87 Strongly Landlord-Friendly · R+5
- County
- — inherits STATE
- City
- — inherits STATE
ZIP-level market 78559
- Home prices YoY
- -6.1%
- Active inventory
- 260
- Price-to-rent
- 7.8×
Monthly cashflow live
- Estimated rent
- $1,509 medium interval (Pro) →
- Mortgage (P&I)
- −$745
- Tax est. 1.5%
- −$178 /mo · $2,130/yr
- Insurance
- −$59
- Flood insurance flood zone
- −$66 /mo · $798/yr
- HOA
- −$0
- Vacancy / Maint / Mgmt
- −$317
- Net cashflow
- $144
Break-even live
UW: 25.0% down · 7.5% · 30yr · 1.5% tax · 5.0% vac · 8.0% maint · 8.0% mgmt
Financing live
Cash to close
- Down payment
- $35,500
- Closing costs
- $4,260
- Reserves months
- —
- Total cash needed
- —
Loan-product check · same deal, 3 products live
Conventional
25% down · 7.5% · 30yr
- Down + closing
- —
- Monthly P&I
- —
- Monthly cashflow
- —
- DSCR
- —
- Eligible?
- —
Personal DTI + credit; lowest rate.
DSCR
20% down · 8.5% · 30yr
- Down + closing
- —
- Monthly P&I
- —
- Monthly cashflow
- —
- DSCR
- —
- Eligible?
- —
No personal income docs; deal must DSCR.
Hard money
10% down · 12.0% · 12mo
- Down + closing
- —
- Monthly P&I
- —
- Monthly cashflow
- —
- DSCR
- —
- Eligible?
- —
Short-term bridge; refi at stabilization.
Listing history 3 events
-
2026-05-22status Pending
-
2026-04-10historical Active Under Contract
-
2026-03-09$142,000 Active
ⓘ Source: listings_history table (triggers on properties + properties_extension) + one-shot
backfill from property_details.listing_events for pre-trigger history.
Climate risk First Street
- Flood 7/10 Severe FEMA zone X (unshaded) · 95% chance over 30 yrs
- Wildfire 4/10 Moderate
- Heat 9/10 Extreme 7 d/yr ≥111°F today · 23 d/yr by 30 yrs out
- Wind 9/10 Extreme 99% chance of damaging wind over 30 yrs
- Air quality 1/10 Low 0 unhealthy d/yr today · 0 by 30 yrs out
Nearby sold comps map
Loading sold comps map…
Walkable amenities ~0.75 mi
Loading nearby amenities…
Taxation est. · year 1
- Rental income
- $18,105
- − Mortgage interest
- −$7,954
- − Property taxes
- −$2,130
- − Insurance
- −$1,508
- − Repairs & maintenance
- −$1,448
- − Management
- −$1,448
- − Depreciation
- −$4,131
- Taxable loss
- −$514
- Est. tax savings @ 24.0%
- +$123
- After-tax cash flow
- $1,853/yr
For passive investors: Depreciation is non-cash, so a rental often shows a tax loss while cash-flowing — sheltering income. Rental losses are passive: they offset passive income freely, and up to $25,000/yr can offset ordinary (W-2) income if you actively participate and your MAGI is under $100k (phasing out to $0 by $150k); unused losses carry forward. On sale, claimed depreciation is recaptured at up to 25%, and gains may owe capital-gains tax (a 1031 exchange can defer both). Figures are a year-1 estimate at your 24.0% rate — not tax advice; consult a CPA.
Condition & rehab AI · 13 photos
This manufactured home is in good condition with cosmetic updates needed. Painting the exterior and updating the kitchen would significantly increase its value.
Value-add opportunities
- Both Paint exterior — Enhances curb appeal and value
- Both Replace carpet with hardwood — Improves aesthetics and value
- Both Update kitchen backsplash — Modernizes kitchen and adds value
Renovation cost estimate screening
Value-add ROI direction
- Both Paint exterior — Enhances curb appeal and value ↑
- Both Replace carpet with hardwood — Improves aesthetics and value ↑
- Both Update kitchen backsplash — Modernizes kitchen and adds value ↑
ⓘ Cost ranges are severity-bucket heuristics (US national rule-of-thumb). Get contractor quotes + a written scope before underwriting a rehab budget.
Schools (NCES district)
- District
- La Feria ISD
- NCES district ID
- 4826040
- Math proficiency
- 27% ▼ -25.00%
- Reading proficiency
- 35% ▼ -4.00%
- Median HH income
- $33,306
- Composite
- 25.41/100
- National rank
- #7460
- State rank
- #630 of 826 in TX
Livability — La Feria
- Score
- 65/100
- State rank
- #667
- US rank
- #12330
Category grades
Schools grade is shown separately in the Schools card above.
Census & demographics
- Population (ZIP)
- 12,752
Population outlook (Cameron County) Hauer SSP2
- Today (2025)
- 441,603 people
- By 2030
- 448,113 · +1.5%
- By 2040
- 456,385 · +3.3%
- By 2050
- 456,294 · +3.3%
- By 2075
- 423,851 · -4.0%
- By 2100
- 342,787 · -22.4%
Race, ethnicity, and origin ACS 2023
- Neighborhood character
- Predominantly Hispanic (91%)
- Race & ethnicity
- Hispanic / Latino 91% Two or more races 35% White 8%
- Hispanic origin (detail)
- Mexican 87%
- Common ancestry
- Slovak 1% Lithuanian 1%
- Foreign-born
- 17% · Canada
- Languages at home
- 40% English-only · Spanish 60%
Political lean MEDSL · Cameron
- 2024 margin
- Lean R (+5.8) · D 46.7% · R 52.5%
- 2008→2024 swing
- -34.6pp toward R · 2008: 28.8pp · 2024: -5.8pp
- All cycles
- 2024: R+5.8 2020: D+13.2 2016: D+32.5 2012: D+32.4 2008: D+28.8
Not yet ingested
- Civics
- —
Market trends
- HPI YoY
- ▼ -12.21%
- Current HPI
- 187.8512
- Rent YoY
- —
- Metro
- —
- State GDP YoY
- ▲ 3.95%
- F500 in state
- 110
Industry mix (Fortune 500 HQ in TX)
| Industry | F500 HQs | Revenue |
|---|---|---|
| Energy | 16 | $1,198B |
|
||
| Technology | 5 | $198B |
|
||
| Engineering / Construction | 4 | $72B |
|
||
| Energy Services | 3 | $60B |
|
||
| Utilities | 3 | $41B |
|
||
| Healthcare | 2 | $330B |
|
||
Price history
3 events — show timeline
- 2026-05-22 Pending — RGVMLS
- 2026-04-10 Contingent — RGVMLS
- 2026-03-09 Listed $142,000 RGVMLS
Cash-flow waterfall
monthlySold comps — $/sqft
last 12 mo · ≤1 miLoading sold comps…