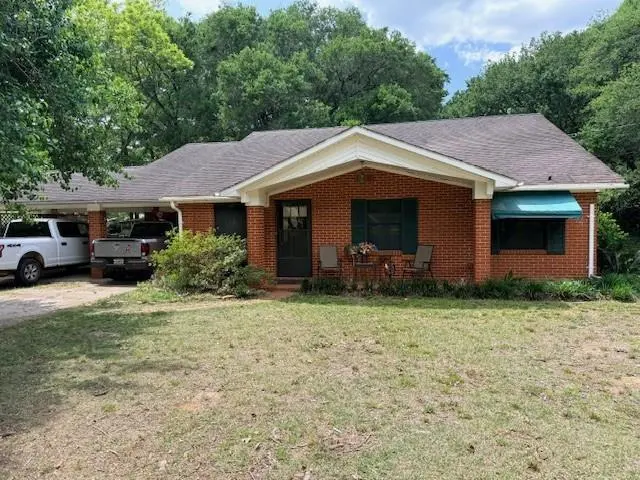
19655 Laird Dr · Citronelle, AL
Flood risk 1/10 · Minimal
- FEMA flood zone
- X (unshaded)
- Chance of flooding over 30 yrs
- 0.0%
- Est. flood insurance / yr
- $507 – $1,088
Fire risk 5/10 · Moderate
- Est. fire insurance / yr
- $916 – $1,700
Heat risk 8/10 · Major
- Hot days now (above 107°F)
- 7 days/yr
- Hot days in 30 yrs
- 20 days/yr
Wind risk 9/10 · Severe
- Chance of severe wind over 30 yrs
- 99.0%
Air-quality risk 1/10 · Minimal
- Unhealthy air days now
- 0 days/yr
- Unhealthy air days in 30 yrs
- 0 days/yr
Risk factors via First Street. Map © Google.
Why this score? — see what drove the C- grade
The composite is a weighted blend of 9 inputs, each scored 0–100. Each bar is that input's sub-score; the figure is the points it added to the 100-point composite (weight × sub-score).
- ARV discount +13.4/15.0
- Cash flow +13.1/30.0
- Appreciation +10.0/10.0
- DSCR +3.9/10.0
- Livability +3.1/5.0
- 1% rule +2.6/10.0
- Rent growth +2.5/5.0
- Condition / age +2.5/5.0
- Schools +2.3/10.0
$149,170
🖨 Deal sheet 📄 Offer letter ✓ Due diligence
Listing remarks
* * * SELLERS WILL ENTERTAIN OFFERS BETWEEN $149,000-$170,000. LIST PRICE EQUALS THE COMBINED UPPER AND LOWER VALUE RANGES. * * * Welcome to 19655 Laird Dr in Citronelle—a well-maintained 3-bedroom, 2-bath brick home set on a large, beautiful yard with plenty of space to enjoy the outdoors. The classic brick exterior offers timeless curb appeal, and the home’s layout provides comfortable living areas designed for everyday ease. Step outside and take in the expansive yard—ideal for gardening, relaxing, entertaining, or simply enjoying open space. The property also includes two outbuildings with electricity, offering convenient extra storage or flexible space for hobbie
Key facts
- Large beautiful yard
- 0.93 acre lot
- 2 parking spots
Tags
Property features AI
Exterior
- Parking: Carport (2 spaces)
- Utilities: Public sewer; No electric specified; No other utilities specified
- Home design: Single Family Residence; Residential property
- Construction: Built in 1962; Other roof; No foundation details specified
- Exterior features: Outbuilding; No additional exterior features specified
Interior
- Bedrooms: 3 bedrooms
- Flooring: No flooring specified
- Bathrooms: 2 full bathrooms
- Heating & cooling: No heating specified; No cooling specified
- Interior features: Other interior features
Neighborhood map
What this means for you Summary
Snapshot
- This is a 3-bed/1.5-bath single-family listed at $149k.
Deal economics
- At list price, monthly cash flow is $-5 ($-55/yr) — negative.
- To cash-flow at today's rent, offer at most $148k (0.5% below list).
- To meet the 1% rule (rent ≥ 1% of price), the offer needs to be $113k (24.3% below list).
- Recommended offer: $113k (24.3% below list) — sets the bar for 1% rule.
- Cap rate 6.3% vs local median 5.2% in Citronelle — meaningfully above typical; check what's discounted (condition, days-on-market, listing class) to confirm the premium yield is real.
Location & tenants
- Location reads 61/100 on livability (#254 in AL) — a middle-class / working-renter tenant base. Strengths: crime A+, cost of living A+, housing B+; Watch: employment C-, amenities F, commute F.
- Mobile County (urban): math 15% / reading 39% proficiency, ranked #81 of 129 in AL (top 63%) — low school quality limits family demand, transient renter base, plan for 1-2y turnover; 67% free/reduced lunch — lower-income household profile, screen leases tightly.
- Zoned schools: Citronelle High School (math 8% / reading 8%, grade F, #261 of 305 statewide, top 87%, 719 students, 70% FRL) — zoned schools at 70% FRL track the district average.
- Zoned-school proficiency averages 8% at this address vs 27% district-wide (-20 pts) — the specific schools serving this property underperform the Mobile County average; the district grade overstates school quality for this exact location.
- Market conditions: 63 active listings in the ZIP; 2 comparable units currently listed for rent nearby; 1,678 units permitted in Mobile County in 2024 (264 in 5+ unit buildings).
Forward outlook
- In year one you build about $16k of equity ($1k loan paydown + $15k appreciation (10.0% local appreciation)).
- Mobile County population projected to shrink 8% by 2050 — rents likely to lag national; underwrite the cash flow, not the appreciation.
- At projected returns (10.0% appreciation + 3.0% rent growth), your $42k cash investment doubles in ~3 years — after that, you're playing with house money.
- By year 3, paydown + projected appreciation supports a ~$40k cash-out refi (75% LTV) — recoverable capital for the next deal without selling this one.
Negotiation context
- It's been on market 29 days — a 2% lower offer ($147k) is reasonable based on typical stale-listing flexibility.
- Current owner paid $84k; list at $149k implies a 78% gain — meaningful room to come down on a strong offer.
Risks & watch-outs
- Climate carrying-cost: severe wind risk, 99% chance of damaging wind over 30y; moderate wildfire risk; extreme-heat days projected 7→20/yr by 2055 (HVAC capex compounding) — expect insurance premiums to compound above CPI over the hold.
Questions for the listing agent
- What do current leases actually rent for vs. the listed asking? Can we see a recent rent roll and the last 12 months of T-12 income?
- Built in 1962 — when were the roof, HVAC, electrical panel, plumbing, and water heater last replaced?
- Is there a deadline driving the sale (1031 exchange, divorce, estate, relocation)? That informs how much negotiation room exists.
- Schools are F-rated, which usually means shorter tenancies and higher turnover. Who's the typical renter profile here, and what's been the actual vacancy rate?
- What's the average days-on-market for RENTAL listings here right now (not sales)? A rising rental-DOM trend means longer vacancies and softer asking-rent achievability than the comps imply.
- What's the recent tenant-quality profile in this submarket — average credit score on applications, eviction rate, late-payment / NSF rate, and stable-employment percentage? A property-management company in the area should have these aggregated.
- How much new for-sale + rental construction is in the pipeline within 1–3 miles? Heavy new supply typically softens prices + rents 12–24 months out; constrained supply supports both.
Investment metrics
- 1% rule
- 0.76% ✗
- Cap rate
- 6.26%
- Cash-on-cash
- -0.13%
- DSCR
- 0.99
- GRM
- 11.0
CMA / ARV
- ARV (median comp)
- $171,836
- List price
- $149,170
- Delta
- -13.19%
- Verdict
- UNDERPRICED
- Comps
- 20 within 1.0 mi
Show comp detail 8 sales within ~0.75 mi
| Address | Dist | Beds/Ba | Sqft | Sold | Price | $/sf | Match |
|---|---|---|---|---|---|---|---|
| 19860 Indiana St | 0.41mi | 3/2.0 | 1,500 (+0%) | 5mo | $190,500 | $127 | 74 |
| 8450 Craft Dr | 0.51mi | 3/2.0 | 1,512 (+1%) | 10mo | $235,000 | $155 | 64 |
| 8350 Grove Park | 0.34mi | 3/1.5 | 1,680 (+12%) | 9mo | $191,500 | $114 | 56 |
| 19645 N 5th St | 0.70mi | 3/2.0 | 1,455 (-3%) | 8mo | $168,500 | $116 | 54 |
| 19230 1st St | 0.64mi | 3/2.0 | 1,344 (-10%) | 1mo | $208,000 | $155 | 50 |
| 19855 Indiana St | 0.44mi | 3/2.0 | 1,691 (+13%) | 20mo | $225,000 | $133 | 39 |
| 8600 Williams St W | 0.71mi | 3/2.0 | 1,664 (+11%) | 11mo | $140,000 | $84 | 37 |
| 19805 5th St N | 0.74mi | 2/1.0 (-1) | 1,280 (-14%) | 10mo | $122,000 | $95 | 26 |
Match score weights: distance 35% · size 25% · config 20% · recency 20%. Top-matched comps best support the ARV.
Projected returns pro-forma
10.0% appreciation · 3.0% rent growth · sell at horizon
- IRR
- 24.2%
- Equity multiple
- 2.94×
- Total profit
- $80,883
- Equity at exit
- $134,384
- IRR
- 21.4%
- Equity multiple
- 6.71×
- Total profit
- $238,288
- Equity at exit
- $289,805
Cash invested: $41,768 (down + closing). Projections, not guarantees.
Landlord ↔ Tenant lean methodology
- Overall (STATE)
- 90 Strongly Landlord-Friendly
- State Alabama
- 90 Strongly Landlord-Friendly · R+15
- County
- — inherits STATE
- City
- — inherits STATE
ZIP-level market 36522
- Home prices YoY
- 11.8%
- Active inventory
- 63
- Price-to-rent
- 11.0×
Monthly cashflow live
- Estimated rent
- $1,129 medium interval (Pro) →
- Mortgage (P&I)
- −$782
- Tax from tax record
- −$52 /mo · $630/yr
- Insurance
- −$62
- HOA
- −$0
- Vacancy / Maint / Mgmt
- −$237
- Net cashflow
- $-5
Break-even live
UW: 25.0% down · 7.5% · 30yr · 1.5% tax · 5.0% vac · 8.0% maint · 8.0% mgmt
Financing live
Cash to close
- Down payment
- $37,292
- Closing costs
- $4,475
- Reserves months
- —
- Total cash needed
- —
Loan-product check · same deal, 3 products live
Conventional
25% down · 7.5% · 30yr
- Down + closing
- —
- Monthly P&I
- —
- Monthly cashflow
- —
- DSCR
- —
- Eligible?
- —
Personal DTI + credit; lowest rate.
DSCR
20% down · 8.5% · 30yr
- Down + closing
- —
- Monthly P&I
- —
- Monthly cashflow
- —
- DSCR
- —
- Eligible?
- —
No personal income docs; deal must DSCR.
Hard money
10% down · 12.0% · 12mo
- Down + closing
- —
- Monthly P&I
- —
- Monthly cashflow
- —
- DSCR
- —
- Eligible?
- —
Short-term bridge; refi at stabilization.
Rent comps 2 comps
| Address | Beds | Baths | Sqft | Rent | $/sqft | DOM | Units | Dist |
|---|---|---|---|---|---|---|---|---|
| 19490 Magnolia St Unit D Citronelle, AL | 2.0 | 1.0 | 900 | $940 | $1.04 | 43d | 1 | 0.24mi |
| 8685 W Williams St Citronelle, AL | 3.0 | 2.0 | 1716 | $1,600 | $0.93 | 13d | 1 | 0.88mi |
Listing history 3 events
-
2026-05-17price $149,170 935-char remark
-
2026-04-28$174,900 Active 935-char remark
-
2011-09-28soldstatus $83,881
ⓘ Source: listings_history table (triggers on properties + properties_extension) + one-shot
backfill from property_details.listing_events for pre-trigger history.
Tax reassessment forecast AL · Resets to sale price
- Current annual tax
- $630 · $52/mo
- Projected year-2 tax
- $630 · $52/mo
- Expected delta
- $0/yr ($0/mo · 0.0%)
ⓘ Screening estimate from a state-policy table — verify with the county assessor before closing.
Climate risk First Street
- Flood 1/10 Low FEMA zone X (unshaded) · 0% chance over 30 yrs
- Wildfire 5/10 Major
- Heat 8/10 Severe 7 d/yr ≥107°F today · 20 d/yr by 30 yrs out
- Wind 9/10 Extreme 99% chance of damaging wind over 30 yrs
- Air quality 1/10 Low 0 unhealthy d/yr today · 0 by 30 yrs out
Nearby sold comps map
Loading sold comps map…
Walkable amenities ~0.75 mi
Loading nearby amenities…
Taxation est. · year 1
- Rental income
- $13,553
- − Mortgage interest
- −$8,356
- − Property taxes
- −$630
- − Insurance
- −$746
- − Repairs & maintenance
- −$1,084
- − Management
- −$1,084
- − Depreciation
- −$4,339
- Taxable loss
- −$2,686
- Est. tax savings @ 24.0%
- +$645
- After-tax cash flow
- $589/yr
For passive investors: Depreciation is non-cash, so a rental often shows a tax loss while cash-flowing — sheltering income. Rental losses are passive: they offset passive income freely, and up to $25,000/yr can offset ordinary (W-2) income if you actively participate and your MAGI is under $100k (phasing out to $0 by $150k); unused losses carry forward. On sale, claimed depreciation is recaptured at up to 25%, and gains may owe capital-gains tax (a 1031 exchange can defer both). Figures are a year-1 estimate at your 24.0% rate — not tax advice; consult a CPA.
Schools (NCES district)
- District
- Mobile County
- NCES district ID
- 0102370
- Math proficiency
- 15% ▼ -28.00%
- Reading proficiency
- 39% ▬ 0.00%
- Median HH income
- $42,455
- Composite
- 22.9/100
- National rank
- #8002
- State rank
- #81 of 129 in AL
Livability — Citronelle
- Score
- 61/100
- State rank
- #254
- US rank
- #17928
Category grades
Schools grade is shown separately in the Schools card above.
Census & demographics
- Census place
- Citronelle, AL
- City population
- 6,892
- Population (ZIP)
- 6,892
Population outlook (Mobile County) Hauer SSP2
- Today (2025)
- 415,303 people
- By 2030
- 411,755 · -0.9%
- By 2040
- 399,670 · -3.8%
- By 2050
- 382,616 · -7.9%
- By 2075
- 337,353 · -18.8%
- By 2100
- 283,391 · -31.8%
Race, ethnicity, and origin ACS 2023
- Neighborhood character
- Predominantly White (69%)
- Race & ethnicity
- White 69% Black 18% Two or more races 7%
- Common ancestry
- Slovak 3% Lithuanian 3% Italian 2%
- Foreign-born
- 1%
- Languages at home
- 98% English-only · Other Indo-European 1%
Political lean MEDSL · Mobile
- 2024 margin
- R (+16.4) · D 41.3% · R 57.7%
- 2008→2024 swing
- -7.7pp toward R · 2008: -8.7pp · 2024: -16.4pp
- All cycles
- 2024: R+16.4 2020: R+11.9 2016: R+13.9 2012: R+9.3 2008: R+8.7
Not yet ingested
- Civics
- —
Market trends
- HPI YoY
- ▲ 27.55%
- Current HPI
- 260.4914
- Rent YoY
- —
- Metro
- —
- State GDP YoY
- ▲ 2.94%
- F500 in state
- 4
Industry mix (Fortune 500 HQ in AL)
| Industry | F500 HQs | Revenue |
|---|---|---|
| Financial Services | 1 | $8B |
|
||
| Healthcare | 1 | $5B |
|
||
Price history
+77.8% since first listed4 events — show timeline
- 2026-05-27 Pending — GCMLS AL
- 2026-05-17 Price Changed $149,170 GCMLS AL
- 2026-04-28 Listed $174,900 GCMLS AL
- 2011-09-28 Sold (Public Records) $83,881 Public Records
Property tax history
+2.5%/yrLatest (2025): $630 · +0.0% YoY. Source: county tax records.
Cash-flow waterfall
monthlySold comps — $/sqft
last 12 mo · ≤1 miLoading sold comps…