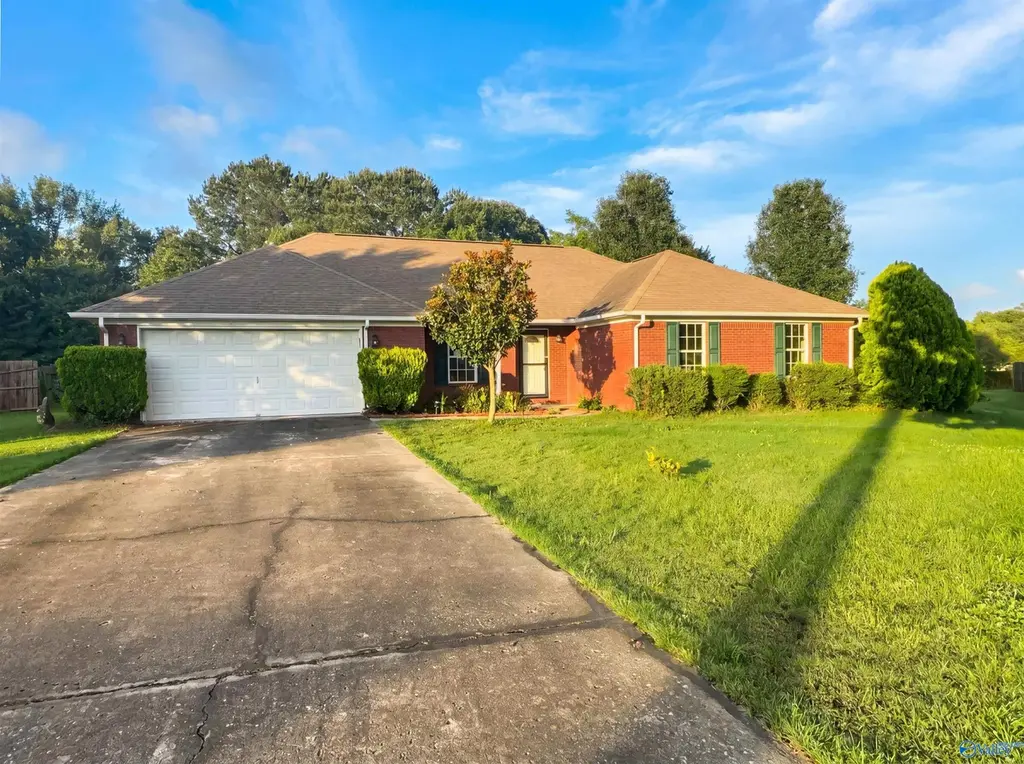
223 Williston Dr · Huntsville, AL
Flood risk 1/10 · Minimal
- FEMA flood zone
- X (unshaded)
- Chance of flooding over 30 yrs
- 0.0%
- Est. flood insurance / yr
- $507 – $1,088
Fire risk 3/10 · Minor
- Est. fire insurance / yr
- $916 – $1,700
Heat risk 6/10 · Moderate
- Hot days now (above 104°F)
- 7 days/yr
- Hot days in 30 yrs
- 19 days/yr
Wind risk 4/10 · Minor
- Chance of severe wind over 30 yrs
- 16.0%
Air-quality risk 2/10 · Minimal
- Unhealthy air days now
- 0 days/yr
- Unhealthy air days in 30 yrs
- 1 days/yr
Risk factors via First Street. Map © Google.
Why this score? — see what drove the D- grade
The composite is a weighted blend of 9 inputs, each scored 0–100. Each bar is that input's sub-score; the figure is the points it added to the 100-point composite (weight × sub-score).
- Appreciation +10.0/10.0
- Cash flow +6.9/30.0
- ARV discount +6.5/15.0
- Livability +4.1/5.0
- Schools +3.7/10.0
- Rent growth +3.1/5.0
- Condition / age +2.5/5.0
- DSCR +1.1/10.0
- 1% rule +0.9/10.0
$325,000
🖨 Deal sheet 📄 Offer letter ✓ Due diligence
Listing remarks MLS
Beautiful full brick ranch style home on a Cul-de-sac. 4 bed, 2 full bath in the heart of Monrovia. Enjoy the updated flooring in the entry, dining room, and great room with vaulted ceilings with gas log fire place and all new paint throughout. The master bedroom features new flooring and trey ceilings. Master bath has a glamour bath with whirlpool tub and separate shower and 2 large walk in closets. Spacious kitchen features large windows that overlook large fenced backyard with extended patio. Located right off of Indian Creek Road, this home is minutes from Research Park, Redstone Arsenal, and Providence.
Key facts
- Fenced in backyard
- Covered patio
- Storage shed
Tags
Property features AI
Finance
- Other: Lot about 0.48 acres
- HOA & community: No homeowners association; Subdivision: Monrovia Pointe
Exterior
- Parking: Attached garage
- Utilities: Public water; Septic sewer
- Home design: Single-family residence; One story; Built in 2000; Residential property
- Construction: Brick construction; Slab foundation
- Exterior features: Public water; Septic tank
Interior
- Bathrooms: 2 full bathrooms
- Heating & cooling: Central heating; Central cooling
- Interior features: Gas log fireplace (one)
Neighborhood map
What this means for you Summary
Snapshot
- This is a 4-bed/1.0-bath single-family listed at $325k.
Deal economics
- At list price, monthly cash flow is $-490 ($-6k/yr) — negative.
- To cash-flow at today's rent, offer at most $238k (26.6% below list).
- To meet the 1% rule (rent ≥ 1% of price), the offer needs to be $191k (41.3% below list).
- Recommended offer: $191k (41.3% below list) — sets the bar for 1% rule.
Location & tenants
- Location reads 82/100 on livability (#3 in AL, #1,082 nationally) — a professional / high-income tenant draw. Strengths: commute A+, cost of living A+, housing A+; Watch: crime F.
- Madison County (rural): math 27% / reading 56% proficiency, ranked #19 of 129 in AL (top 15%) — families likely to look elsewhere, expect single-tenant / working-renter base with shorter leases.
- Zoned schools: Monrovia Elementary School (math 37% / reading 69%, grade C, #100 of 627 statewide, top 16%, 495 students, 29% FRL); Monrovia Middle School (math 29% / reading 66%, grade C-, #32 of 257 statewide, top 12%, 1,003 students, 31% FRL); Sparkman High School (math 28% / reading 37%, grade F, #58 of 305 statewide, top 19%, 1,738 students, 37% FRL) — zoned schools at 32% FRL track the district average.
- Market conditions: Rents rising (+2.6%/yr); 213 active listings in the ZIP; 16 comparable units currently listed for rent nearby; rentals at typical pace (median 24d on market — plan ~3-4 weeks tenant-placement turnaround); solid renter incomes; 4,709 units permitted in Madison County in 2024 (1,186 in 5+ unit buildings).
Forward outlook
- In year one you build about $35k of equity ($2k loan paydown + $32k appreciation (10.0% local appreciation)).
- Madison County population projected at +18% by 2050 — long-run rental-demand tailwind backs the buy-and-hold thesis.
- By year 2, paydown + projected appreciation supports a ~$56k cash-out refi (75% LTV) — recoverable capital for the next deal without selling this one.
Negotiation context
- Only 10 days on market — expect competitive offers; lowballing is unlikely to land.
- 3 sale attempts since 11y ago with the ask held roughly flat each time — persistent listings suggest the price (not the market) is what's stuck; bring a comps-based counter.
Risks & watch-outs
- Climate carrying-cost: extreme-heat days projected 7→19/yr by 2055 (HVAC capex compounding) — expect insurance premiums to compound above CPI over the hold.
Questions for the listing agent
- What do current leases actually rent for vs. the listed asking? Can we see a recent rent roll and the last 12 months of T-12 income?
- Is there a deadline driving the sale (1031 exchange, divorce, estate, relocation)? That informs how much negotiation room exists.
- Crime grade is F in this area — have there been break-ins, vandalism, or insurance claims at this property in the last 3 years? What carrier currently insures it and at what premium?
- The area grade is low — what's the realistic commute time and amenity access for the typical tenant pool here? Any planned neighborhood developments (good or bad) we should know about?
- What's the average days-on-market for RENTAL listings here right now (not sales)? A rising rental-DOM trend means longer vacancies and softer asking-rent achievability than the comps imply.
- What's the recent tenant-quality profile in this submarket — average credit score on applications, eviction rate, late-payment / NSF rate, and stable-employment percentage? A property-management company in the area should have these aggregated.
- How much new for-sale + rental construction is in the pipeline within 1–3 miles? Heavy new supply typically softens prices + rents 12–24 months out; constrained supply supports both.
Investment metrics
- 1% rule
- 0.59% ✗
- Cap rate
- 4.48%
- Cash-on-cash
- -6.46%
- DSCR
- 0.71
- GRM
- 14.2
CMA / ARV
- ARV (on-the-fly)
- $317,856
- Comps found
- 12
Show comp detail 12 sales within ~0.75 mi
| Address | Dist | Beds/Ba | Sqft | Sold | Price | $/sf | Match |
|---|---|---|---|---|---|---|---|
| 109 Sherwin Ave | 0.35mi | 3/2.0 (-1) | 1,840 (+2%) | 5mo | $325,000 | $177 | 67 |
| 124 High Noon Ln | 0.17mi | 4/2.0 | 1,940 (+7%) | 19mo | $329,900 | $170 | 60 |
| 108 Harness Dr | 0.39mi | 3/2.0 (-1) | 1,700 (-6%) | 4mo | $300,000 | $176 | 60 |
| 115 Kretzer Ct | 0.66mi | 3/2.0 (-1) | 1,824 (+1%) | 5mo | $315,000 | $173 | 54 |
| 107 Moonglow Trl | 0.57mi | 3/2.0 (-1) | 1,975 (+9%) | 2mo | $340,000 | $172 | 47 |
| 120 Harness Dr | 0.36mi | 4/2.0 | 2,037 (+13%) | 18mo | $285,000 | $140 | 42 |
| 130 Raccoon Trce | 0.65mi | 3/2.0 (-1) | 1,878 (+4%) | 18mo | $315,000 | $168 | 40 |
| 117 Nevin Cir | 0.73mi | 3/2.0 (-1) | 1,830 (+1%) | 18mo | $339,900 | $186 | 39 |
| 105 Cedar Hollow Ct | 0.70mi | 4/2.0 | 1,980 (+10%) | 11mo | $285,000 | $144 | 39 |
| 116 Indian Valley Rd | 0.59mi | 3/2.0 (-1) | 1,975 (+9%) | 13mo | $362,500 | $184 | 37 |
| 112 Kretzer Ct | 0.66mi | 3/2.0 (-1) | 2,063 (+14%) | 2mo | $389,000 | $189 | 35 |
| 100 Kretzer Ct | 0.72mi | 3/2.0 (-1) | 2,055 (+14%) | 3mo | $375,000 | $182 | 32 |
Match score weights: distance 35% · size 25% · config 20% · recency 20%. Top-matched comps best support the ARV.
Projected returns pro-forma
10.0% appreciation · 2.57% rent growth · sell at horizon
- IRR
- 19.6%
- Equity multiple
- 2.59×
- Total profit
- $144,864
- Equity at exit
- $292,786
- IRR
- 17.9%
- Equity multiple
- 5.94×
- Total profit
- $449,245
- Equity at exit
- $631,404
Cash invested: $91,000 (down + closing). Projections, not guarantees.
Landlord ↔ Tenant lean methodology
- Overall (STATE)
- 90 Strongly Landlord-Friendly
- State Alabama
- 90 Strongly Landlord-Friendly · R+15
- County
- — inherits STATE
- City
- — inherits STATE
ZIP-level market 35806
- Home prices YoY
- 20.0%
- Rents YoY
- 2.6%
- Active inventory
- 213
- Price-to-rent
- 14.2×
Monthly cashflow live
- Estimated rent
- $1,907 high interval (Pro) →
- Mortgage (P&I)
- −$1,704
- Tax from tax record
- −$157 /mo · $1,878/yr
- Insurance
- −$135
- HOA
- −$0
- Vacancy / Maint / Mgmt
- −$400
- Net cashflow
- $-490
Break-even live
UW: 25.0% down · 7.5% · 30yr · 1.5% tax · 5.0% vac · 8.0% maint · 8.0% mgmt
Financing live
Cash to close
- Down payment
- $81,250
- Closing costs
- $9,750
- Reserves months
- —
- Total cash needed
- —
Loan-product check · same deal, 3 products live
Conventional
25% down · 7.5% · 30yr
- Down + closing
- —
- Monthly P&I
- —
- Monthly cashflow
- —
- DSCR
- —
- Eligible?
- —
Personal DTI + credit; lowest rate.
DSCR
20% down · 8.5% · 30yr
- Down + closing
- —
- Monthly P&I
- —
- Monthly cashflow
- —
- DSCR
- —
- Eligible?
- —
No personal income docs; deal must DSCR.
Hard money
10% down · 12.0% · 12mo
- Down + closing
- —
- Monthly P&I
- —
- Monthly cashflow
- —
- DSCR
- —
- Eligible?
- —
Short-term bridge; refi at stabilization.
Rent comps 16 comps
| Address | Beds | Baths | Sqft | Rent | $/sqft | DOM | Units | Dist |
|---|---|---|---|---|---|---|---|---|
| 41 Addison Park Dr Huntsville, AL | 1.0–3.0 | 1.0–2.0 | 1155 | $1,635 | $1.42 | 13d | 45 | 0.40mi |
| 741 Plummer Rd Huntsville, AL | 1.0–3.0 | 1.0–2.0 | 1025 | $1,744 | $1.70 | 13d | 15 | 0.51mi |
| 8223 Stone Mill Dr NW Huntsville, AL | 3.0 | 2.5 | 2046 | $2,300 | $1.12 | 43d | 1 | 0.93mi |
| 393 Johns Rd NW Huntsville, AL | 1.0–3.0 | 1.0–2.0 | 963 | $1,625 | $1.69 | 13d | 16 | 1.02mi |
| 7601 Discovery Point Dr NW Huntsville, AL | 3.0 | 2.5 | 1720 | $1,720 | $1.00 | 43d | 1 | 1.09mi |
| 7599 Discovery Point Dr NW Huntsville, AL | 3.0 | 2.5 | 1500 | $1,720 | $1.15 | 23d | 1 | 1.09mi |
| 7597 Discovery Point Dr NW Huntsville, AL | 3.0 | 2.5 | 1550 | $1,800 | $1.16 | 23d | 1 | 1.09mi |
| 7589 Discovery Point Dr NW Huntsville, AL | 3.0 | 2.5 | 1500 | $1,720 | $1.15 | 23d | 1 | 1.10mi |
| 7582 Discovery Point Dr NW Huntsville, AL | 3.0 | 2.5 | 1500 | $1,720 | $1.15 | 23d | 1 | 1.13mi |
| 7559 Discovery Point Dr NW Huntsville, AL | 3.0 | 2.5 | 1555 | $2,450 | $1.58 | 13d | 1 | 1.14mi |
| 351 Lofton Rd NW Huntsville, AL | 4.0 | 2.5 | 2186 | $2,315 | $1.06 | 13d | 1 | 1.17mi |
| 7500 Discovery Point Dr NW Huntsville, AL | 3.0 | 2.5 | 1527 | $1,822 | $1.19 | 13d | 7 | 1.24mi |
| 7502 Discovery Point Dr NW Huntsville, AL | 3.0 | 2.5 | 1626 | $1,825 | $1.12 | 43d | 1 | 1.24mi |
| 7203 Chatfield Way NW Huntsville, AL | 4.0 | 2.5 | 2047 | $1,799 | $0.88 | 43d | 1 | 1.33mi |
| 1589 Old Monrovia Rd NW Huntsville, AL | 2.0–3.0 | 2.5–3.5 | 1657 | $2,448 | $1.48 | 13d | 17 | 1.45mi |
| 500 Providence Main St NW Huntsville, AL | 1.0–3.0 | 1.0–2.0 | 1090 | $1,793 | $1.64 | 13d | 35 | 1.50mi |
Listing history 8 events
-
2026-06-18days on market $325,000 Active 10 DOM
-
2026-06-17days on market $325,000 Active 9 DOM
-
2026-06-16days on market $325,000 Active 8 DOM
-
2026-06-15days on market $325,000 Active 7 DOM
-
2026-06-14days on market $325,000 Active 5 DOM
-
2026-06-10days on market $325,000 Active 2 DOM
-
2026-06-09remarks 444-char remark
-
2026-06-09$325,000 Active 1 DOM
ⓘ Source: listings_history table (triggers on properties + properties_extension) + one-shot
backfill from property_details.listing_events for pre-trigger history.
Tax reassessment forecast AL · Resets to sale price
- Current annual tax
- $1,878 · $157/mo
- Projected year-2 tax
- $1,878 · $157/mo
- Expected delta
- $0/yr ($0/mo · 0.0%)
ⓘ Screening estimate from a state-policy table — verify with the county assessor before closing.
Climate risk First Street
- Flood 1/10 Low FEMA zone X (unshaded) · 0% chance over 30 yrs
- Wildfire 3/10 Moderate
- Heat 6/10 Major 7 d/yr ≥104°F today · 19 d/yr by 30 yrs out
- Wind 4/10 Moderate 16% chance of damaging wind over 30 yrs
- Air quality 2/10 Low 0 unhealthy d/yr today · 1 by 30 yrs out
Nearby sold comps map
Loading sold comps map…
Walkable amenities ~0.75 mi
Loading nearby amenities…
Taxation est. · year 1
- Rental income
- $22,884
- − Mortgage interest
- −$18,205
- − Property taxes
- −$1,878
- − Insurance
- −$1,625
- − Repairs & maintenance
- −$1,831
- − Management
- −$1,831
- − Depreciation
- −$9,455
- Taxable loss
- −$11,941
- Est. tax savings @ 24.0%
- +$2,866
- After-tax cash flow
- $-3,011/yr
For passive investors: Depreciation is non-cash, so a rental often shows a tax loss while cash-flowing — sheltering income. Rental losses are passive: they offset passive income freely, and up to $25,000/yr can offset ordinary (W-2) income if you actively participate and your MAGI is under $100k (phasing out to $0 by $150k); unused losses carry forward. On sale, claimed depreciation is recaptured at up to 25%, and gains may owe capital-gains tax (a 1031 exchange can defer both). Figures are a year-1 estimate at your 24.0% rate — not tax advice; consult a CPA.
Schools (NCES district)
- District
- Madison County
- NCES district ID
- 0102220
- Math proficiency
- 27% ▼ -32.00%
- Reading proficiency
- 56% ▼ -1.00%
- Median HH income
- $66,058
- Composite
- 37.15/100
- National rank
- #4483
- State rank
- #19 of 129 in AL
Livability — Huntsville
- Score
- 82/100
- State rank
- #3
- US rank
- #1082
Category grades
Schools grade is shown separately in the Schools card above.
Census & demographics
- County
- Madison County · 380,832 people
- City population
- 220,435
- Metro
- Huntsville, AL
- Population (ZIP)
- 29,161
- Household income
- $86,768
- Rent vs Own
- Severe rent burden
- 1249.0
Population outlook (Madison County) Hauer SSP2
- Today (2025)
- 392,086 people
- By 2030
- 409,788 · +4.5%
- By 2040
- 440,557 · +12.4%
- By 2050
- 460,990 · +17.6%
- By 2075
- 502,872 · +28.3%
- By 2100
- 513,623 · +31.0%
Race, ethnicity, and origin ACS 2023
- Neighborhood character
- Diverse neighborhood (Simpson 0.57)
- Race & ethnicity
- White 58% Black 30% Hispanic / Latino 5% Two or more races 5% Asian 4%
- Hispanic origin (detail)
- Mexican 2% Puerto Rican 2%
- Common ancestry
- Slovak 2% Italian 2% Serbian 2%
- Foreign-born
- 7% · Canada, Vietnam, China
- Languages at home
- 93% English-only · Spanish 2% Other Indo-European 1% Other Asian/Pacific 1%
Political lean MEDSL · Madison
- 2024 margin
- Lean R (+9.0) · D 44.7% · R 53.7% · Other 1.6%
- 2008→2024 swing
- +6.0pp toward D · 2008: -14.9pp · 2024: -9.0pp
- All cycles
- 2024: R+9.0 2020: R+8.0 2016: R+16.8 2012: R+18.7 2008: R+14.9
Not yet ingested
- Civics
- —
Market trends
- HPI YoY
- ▲ 71.67%
- Current HPI
- 430.5866
- Rent YoY
- ▲ 2.57%
- Metro
- Huntsville, AL
- State GDP YoY
- ▲ 2.94%
- F500 in state
- 4
Industry mix (Fortune 500 HQ in AL)
| Industry | F500 HQs | Revenue |
|---|---|---|
| Financial Services | 1 | $8B |
|
||
| Healthcare | 1 | $5B |
|
||
Price history
+100.0% since first listed9 events — show timeline
- 2026-06-08 Listed $325,000 VMLS
- 2026-05-18 Sold (Public Records) $327,900 Public Records
- 2019-10-08 Sold (Public Records) $200,000 Public Records
- 2019-10-04 Sold (MLS) $200,000 VMLS
- 2019-09-18 Pending — VMLS
- 2019-09-11 Listed $195,900 VMLS
- 2016-05-18 Sold (Public Records) $162,000 Public Records
- 2016-05-17 Sold (MLS) $162,000 VMLS
- 2015-10-08 Listed $162,500 VMLS
Property tax history
+13.1%/yrLatest (2024): $1,878 · +3.0% YoY. Source: county tax records.
Cash-flow waterfall
monthlySold comps — $/sqft
last 12 mo · ≤1 miLoading sold comps…