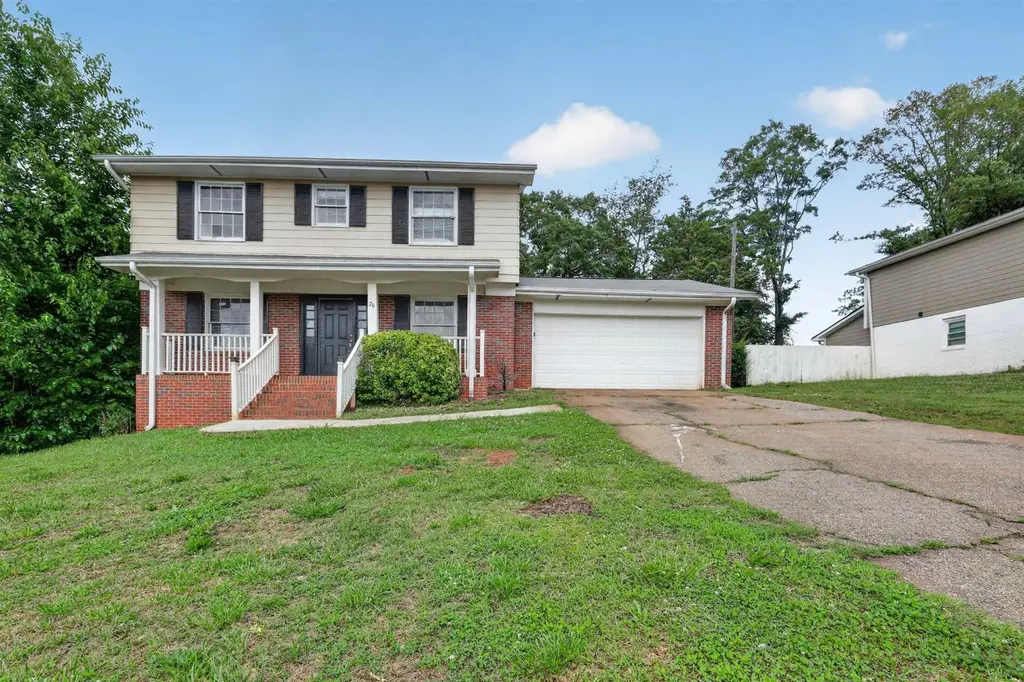
26 Willowood Dr · Valley Falls, SC
Flood risk 1/10 · Minimal
- FEMA flood zone
- X (unshaded)
- Chance of flooding over 30 yrs
- 0.0%
- Est. flood insurance / yr
- $507 – $1,088
Fire risk 3/10 · Minor
- Est. fire insurance / yr
- $783 – $1,453
Heat risk 6/10 · Moderate
- Hot days now (above 104°F)
- 7 days/yr
- Hot days in 30 yrs
- 17 days/yr
Wind risk 2/10 · Minimal
- Chance of severe wind over 30 yrs
- 1.0%
Air-quality risk 4/10 · Minor
- Unhealthy air days now
- 4 days/yr
- Unhealthy air days in 30 yrs
- 4 days/yr
Risk factors via First Street. Map © Google.
Why this score? — see what drove the D+ grade
The composite is a weighted blend of 9 inputs, each scored 0–100. Each bar is that input's sub-score; the figure is the points it added to the 100-point composite (weight × sub-score).
- ARV discount +15.0/15.0
- Cash flow +12.8/30.0
- Schools +4.5/10.0
- 1% rule +3.8/10.0
- DSCR +3.8/10.0
- Livability +3.5/5.0
- Rent growth +3.4/5.0
- Condition / age +2.5/5.0
- Appreciation +0.0/10.0
$204,900
🖨 Deal sheet (PDF) 📄 Offer letter ✓ Due diligence
Listing remarks MLS
Great oportunity to improve on this home. 3 Bedroom 2 Ba home in desirable district 2 schools. Needs a little TLC to shine. 4th bedroom was removed to make walk in closet and laundry room. Perfect home for someone looking to make a house into their dream home.
Key facts
- Quick access to i-26
- Fenced backyard
- Quick access to i-85
Tags
Property features AI
Exterior
- Parking: Attached paved garage with 2 spaces
- Utilities: Public water; Public sewer
- Home design: Single family residence; Two stories
- Construction: Brick veneer and vinyl siding; Composition roof
- Exterior features: Wooded lot
Interior
- Kitchen: Dishwasher; Refrigerator; Electric range
- Flooring: Carpet; Laminate
- Bathrooms: 2 full bathrooms
- Heating & cooling: Natural gas heating with forced air; Central air conditioning
- Interior features: Gas water heater; Dishwasher; Refrigerator; Electric range
Neighborhood map
What this means for you Summary
Snapshot
- This is a 4-bed/2.0-bath single-family listed at $205k.
Deal economics
- At list price, monthly cash flow is $-18 ($-213/yr) — negative.
- To cash-flow at today's rent, offer at most $202k (1.5% below list).
- To meet the 1% rule (rent ≥ 1% of price), the offer needs to be $180k (12.4% below list).
- Recommended offer: $180k (12.4% below list) — sets the bar for 1% rule.
- Cap rate 6.2% vs local median 3.9% in Valley Falls — top-decile yield for the area; either an underpriced asset or a hidden risk that comps aren't pricing in. Stress-test before assuming the spread holds.
Location & tenants
- Location reads 69/100 on livability (#72 in SC) — a middle-class / working-renter tenant base. Strengths: cost of living A+, housing A-; Watch: crime C-, amenities F, employment D-.
- Spartanburg 02 (suburban): math 49% / reading 56% proficiency, ranked #6 of 80 in SC (top 8%) — acceptable for families but not a draw, mixed tenant base, ~2y average lease.
- Zoned schools: James H. Hendrix Elementary (math 55% / reading 45%, grade D+, #163 of 597 statewide, top 28%, 694 students, 89% FRL); Boiling Springs Middle (math 39% / reading 50%, grade D, #52 of 229 statewide, top 23%, 1,068 students, 70% FRL); Boiling Springs High (math 62% / reading 88%, grade A-, #37 of 196 statewide, top 18%, 2,671 students, 60% FRL) — zoned schools average 73% FRL vs 44% district-wide (28 pts higher); higher-poverty schools than district average — tighter screening recommended.
- Market conditions: Rents rising (+3.7%/yr); 378 active listings in the ZIP; 3,129 units permitted in Spartanburg County in 2024 (40 in 5+ unit buildings).
- This rent runs 45% of the median local income ($48k/yr) — at the standard rent-burdened threshold; future hikes will face affordability resistance.
Forward outlook
- Local home prices are declining (-3.0%/yr); year-one equity from $1k of loan paydown is wiped out by about $6k of value loss. Plan a longer hold.
- Spartanburg County population projected at +18% by 2050 — long-run rental-demand tailwind backs the buy-and-hold thesis.
Negotiation context
- It's been on market 20 days — a 2% lower offer ($202k) is reasonable based on typical stale-listing flexibility.
- 6 sale attempts since 8y ago with the ask held roughly flat each time — persistent listings suggest the price (not the market) is what's stuck; bring a comps-based counter.
- Current owner paid $85k; list at $205k implies a 141% gain — meaningful room to come down on a strong offer.
Risks & watch-outs
- Climate carrying-cost: extreme-heat days projected 7→17/yr by 2055 (HVAC capex compounding) — expect insurance premiums to compound above CPI over the hold.
Questions for the listing agent
- What do current leases actually rent for vs. the listed asking? Can we see a recent rent roll and the last 12 months of T-12 income?
- Built in 1974 — when were the roof, HVAC, electrical panel, plumbing, and water heater last replaced?
- Is there a deadline driving the sale (1031 exchange, divorce, estate, relocation)? That informs how much negotiation room exists.
- Schools are F-rated, which usually means shorter tenancies and higher turnover. Who's the typical renter profile here, and what's been the actual vacancy rate?
- The area grade is low — what's the realistic commute time and amenity access for the typical tenant pool here? Any planned neighborhood developments (good or bad) we should know about?
- What's the average days-on-market for RENTAL listings here right now (not sales)? A rising rental-DOM trend means longer vacancies and softer asking-rent achievability than the comps imply.
- What's the recent tenant-quality profile in this submarket — average credit score on applications, eviction rate, late-payment / NSF rate, and stable-employment percentage? A property-management company in the area should have these aggregated.
- How much new for-sale + rental construction is in the pipeline within 1–3 miles? Heavy new supply typically softens prices + rents 12–24 months out; constrained supply supports both.
Investment metrics
- 1% rule
- 0.88% ✗
- Cap rate
- 6.19%
- Cash-on-cash
- -0.37%
- DSCR
- 0.98
- GRM
- 9.5
CMA / ARV
- ARV (on-the-fly)
- $267,902
- Comps found
- 12
Show comp detail 12 sales within ~0.75 mi
| Address | Dist | Beds/Ba | Sqft | Sold | Price | $/sf | Match |
|---|---|---|---|---|---|---|---|
| 3 Mcdowell Dr | 0.30mi | 3/2.0 (-1) | 1,800 (+0%) | 15mo | $187,500 | $104 | 69 |
| 2 Willowood Dr | 0.17mi | 4/2.0 | 1,605 (-11%) | 11mo | $255,000 | $159 | 65 |
| 2028 Haven Ct | 0.45mi | 3/2.0 (-1) | 1,772 (-1%) | 11mo | $248,000 | $140 | 62 |
| 14 Willow Run Ter | 0.07mi | 3/2.0 (-1) | 1,569 (-13%) | 23mo | $129,900 | $83 | 52 |
| 223 Rachel Evans Dr | 0.46mi | 3/2.0 (-1) | 1,750 (-3%) | 22mo | $269,900 | $154 | 51 |
| 625 Parkway Village Rd | 0.19mi | 3/2.5 (-1) | 1,562 (-13%) | 15mo | $240,000 | $154 | 50 |
| 2018 Evergreen Dr | 0.48mi | 3/2.0 (-1) | 1,714 (-5%) | 18mo | $264,300 | $154 | 50 |
| 534 Hemlock Dr | 0.53mi | 4/2.5 | 1,955 (+9%) | 18mo | $283,000 | $145 | 44 |
| 120 Woodshire Dr | 0.74mi | 4/2.5 | 1,998 (+11%) | 4mo | $185,000 | $93 | 42 |
| 725 Tinder Box Ct | 0.58mi | 3/2.0 (-1) | 2,005 (+12%) | 15mo | $255,000 | $127 | 36 |
| 519 Hemlock Dr | 0.70mi | 4/3.0 | 1,900 (+6%) | 22mo | $283,500 | $149 | 35 |
| 104 Phillips Cir | 0.68mi | 3/2.0 (-1) | 1,596 (-11%) | 16mo | $249,000 | $156 | 31 |
Match score weights: distance 35% · size 25% · config 20% · recency 20%. Top-matched comps best support the ARV.
Projected returns pro-forma
-3.0% appreciation · 3.69% rent growth · sell at horizon
- IRR
- -16.1%
- Equity multiple
- 0.42×
- Total profit
- $-33,040
- Equity at exit
- $30,551
- IRR
- -6.6%
- Equity multiple
- 0.57×
- Total profit
- $-24,847
- Equity at exit
- $17,716
Cash invested: $57,372 (down + closing). Projections, not guarantees.
Landlord ↔ Tenant lean methodology
- Overall (STATE)
- 90 Strongly Landlord-Friendly
- State South Carolina
- 90 Strongly Landlord-Friendly · R+6
- County
- — inherits STATE
- City
- — inherits STATE
ZIP-level market 29303
- Home prices YoY
- -14.1%
- Rents YoY
- 3.7%
- Active inventory
- 378
- Price-to-rent
- 9.5×
Monthly cashflow live
- Estimated rent
- $1,795 medium interval (Pro) →
- Mortgage (P&I)
- −$1,075
- Tax from tax record
- −$276 /mo · $3,312/yr
- Insurance
- −$85
- HOA
- −$0
- Vacancy / Maint / Mgmt
- −$377
- Net cashflow
- $-18
Break-even live
Sensitivity live
| Price | -10% $98 | -5% $40 | +0% $-18 | +5% $-76 | +10% $-134 |
|---|---|---|---|---|---|
| Rent | -10% $-160 | -5% $-89 | +0% $-18 | +5% $53 | +10% $124 |
| Rate | -1.0pp $85 | -0.5pp $34 | base $-18 | +0.5pp $-71 | +1.0pp $-125 |
UW: 25.0% down · 7.5% · 30yr · 1.5% tax · 5.0% vac · 8.0% maint · 8.0% mgmt
Financing live
Cash to close
- Down payment
- $51,225
- Closing costs
- $6,147
- Reserves months
- —
- Total cash needed
- —
Loan-product check · same deal, 3 products live
Conventional
25% down · 7.5% · 30yr
- Down + closing
- —
- Monthly P&I
- —
- Monthly cashflow
- —
- DSCR
- —
- Eligible?
- —
Personal DTI + credit; lowest rate.
DSCR
20% down · 8.5% · 30yr
- Down + closing
- —
- Monthly P&I
- —
- Monthly cashflow
- —
- DSCR
- —
- Eligible?
- —
No personal income docs; deal must DSCR.
Hard money
10% down · 12.0% · 12mo
- Down + closing
- —
- Monthly P&I
- —
- Monthly cashflow
- —
- DSCR
- —
- Eligible?
- —
Short-term bridge; refi at stabilization.
Listing history 14 events
-
2026-06-21days on market $204,900 Active 20 DOM
-
2026-06-18days on market $204,900 Active 17 DOM
-
2026-06-17days on market $204,900 Active 16 DOM
-
2026-06-16days on market $204,900 Active 15 DOM
-
2026-06-15days on market $204,900 Active 14 DOM
-
2026-06-14days on market $204,900 Active 12 DOM
-
2026-06-13days on market $204,900 Active 11 DOM
-
2026-06-10days on market $204,900 Active 9 DOM
-
2026-06-09days on market $204,900 Active 8 DOM
-
2026-06-08days on market $204,900 Active 7 DOM
-
2026-06-07days on market $204,900 Active 6 DOM
-
2026-06-05days on market $204,900 Active 3 DOM
-
2026-06-01remarks 699-char remark
-
2026-06-01$204,900 Active 1 DOM
ⓘ Source: listings_history table (triggers on properties + properties_extension) + one-shot
backfill from property_details.listing_events for pre-trigger history.
Tax reassessment forecast SC · Resets to sale price
- Current annual tax
- $3,312 · $276/mo
- Projected year-2 tax
- $3,312 · $276/mo
- Expected delta
- $0/yr ($0/mo · 0.0%)
ⓘ Screening estimate from a state-policy table — verify with the county assessor before closing.
Climate risk First Street
- Flood 1/10 Low FEMA zone X (unshaded) · 0% chance over 30 yrs
- Wildfire 3/10 Moderate
- Heat 6/10 Major 7 d/yr ≥104°F today · 17 d/yr by 30 yrs out
- Wind 2/10 Low 100% chance of damaging wind over 30 yrs
- Air quality 4/10 Moderate 4 unhealthy d/yr today · 4 by 30 yrs out
Nearby sold comps map
Loading sold comps map…
Walkable amenities ~0.75 mi
Loading nearby amenities…
Taxation est. · year 1
- Rental income
- $21,542
- − Mortgage interest
- −$11,478
- − Property taxes
- −$3,312
- − Insurance
- −$1,024
- − Repairs & maintenance
- −$1,723
- − Management
- −$1,723
- − Depreciation
- −$5,961
- Taxable loss
- −$3,680
- Est. tax savings @ 24.0%
- +$883
- After-tax cash flow
- $670/yr
For passive investors: Depreciation is non-cash, so a rental often shows a tax loss while cash-flowing — sheltering income. Rental losses are passive: they offset passive income freely, and up to $25,000/yr can offset ordinary (W-2) income if you actively participate and your MAGI is under $100k (phasing out to $0 by $150k); unused losses carry forward. On sale, claimed depreciation is recaptured at up to 25%, and gains may owe capital-gains tax (a 1031 exchange can defer both). Figures are a year-1 estimate at your 24.0% rate — not tax advice; consult a CPA.
Schools (NCES district)
- District
- Spartanburg 02
- NCES district ID
- 4503510
- Math proficiency
- 49% ▼ -7.00%
- Reading proficiency
- 56% ▲ 2.00%
- Median HH income
- $49,591
- Composite
- 44.79/100
- National rank
- #2742
- State rank
- #6 of 80 in SC
Livability — Valley Falls
- Score
- 69/100
- State rank
- #72
- US rank
- #8644
Category grades
Schools grade is shown separately in the Schools card above.
Census & demographics
- County
- Spartanburg County · 258,607 people
- City population
- 28,009
- Metro
- Spartanburg, SC
- Population (ZIP)
- 28,381
- Household income
- $48,295
- Rent vs Own
- Severe rent burden
- 1218.0
Population outlook (Spartanburg County) Hauer SSP2
- Today (2025)
- 325,495 people
- By 2030
- 338,800 · +4.1%
- By 2040
- 363,471 · +11.7%
- By 2050
- 384,156 · +18.0%
- By 2075
- 430,137 · +32.1%
- By 2100
- 442,733 · +36.0%
Race, ethnicity, and origin ACS 2023
- Neighborhood character
- Diverse neighborhood (Simpson 0.67)
- Race & ethnicity
- White 42% Black 36% Hispanic / Latino 16% Two or more races 11% Asian 2%
- Hispanic origin (detail)
- Mexican 10% Puerto Rican 2%
- Common ancestry
- Slovak 2% Italian 1% Subsaharan African 1%
- Foreign-born
- 11% · Canada
- Languages at home
- 81% English-only · Spanish 15% Russian/Polish/Slavic 2% Other Asian/Pacific 1%
Political lean MEDSL · Spartanburg
- 2024 margin
- Solid R (+33.6) · D 32.6% · R 66.2% · Other 1.2%
- 2008→2024 swing
- -12.0pp toward R · 2008: -21.6pp · 2024: -33.6pp
- All cycles
- 2024: R+33.6 2020: R+27.3 2016: R+30.0 2012: R+23.1 2008: R+21.6
Not yet ingested
- Civics
- —
Market trends
- HPI YoY
- ▼ -45.19%
- Current HPI
- 274.443
- Rent YoY
- ▲ 3.69%
- Metro
- Spartanburg, SC
- State GDP YoY
- ▲ 4.51%
- F500 in state
- 2
Industry mix (Fortune 500 HQ in SC)
| Industry | F500 HQs | Revenue |
|---|---|---|
| Packaging | 1 | $7B |
|
||
Price history
+279.4% since first listed15 events — show timeline
- 2026-05-29 Listed $204,900 SPMLS
- 2026-05-29 Listed $204,900 SPMLS
- 2018-06-15 Sold (Public Records) $85,000 Public Records
- 2018-06-13 Sold (MLS) $85,000 Greater Greenville MLS
- 2018-06-13 Sold (MLS) $85,000 SPMLS
- 2018-05-16 Pending — Greater Greenville MLS
- 2018-05-16 Contingent — SPMLS
- 2018-05-16 Relisted — Greater Greenville MLS
- 2018-05-16 Relisted — SPMLS
- 2018-05-10 Pending — Greater Greenville MLS
- 2018-05-10 Contingent — SPMLS
- 2018-05-08 Price Changed $90,000 Greater Greenville MLS
- 2018-05-08 Listed $90,000 SPMLS
- 2018-02-19 Listed $110,000 Greater Greenville MLS
- 1994-10-01 Sold (Public Records) $54,000 Public Records
Property tax history
+13.6%/yrLatest (2025): $3,312 · +0.6% YoY. Source: county tax records.
Cash-flow waterfall
monthlySold comps — $/sqft
last 12 mo · ≤1 miLoading sold comps…