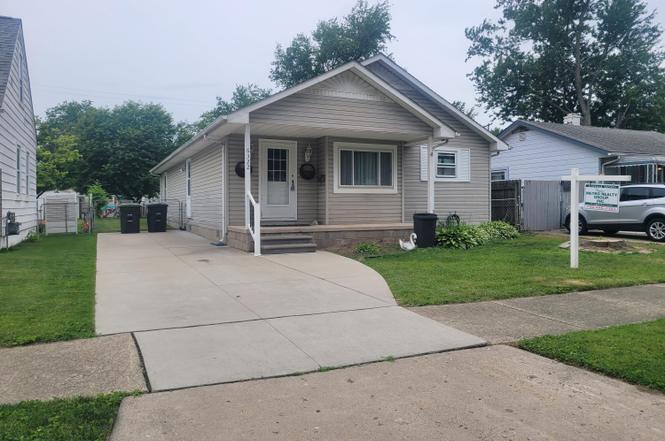
6322 Princess St · Taylor, MI
Flood risk 1/10 · Minimal
- FEMA flood zone
- X (unshaded)
- Chance of flooding over 30 yrs
- 0.0%
- Est. flood insurance / yr
- $507 – $1,088
Fire risk 1/10 · Minimal
- Est. fire insurance / yr
- $784 – $1,456
Heat risk 3/10 · Minor
- Hot days now (above 98°F)
- 7 days/yr
- Hot days in 30 yrs
- 15 days/yr
Wind risk 2/10 · Minimal
- Chance of severe wind over 30 yrs
- —
Air-quality risk 2/10 · Minimal
- Unhealthy air days now
- 1 days/yr
- Unhealthy air days in 30 yrs
- 2 days/yr
Risk factors via First Street. Map © Google.
Why this score? — see what drove the D- grade
The composite is a weighted blend of 9 inputs, each scored 0–100. Each bar is that input's sub-score; the figure is the points it added to the 100-point composite (weight × sub-score).
- Cash flow +15.0/30.0
- DSCR +4.6/10.0
- ARV discount +4.0/15.0
- 1% rule +3.8/10.0
- Livability +3.8/5.0
- Rent growth +3.7/5.0
- Condition / age +2.5/5.0
- Schools +1.8/10.0
- Appreciation +0.0/10.0
$195,500
🖨 Deal sheet 📄 Offer letter ✓ Due diligence
Listing remarks MLS
This single-family residence was built in 1992, featuring 4 bedrooms and 2 bathrooms. Large great room incorporating your kitchen, dinning and living rooms for a open design. Including vaulted ceilings with skylight windows and recesses lighting. Kitchen has plenty of real oak cabinets and lots of counter space, natural gas stove and dishwasher. New laminate and carpet flooring through out. Main bath has ceramic floors and easy accessible walk in shower. Master suite w/ half bath and door wall leading out to new wood deck. Ample backyard with 10x10 storage shed. Triple pane windows, new cement driveway and new furnace in '23. All appliances stay. City certs and CofO provided at closing.
Key facts
- Natural gas stove
- Skylight windows
- Real oak cabinets
Tags
Property features AI
Exterior
- Utilities: Public water
- Home design: Ranch-style single family residence; Built in 1992
- Construction: Vinyl siding
- Exterior features: Public water
Interior
- Kitchen: Kitchen (12 x 10) with laminate flooring
- Bedrooms: Primary bedroom (16 x 12) with laminate flooring; Bedroom 2 (12 x 12) with carpet; Bedroom 3 (12 x 10) with carpet; Bedroom 4 (10 x 8) with carpet
- Flooring: Laminate in great room, kitchen, dining area, and primary bedroom; Carpet in multiple bedrooms; Ceramic in main bathroom; Vinyl in second bathroom
- Bathrooms: 1 full bathroom; 1 half bathroom; Bathroom 1 (12 x 6) with ceramic flooring; Bathroom 2 (6 x 6) with vinyl flooring
- Heating & cooling: Forced air heating
- Interior features: Seven total rooms; Grab bars in main floor bath; Low-threshold shower; Crawl space basement
Neighborhood map
What this means for you Summary
Snapshot
- This is a 4-bed/1.5-bath single-family listed at $196k.
Deal economics
- At list price, monthly cash flow is $61 ($738/yr) — positive.
- The deal already cash-flows at list — no discount required.
- To meet the 1% rule (rent ≥ 1% of price), the offer needs to be $172k (12.2% below list).
- Recommended offer: $172k (12.2% below list) — sets the bar for 1% rule.
- Cap rate 6.7% vs local median 5.4% in Taylor — meaningfully above typical; check what's discounted (condition, days-on-market, listing class) to confirm the premium yield is real.
Location & tenants
- Location reads 76/100 on livability (#144 in MI, #3,684 nationally) — a middle-class / working-renter tenant base. Strengths: commute A+, cost of living A+, housing A+; Watch: employment D+, schools F, crime F.
- Taylor School District (urban): math 14% / reading 27% proficiency, ranked #462 of 540 in MI (top 86%) — low school quality limits family demand, transient renter base, plan for 1-2y turnover; 68% free/reduced lunch — lower-income household profile, screen leases tightly.
- Market conditions: Rents rising fast (+4.9%/yr); 281 active listings in the ZIP; 3 comparable units currently listed for rent nearby; rentals leasing fast (median 2d on market — plan ~1-2 weeks tenant-placement turnaround); 2,639 units permitted in Wayne County in 2024 (1,216 in 5+ unit buildings).
- This rent runs 34% of the median local income ($61k/yr) — at the standard rent-burdened threshold; future hikes will face affordability resistance.
Forward outlook
- Local home prices are declining (-3.0%/yr); year-one equity from $1k of loan paydown is wiped out by about $6k of value loss. Plan a longer hold.
- Wayne County population projected at -17% by 2050 — secular population decline; favor cash flow + early exit over multi-decade hold.
Negotiation context
- Only 1 days on market — expect competitive offers; lowballing is unlikely to land.
- 3 sale attempts with the ask held roughly flat each time — persistent listings suggest the price (not the market) is what's stuck; bring a comps-based counter.
Questions for the listing agent
- Is there a deadline driving the sale (1031 exchange, divorce, estate, relocation)? That informs how much negotiation room exists.
- Schools are F-rated, which usually means shorter tenancies and higher turnover. Who's the typical renter profile here, and what's been the actual vacancy rate?
- Crime grade is F in this area — have there been break-ins, vandalism, or insurance claims at this property in the last 3 years? What carrier currently insures it and at what premium?
- The area grade is low — what's the realistic commute time and amenity access for the typical tenant pool here? Any planned neighborhood developments (good or bad) we should know about?
- What's the average days-on-market for RENTAL listings here right now (not sales)? A rising rental-DOM trend means longer vacancies and softer asking-rent achievability than the comps imply.
- What's the recent tenant-quality profile in this submarket — average credit score on applications, eviction rate, late-payment / NSF rate, and stable-employment percentage? A property-management company in the area should have these aggregated.
- How much new for-sale + rental construction is in the pipeline within 1–3 miles? Heavy new supply typically softens prices + rents 12–24 months out; constrained supply supports both.
Investment metrics
- 1% rule
- 0.88% ✗
- Cap rate
- 6.67%
- Cash-on-cash
- 1.35%
- DSCR
- 1.06
- GRM
- 9.5
CMA / ARV
- ARV (on-the-fly)
- $181,356
- Comps found
- 8
Show comp detail 8 sales within ~0.75 mi
| Address | Dist | Beds/Ba | Sqft | Sold | Price | $/sf | Match |
|---|---|---|---|---|---|---|---|
| 26215 Beverly Rd | 0.40mi | 3/1.5 (-1) | 1,396 (-8%) | 3mo | $238,000 | $170 | 60 |
| 6110 Fellrath St | 0.45mi | 4/1.0 | 1,440 (-6%) | 15mo | $107,500 | $75 | 55 |
| 5943 Fellrath St | 0.53mi | 3/2.0 (-1) | 1,458 (-4%) | 14mo | $224,000 | $154 | 50 |
| 5869 Marvin St | 0.61mi | 3/1.0 (-1) | 1,450 (-5%) | 9mo | $195,000 | $134 | 49 |
| 6694 Beech Daly Rd | 0.69mi | 4/2.0 | 1,515 (-1%) | 20mo | $175,000 | $116 | 49 |
| 4924 Princess St | 0.71mi | 3/1.0 (-1) | 1,601 (+5%) | 20mo | $190,000 | $119 | 35 |
| 26145 Powers Ave | 0.73mi | 4/1.0 | 1,333 (-12%) | 17mo | $152,000 | $114 | 29 |
| 6245 Beech Daly Rd | 0.66mi | 3/1.5 (-1) | 1,302 (-15%) | 23mo | $130,000 | $100 | 21 |
Match score weights: distance 35% · size 25% · config 20% · recency 20%. Top-matched comps best support the ARV.
Projected returns pro-forma
-3.0% appreciation · 4.9% rent growth · sell at horizon
- IRR
- -12.1%
- Equity multiple
- 0.55×
- Total profit
- $-24,426
- Equity at exit
- $29,150
- IRR
- -0.5%
- Equity multiple
- 0.96×
- Total profit
- $-1,990
- Equity at exit
- $16,903
Cash invested: $54,740 (down + closing). Projections, not guarantees.
Landlord ↔ Tenant lean methodology
- Overall (STATE)
- 62 Landlord-Friendly
- State Michigan
- 62 Landlord-Friendly · EVEN
- County
- — inherits STATE
- City
- — inherits STATE
ZIP-level market 48180
- Rents YoY
- 4.9%
- Active inventory
- 281
- Price-to-rent
- 9.5×
Monthly cashflow live
- Estimated rent
- $1,717 medium interval (Pro) →
- Mortgage (P&I)
- −$1,025
- Tax from tax record
- −$189 /mo · $2,263/yr
- Insurance
- −$81
- HOA
- −$0
- Vacancy / Maint / Mgmt
- −$361
- Net cashflow
- $61
Break-even live
UW: 25.0% down · 7.5% · 30yr · 1.5% tax · 5.0% vac · 8.0% maint · 8.0% mgmt
Financing live
Cash to close
- Down payment
- $48,875
- Closing costs
- $5,865
- Reserves months
- —
- Total cash needed
- —
Loan-product check · same deal, 3 products live
Conventional
25% down · 7.5% · 30yr
- Down + closing
- —
- Monthly P&I
- —
- Monthly cashflow
- —
- DSCR
- —
- Eligible?
- —
Personal DTI + credit; lowest rate.
DSCR
20% down · 8.5% · 30yr
- Down + closing
- —
- Monthly P&I
- —
- Monthly cashflow
- —
- DSCR
- —
- Eligible?
- —
No personal income docs; deal must DSCR.
Hard money
10% down · 12.0% · 12mo
- Down + closing
- —
- Monthly P&I
- —
- Monthly cashflow
- —
- DSCR
- —
- Eligible?
- —
Short-term bridge; refi at stabilization.
Rent comps 3 comps
| Address | Beds | Baths | Sqft | Rent | $/sqft | DOM | Units | Dist |
|---|---|---|---|---|---|---|---|---|
| 26274 McDonald St Dearborn Heights, MI | 3.0 | 1.0 | 1365 | $1,575 | $1.15 | 1d | 1 | 0.88mi |
| 25699 Pennie St Dearborn Heights, MI | 3.0 | 1.0 | 1699 | $1,600 | $0.94 | 1d | 1 | 0.99mi |
| 26159 Stanford St Inkster, MI | 4.0 | 1.0 | 1056 | $1,350 | $1.28 | 5d | 1 | 1.12mi |
Listing history 2 events
-
2026-06-17remarks 696-char remark
Show marketing remark (695 chars)
This single-family residence was built in 1992, featuring 4 bedrooms and 2 bathrooms. Large great room incorporating your kitchen, dinning and living rooms for a open design. Including vaulted ceilings with skylight windows and recesses lighting. Kitchen has plenty of real oak cabinets and lots of counter space, natural gas stove and dishwasher. New laminate and carpet flooring through out. Main bath has ceramic floors and easy accessible walk in shower. Master suite w/ half bath and door wall leading out to new wood deck. Ample backyard with 10x10 storage shed. Triple pane windows, new cement driveway and new furnace in '23. All appliances stay. City certs and CofO provided at closing.
-
2026-06-17$195,500 Active 1 DOM
Show marketing remark (695 chars)
This single-family residence was built in 1992, featuring 4 bedrooms and 2 bathrooms. Large great room incorporating your kitchen, dinning and living rooms for a open design. Including vaulted ceilings with skylight windows and recesses lighting. Kitchen has plenty of real oak cabinets and lots of counter space, natural gas stove and dishwasher. New laminate and carpet flooring through out. Main bath has ceramic floors and easy accessible walk in shower. Master suite w/ half bath and door wall leading out to new wood deck. Ample backyard with 10x10 storage shed. Triple pane windows, new cement driveway and new furnace in '23. All appliances stay. City certs and CofO provided at closing.
ⓘ Source: listings_history table (triggers on properties + properties_extension) + one-shot
backfill from property_details.listing_events for pre-trigger history.
Tax reassessment forecast MI · Partial reset (capped growth)
- Current annual tax
- $2,263 · $189/mo
- Projected year-2 tax
- $2,637 · $220/mo
- Expected delta
- +$374/yr (+$31/mo · 16.5%)
ⓘ Screening estimate from a state-policy table — verify with the county assessor before closing.
Climate risk First Street
- Flood 1/10 Low FEMA zone X (unshaded) · 0% chance over 30 yrs
- Wildfire 1/10 Low
- Heat 3/10 Moderate 7 d/yr ≥98°F today · 15 d/yr by 30 yrs out
- Wind 2/10 Low
- Air quality 2/10 Low 1 unhealthy d/yr today · 2 by 30 yrs out
Nearby sold comps map
Loading sold comps map…
Walkable amenities ~0.75 mi
Loading nearby amenities…
Taxation est. · year 1
- Rental income
- $20,609
- − Mortgage interest
- −$10,951
- − Property taxes
- −$2,263
- − Insurance
- −$978
- − Repairs & maintenance
- −$1,649
- − Management
- −$1,649
- − Depreciation
- −$5,687
- Taxable loss
- −$2,567
- Est. tax savings @ 24.0%
- +$616
- After-tax cash flow
- $1,354/yr
For passive investors: Depreciation is non-cash, so a rental often shows a tax loss while cash-flowing — sheltering income. Rental losses are passive: they offset passive income freely, and up to $25,000/yr can offset ordinary (W-2) income if you actively participate and your MAGI is under $100k (phasing out to $0 by $150k); unused losses carry forward. On sale, claimed depreciation is recaptured at up to 25%, and gains may owe capital-gains tax (a 1031 exchange can defer both). Figures are a year-1 estimate at your 24.0% rate — not tax advice; consult a CPA.
Schools (NCES district)
- District
- Taylor School District
- NCES district ID
- 2633540
- Math proficiency
- 14% ▼ -7.00%
- Reading proficiency
- 27% ▼ -4.00%
- Median HH income
- $43,062
- Composite
- 17.62/100
- National rank
- #9034
- State rank
- #462 of 540 in MI
Livability — Taylor
- Score
- 76/100
- State rank
- #144
- US rank
- #3684
Category grades
Schools grade is shown separately in the Schools card above.
Census & demographics
- Census place
- Taylor, MI
- County
- Wayne County · 1,562,939 people
- City population
- 62,081
- Metro
- Detroit-Warren-Dearborn, MI
- Population (ZIP)
- 62,081
- Household income
- $61,081
- Rent vs Own
- Severe rent burden
- 1957.0
Population outlook (Wayne County) Hauer SSP2
- Today (2025)
- 1,675,273 people
- By 2030
- 1,620,300 · -3.3%
- By 2040
- 1,502,341 · -10.3%
- By 2050
- 1,384,039 · -17.4%
- By 2075
- 1,124,592 · -32.9%
- By 2100
- 881,193 · -47.4%
Race, ethnicity, and origin ACS 2023
- Neighborhood character
- Majority White (65%)
- Race & ethnicity
- White 65% Black 19% Two or more races 9% Hispanic / Latino 9% Asian 2%
- Hispanic origin (detail)
- Mexican 6% Puerto Rican 2%
- Common ancestry
- Romanian 8% Lithuanian 3% Slovak 2%
- Foreign-born
- 7% · Canada
- Languages at home
- 89% English-only · Spanish 4% Arabic 3% Other Indo-European 3%
Political lean MEDSL · Wayne
- 2024 margin
- Strong D (+29.0) · D 62.7% · R 33.7% · Other 3.6%
- 2008→2024 swing
- -20.5pp toward R · 2008: 49.5pp · 2024: 29.0pp
- All cycles
- 2024: D+29.0 2020: D+38.1 2016: D+37.3 2012: D+46.9 2008: D+49.5
Not yet ingested
- Civics
- —
Market trends
- HPI YoY
- ▼ -212.33%
- Current HPI
- 228.921
- Rent YoY
- ▲ 4.90%
- Metro
- Detroit-Warren-Dearborn, MI
- State GDP YoY
- ▲ 1.37%
- F500 in state
- 28
Industry mix (Fortune 500 HQ in MI)
| Industry | F500 HQs | Revenue |
|---|---|---|
| Automotive Parts | 3 | $48B |
|
||
| Automotive | 2 | $372B |
|
||
| Chemicals | 1 | $45B |
|
||
| Automotive Retail | 1 | $29B |
|
||
| Healthcare / Medical Devices | 1 | $23B |
|
||
| Automotive Technology | 1 | $20B |
|
||
Price history
+0.0% since first listed3 events — show timeline
- 2026-06-17 Listed $195,500 REALCOMP
- 2026-06-17 Listed $195,500 MiRealSource-MiMLS
- 2026-06-17 Listed $195,500 SW Michigan MLS
Property tax history
+1.4%/yrLatest (2025): $2,263 · +2.8% YoY. Source: county tax records.
Cash-flow waterfall
monthlySold comps — $/sqft
last 12 mo · ≤1 miLoading sold comps…