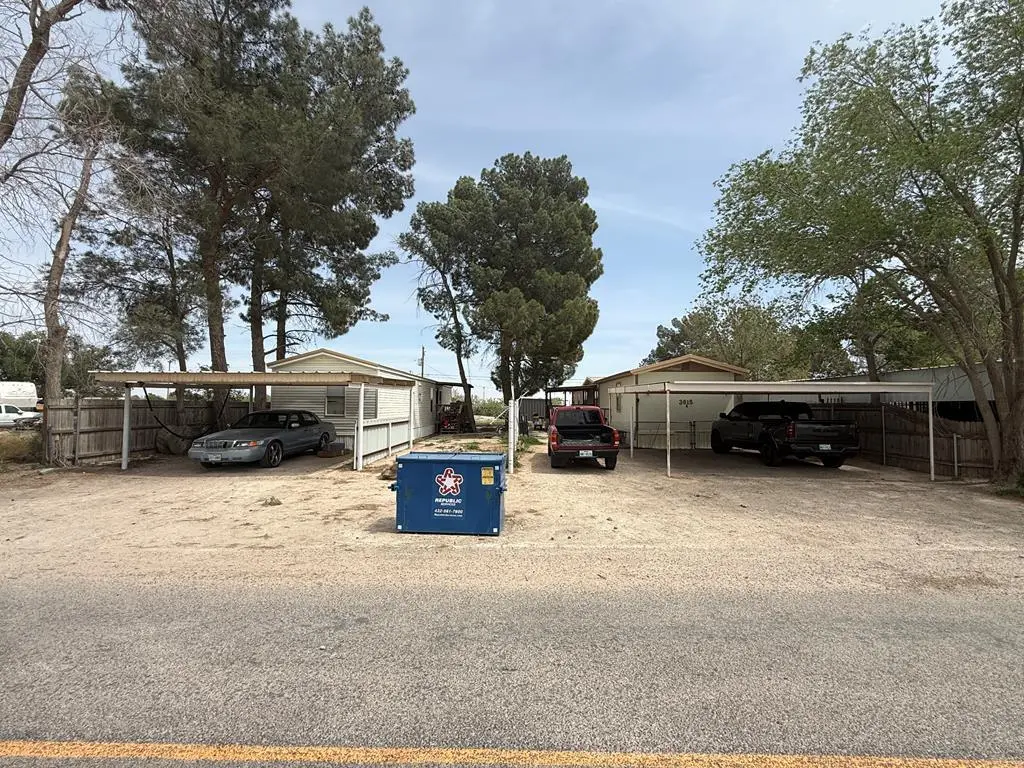
3615 S County Rd 1311 · Odessa, TX
Flood risk 1/10 · Minimal
- FEMA flood zone
- X
- Chance of flooding over 30 yrs
- 0.0%
- Est. flood insurance / yr
- $507 – $1,088
Fire risk 8/10 · Major
- Est. fire insurance / yr
- $1,222 – $2,270
Heat risk 6/10 · Moderate
- Hot days now (above 101°F)
- 7 days/yr
- Hot days in 30 yrs
- 21 days/yr
Wind risk 2/10 · Minimal
- Chance of severe wind over 30 yrs
- 3.0%
Air-quality risk 1/10 · Minimal
- Unhealthy air days now
- 0 days/yr
- Unhealthy air days in 30 yrs
- 0 days/yr
Risk factors via First Street. Map © Google.
Why this score? — see what drove the B- grade
The composite is a weighted blend of 9 inputs, each scored 0–100. Each bar is that input's sub-score; the figure is the points it added to the 100-point composite (weight × sub-score).
- Cash flow +28.4/30.0
- DSCR +10.0/10.0
- 1% rule +7.9/10.0
- ARV discount +7.5/15.0
- Livability +3.8/5.0
- Schools +3.2/10.0
- Rent growth +2.6/5.0
- Condition / age +2.5/5.0
- Appreciation +0.0/10.0
$210,000
🖨 Deal sheet 📄 Offer letter ✓ Due diligence
Listing remarks MLS
Versatile investment opportunity featuring two well-maintained mobile homes! One unit offers 3 bedrooms and 2 baths with recent upgrades including fully renovated bathrooms, updated flooring, and a newer water heater. The second home features 3 bedrooms and 1 bath, also in great condition. Both are move-in ready. Ideal for rental income or owner-occupy one and lease the other. Conveniently located off Faudree Rd near shopping, dining, and entertainment—outside city limits for added flexibility.
Key facts
- 0.26 acre lot
- 4 parking spots
- Built 1982
Neighborhood map
What this means for you Summary
Snapshot
- This is a 6-bed/3.0-bath manufactured listed at $210k.
Deal economics
- At list price, monthly cash flow is $682 ($8k/yr) — positive.
- The deal already cash-flows at list — no discount required.
- Meets the 1% rule at list price ($3k rent vs $210k).
- Recommended offer: $197k (6.0% below list) — sets the bar for market timing.
Location & tenants
- Location reads 75/100 on livability (#132 in TX, #3,928 nationally) — a middle-class / working-renter tenant base. Strengths: cost of living A+, housing A+, health & safety A+; Watch: commute D+, amenities D, schools F.
- Midland ISD (urban): math 34% / reading 36% proficiency, ranked #477 of 826 in TX (top 58%) — families likely to look elsewhere, expect single-tenant / working-renter base with shorter leases.
- Market conditions: Rents flat; 431 active listings in the ZIP; solid renter incomes; 1,504 units permitted in Midland County in 2024 (0 in 5+ unit buildings).
- This rent runs 31% of the median local income ($105k/yr) — at the standard rent-burdened threshold; future hikes will face affordability resistance.
Forward outlook
- Local home prices are declining (-3.0%/yr); year-one equity from $1k of loan paydown is wiped out by about $6k of value loss. Plan a longer hold.
- Midland County population projected at +83% by 2050 — long-run rental-demand tailwind backs the buy-and-hold thesis.
Negotiation context
- It's been on market 63 days — a 6% lower offer ($197k) is reasonable based on typical stale-listing flexibility.
- 2 sale attempts since 2y ago with the ask held roughly flat each time — persistent listings suggest the price (not the market) is what's stuck; bring a comps-based counter.
Risks & watch-outs
- Climate carrying-cost: severe wildfire risk; extreme-heat days projected 7→21/yr by 2055 (HVAC capex compounding) — expect insurance premiums to compound above CPI over the hold.
Questions for the listing agent
- It's been on market 63 days. Have you received any prior offers? Is the seller open to a 6% concession, seller financing, or rate buy-down credit?
- Why hasn't it sold? Are there any deal-killer items the seller is aware of (foundation, flood, title, zoning, code violations)?
- Is there a deadline driving the sale (1031 exchange, divorce, estate, relocation)? That informs how much negotiation room exists.
- Schools are F-rated, which usually means shorter tenancies and higher turnover. Who's the typical renter profile here, and what's been the actual vacancy rate?
- What's the average days-on-market for RENTAL listings here right now (not sales)? A rising rental-DOM trend means longer vacancies and softer asking-rent achievability than the comps imply.
- What's the recent tenant-quality profile in this submarket — average credit score on applications, eviction rate, late-payment / NSF rate, and stable-employment percentage? A property-management company in the area should have these aggregated.
- How much new for-sale + rental construction is in the pipeline within 1–3 miles? Heavy new supply typically softens prices + rents 12–24 months out; constrained supply supports both.
Investment metrics
- 1% rule
- 1.29% ✓
- Cap rate
- 10.19%
- Cash-on-cash
- 13.92%
- DSCR
- 1.62
- GRM
- 6.5
CMA / ARV
No comps found within radius.
Projected returns pro-forma
-3.0% appreciation · 0.54% rent growth · sell at horizon
- IRR
- 1.3%
- Equity multiple
- 1.05×
- Total profit
- $2,926
- Equity at exit
- $31,312
- IRR
- 8.3%
- Equity multiple
- 1.56×
- Total profit
- $33,165
- Equity at exit
- $18,157
Cash invested: $58,800 (down + closing). Projections, not guarantees.
Landlord ↔ Tenant lean methodology
- Overall (STATE)
- 87 Strongly Landlord-Friendly
- State Texas
- 87 Strongly Landlord-Friendly · R+5
- County
- — inherits STATE
- City
- — inherits STATE
ZIP-level market 79765
- Home prices YoY
- -28.7%
- Rents YoY
- 0.5%
- Active inventory
- 431
- Price-to-rent
- 6.5×
Monthly cashflow live
- Estimated rent
- $2,700 medium interval (Pro) →
- Mortgage (P&I)
- −$1,101
- Tax est. 1.5%
- −$262 /mo · $3,150/yr
- Insurance
- −$88
- HOA
- −$0
- Vacancy / Maint / Mgmt
- −$567
- Net cashflow
- $682
Break-even live
UW: 25.0% down · 7.5% · 30yr · 1.5% tax · 5.0% vac · 8.0% maint · 8.0% mgmt
Financing live
Cash to close
- Down payment
- $52,500
- Closing costs
- $6,300
- Reserves months
- —
- Total cash needed
- —
Loan-product check · same deal, 3 products live
Conventional
25% down · 7.5% · 30yr
- Down + closing
- —
- Monthly P&I
- —
- Monthly cashflow
- —
- DSCR
- —
- Eligible?
- —
Personal DTI + credit; lowest rate.
DSCR
20% down · 8.5% · 30yr
- Down + closing
- —
- Monthly P&I
- —
- Monthly cashflow
- —
- DSCR
- —
- Eligible?
- —
No personal income docs; deal must DSCR.
Hard money
10% down · 12.0% · 12mo
- Down + closing
- —
- Monthly P&I
- —
- Monthly cashflow
- —
- DSCR
- —
- Eligible?
- —
Short-term bridge; refi at stabilization.
Listing history 22 events
-
2026-06-19days on market $210,000 Active 63 DOM
-
2026-06-18days on market $210,000 Active 62 DOM
-
2026-06-17days on market $210,000 Active 61 DOM
-
2026-06-16days on market $210,000 Active 60 DOM
-
2026-06-15days on market $210,000 Active 59 DOM
-
2026-06-14days on market $210,000 Active 57 DOM
-
2026-06-13days on market $210,000 Active 56 DOM
-
2026-06-10days on market $210,000 Active 54 DOM
-
2026-06-09days on market $210,000 Active 53 DOM
-
2026-06-08days on market $210,000 Active 52 DOM
-
2026-06-07days on market $210,000 Active 51 DOM
-
2026-06-03days on market $210,000 Active 47 DOM
-
2026-06-02days on market $210,000 Active 46 DOM
-
2026-06-01days on market $210,000 Active 45 DOM
-
2026-05-31days on market $210,000 Active 44 DOM
-
2026-05-30days on market $210,000 Active 43 DOM
-
2026-04-18$210,000 Active 505-char remark
Show marketing remark (505 chars)
Versatile investment opportunity featuring two well-maintained mobile homes! One unit offers 3 bedrooms and 2 baths with recent upgrades including fully renovated bathrooms, updated flooring, and a newer water heater. The second home features 3 bedrooms and 1 bath, also in great condition. Both are move-in ready. Ideal for rental income or owner-occupy one and lease the other. Conveniently located off Faudree Rd near shopping, dining, and entertainment—outside city limits for added flexibility.
-
2025-03-13soldstatus
-
2025-02-07soldstatus
-
2024-11-27$155,000 Active
-
2024-07-23price $169,000
-
1996-03-12soldstatus
ⓘ Source: listings_history table (triggers on properties + properties_extension) + one-shot
backfill from property_details.listing_events for pre-trigger history.
Climate risk First Street
- Flood 1/10 Low FEMA zone X · 0% chance over 30 yrs
- Wildfire 8/10 Severe
- Heat 6/10 Major 7 d/yr ≥101°F today · 21 d/yr by 30 yrs out
- Wind 2/10 Low 3% chance of damaging wind over 30 yrs
- Air quality 1/10 Low 0 unhealthy d/yr today · 0 by 30 yrs out
Nearby sold comps map
Loading sold comps map…
Walkable amenities ~0.75 mi
Loading nearby amenities…
Taxation est. · year 1
- Rental income
- $32,404
- − Mortgage interest
- −$11,763
- − Property taxes
- −$3,150
- − Insurance
- −$1,050
- − Repairs & maintenance
- −$2,592
- − Management
- −$2,592
- − Depreciation
- −$6,109
- Taxable income
- $5,147
- Est. tax owed @ 24.0%
- −$1,235
- After-tax cash flow
- $6,949/yr
For passive investors: Depreciation is non-cash, so a rental often shows a tax loss while cash-flowing — sheltering income. Rental losses are passive: they offset passive income freely, and up to $25,000/yr can offset ordinary (W-2) income if you actively participate and your MAGI is under $100k (phasing out to $0 by $150k); unused losses carry forward. On sale, claimed depreciation is recaptured at up to 25%, and gains may owe capital-gains tax (a 1031 exchange can defer both). Figures are a year-1 estimate at your 24.0% rate — not tax advice; consult a CPA.
Schools (NCES district)
- District
- Midland ISD
- NCES district ID
- 4830570
- Math proficiency
- 34% ▼ -7.00%
- Reading proficiency
- 36% ▬ 0.00%
- Median HH income
- $63,457
- Composite
- 31.63/100
- National rank
- #5938
- State rank
- #477 of 826 in TX
Livability — Odessa
- Score
- 75/100
- State rank
- #132
- US rank
- #3928
Category grades
Schools grade is shown separately in the Schools card above.
Census & demographics
- County
- Ector County · 131,169 people
- City population
- 131,169
- Metro
- Odessa, TX
- Population (ZIP)
- 25,904
- Household income
- $104,965
- Rent vs Own
- Severe rent burden
- 884.0
Population outlook (Midland County) Hauer SSP2
- Today (2025)
- 220,895 people
- By 2030
- 253,667 · +14.8%
- By 2040
- 325,498 · +47.4%
- By 2050
- 404,168 · +83.0%
- By 2075
- 609,802 · +176.1%
- By 2100
- 760,172 · +244.1%
Race, ethnicity, and origin ACS 2023
- Neighborhood character
- Diverse neighborhood (Simpson 0.59)
- Race & ethnicity
- Hispanic / Latino 49% White 41% Two or more races 15% Black 5% Asian 3% Native American 1%
- Hispanic origin (detail)
- Mexican 45%
- Common ancestry
- Romanian 1% Slovak 1% Lithuanian 1%
- Foreign-born
- 10% · Canada, China, South Korea
- Languages at home
- 63% English-only · Spanish 31% German/W. Germanic 1% Tagalog/Filipino 1%
Political lean MEDSL · Midland
- 2024 margin
- Solid R (+60.5) · D 19.3% · R 79.8%
- 2008→2024 swing
- -3.3pp toward R · 2008: -57.3pp · 2024: -60.5pp
- All cycles
- 2024: R+60.5 2020: R+56.6 2016: R+55.2 2012: R+61.5 2008: R+57.3
Not yet ingested
- Civics
- —
Market trends
- HPI YoY
- ▼ -69.68%
- Current HPI
- 173.4252
- Rent YoY
- ▲ 0.54%
- Metro
- Odessa, TX
- State GDP YoY
- ▲ 3.95%
- F500 in state
- 110
Industry mix (Fortune 500 HQ in TX)
| Industry | F500 HQs | Revenue |
|---|---|---|
| Energy | 16 | $1,198B |
|
||
| Technology | 5 | $198B |
|
||
| Engineering / Construction | 4 | $72B |
|
||
| Energy Services | 3 | $60B |
|
||
| Utilities | 3 | $41B |
|
||
| Healthcare | 2 | $330B |
|
||
Price history
+24.3% since first listed6 events — show timeline
- 2026-04-18 Listed $210,000 ODMLS
- 2025-03-13 Sold (Public Records) — Public Records
- 2025-02-07 Sold (Public Records) — Public Records
- 2024-11-27 Listed $155,000 ODMLS
- 2024-07-23 Price Changed $169,000 ODMLS
- 1996-03-12 Sold (Public Records) — Public Records
Property tax history
-0.3%/yrLatest (2025): $353 · +2.6% YoY. Source: county tax records.
Cash-flow waterfall
monthlySold comps — $/sqft
last 12 mo · ≤1 miLoading sold comps…