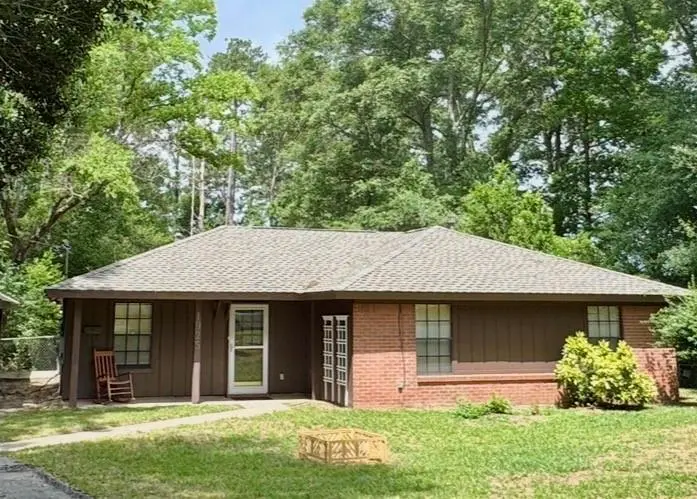
1925 Sandy Creek Dr · Semmes, AL
Flood risk 1/10 · Minimal
- FEMA flood zone
- X (unshaded)
- Chance of flooding over 30 yrs
- 0.0%
- Est. flood insurance / yr
- $507 – $1,088
Fire risk 5/10 · Moderate
- Est. fire insurance / yr
- $916 – $1,700
Heat risk 9/10 · Severe
- Hot days now (above 106°F)
- 7 days/yr
- Hot days in 30 yrs
- 20 days/yr
Wind risk 9/10 · Severe
- Chance of severe wind over 30 yrs
- 99.0%
Air-quality risk 1/10 · Minimal
- Unhealthy air days now
- 0 days/yr
- Unhealthy air days in 30 yrs
- 0 days/yr
Risk factors via First Street. Map © Google.
Why this score? — see what drove the C+ grade
The composite is a weighted blend of 9 inputs, each scored 0–100. Each bar is that input's sub-score; the figure is the points it added to the 100-point composite (weight × sub-score).
- Cash flow +23.6/30.0
- ARV discount +15.0/15.0
- DSCR +7.6/10.0
- 1% rule +4.9/10.0
- Livability +3.0/5.0
- Rent growth +2.5/5.0
- Condition / age +2.5/5.0
- Schools +2.3/10.0
- Appreciation +0.0/10.0
$179,000
🖨 Deal sheet (PDF) 📄 Offer letter ✓ Due diligence
Listing remarks
Endless possibilities await in Semmes! This 3-bedroom, 2-bath brick home offers 1,364 square feet of living space on a peaceful property designed for enjoying the outdoors. Major improvements have already been completed, including a new roof, HVAC system, and water heater in 2021, giving you a solid foundation while leaving room to add your own cosmetic updates and flooring choices. The home's practical layout features an eat-in kitchen and an indoor laundry room conveniently located off the carport. The primary bedroom features an ensuite bathroom and a walk-in closet. A spacious deck and patio overlook the large, private backyard, creating the perfect setting for morning coffee, weekend g
Key facts
- Water heater
- Eat-in kitchen
- Indoor laundry room
Tags
Property features AI
Exterior
- Parking: Carport (2 spaces)
- Utilities: Cable available; Electricity available (110V and 220V); Natural gas available; Water available; Sewer: public/other
- Home design: Residential single family home; Located in the Ponderosa subdivision
- Construction: Brick 4 sides construction; Built in 1980; Slab foundation; Shingle roof
- Exterior features: Other exterior features; Back yard fence; Greenhouse; Guest house; Other outbuildings; No pool or spa; Property has a view
Interior
- Kitchen: Dishwasher; Double Oven; Gas Range; Refrigerator
- Bedrooms: 3 bedrooms
- Flooring: Other flooring
- Bathrooms: 2 full bathrooms
- Heating & cooling: Central heating; Central air conditioning
- Interior features: Other interior features; Eat-in kitchen
- Laundry & utility: Washer; Dryer; Gas water heater
Neighborhood map
What this means for you Summary
Snapshot
- This is a 3-bed/2.0-bath single-family listed at $179k.
Deal economics
- At list price, monthly cash flow is $338 ($4k/yr) — positive.
- The deal already cash-flows at list — no discount required.
- To meet the 1% rule (rent ≥ 1% of price), the offer needs to be $178k (0.7% below list).
- Recommended offer: $176k (1.5% below list) — sets the bar for market timing.
- Cap rate 8.6% vs local median 5.3% in Semmes — top-decile yield for the area; either an underpriced asset or a hidden risk that comps aren't pricing in. Stress-test before assuming the spread holds.
Location & tenants
- Location reads 60/100 on livability (#311 in AL) — a middle-class / working-renter tenant base. Strengths: cost of living A+, housing A+; Watch: crime F, amenities F, commute F.
- Mobile County (urban): math 15% / reading 39% proficiency, ranked #81 of 129 in AL (top 63%) — low school quality limits family demand, transient renter base, plan for 1-2y turnover; 67% free/reduced lunch — lower-income household profile, screen leases tightly.
- Zoned schools: Allentown Elementary School (math 31% / reading 59%, grade D-, #169 of 627 statewide, top 27%, 776 students, 53% FRL); Semmes Middle School (math 8% / reading 35%, grade F, #185 of 257 statewide, top 73%, 1,318 students, 68% FRL); Mary G Montgomery High School (math 13% / reading 18%, grade F, #211 of 305 statewide, top 69%, 1,965 students, 53% FRL).
- Market conditions: 185 active listings in the ZIP; 1,678 units permitted in Mobile County in 2024 (264 in 5+ unit buildings).
Forward outlook
- Local home prices are declining (-3.0%/yr); year-one equity from $1k of loan paydown is wiped out by about $5k of value loss. Plan a longer hold.
- Mobile County population projected to shrink 8% by 2050 — rents likely to lag national; underwrite the cash flow, not the appreciation.
Negotiation context
- It's been on market 27 days — a 2% lower offer ($176k) is reasonable based on typical stale-listing flexibility.
Risks & watch-outs
- Climate carrying-cost: severe wind risk, 99% chance of damaging wind over 30y; moderate wildfire risk; extreme-heat days projected 7→20/yr by 2055 (HVAC capex compounding) — expect insurance premiums to compound above CPI over the hold.
Questions for the listing agent
- Is there a deadline driving the sale (1031 exchange, divorce, estate, relocation)? That informs how much negotiation room exists.
- Schools are D-rated, which usually means shorter tenancies and higher turnover. Who's the typical renter profile here, and what's been the actual vacancy rate?
- Crime grade is F in this area — have there been break-ins, vandalism, or insurance claims at this property in the last 3 years? What carrier currently insures it and at what premium?
- What's the average days-on-market for RENTAL listings here right now (not sales)? A rising rental-DOM trend means longer vacancies and softer asking-rent achievability than the comps imply.
- What's the recent tenant-quality profile in this submarket — average credit score on applications, eviction rate, late-payment / NSF rate, and stable-employment percentage? A property-management company in the area should have these aggregated.
- How much new for-sale + rental construction is in the pipeline within 1–3 miles? Heavy new supply typically softens prices + rents 12–24 months out; constrained supply supports both.
Investment metrics
- 1% rule
- 0.99% ✗
- Cap rate
- 8.56%
- Cash-on-cash
- 8.09%
- DSCR
- 1.36
- GRM
- 8.4
CMA / ARV
- ARV (on-the-fly)
- $215,512
- Comps found
- 12
Show comp detail 12 sales within ~0.75 mi
| Address | Dist | Beds/Ba | Sqft | Sold | Price | $/sf | Match |
|---|---|---|---|---|---|---|---|
| 1837 Sandy Creek Dr | 0.12mi | 3/2.0 | 1,313 (-4%) | 0mo | $227,500 | $173 | 88 |
| 1850 Wagon Wheel Dr | 0.30mi | 3/2.0 | 1,370 (+0%) | 3mo | $210,000 | $153 | 83 |
| 9380 Sagebrush Ct | 0.28mi | 3/2.0 | 1,419 (+4%) | 0mo | $167,500 | $118 | 80 |
| 1779 Ranch House Dr | 0.25mi | 3/2.0 | 1,325 (-3%) | 6mo | $225,000 | $170 | 79 |
| 1820 Wagon Wheel Dr | 0.34mi | 3/2.0 | 1,341 (-2%) | 3mo | $190,000 | $142 | 79 |
| 1835 Corral Dr | 0.14mi | 3/2.0 | 1,219 (-11%) | 2mo | $205,000 | $168 | 74 |
| 9365 Chisholm Ct | 0.36mi | 3/2.0 | 1,452 (+6%) | 1mo | $220,000 | $152 | 72 |
| 9143 Prairie Dr | 0.41mi | 3/2.0 | 1,422 (+4%) | 5mo | $190,000 | $134 | 69 |
| 1679 Wagon Wheel Dr | 0.47mi | 3/2.0 | 1,227 (-10%) | 2mo | $195,000 | $159 | 60 |
| 2070 Sky Vista Dr W | 0.56mi | 3/2.0 | 1,487 (+9%) | 1mo | $185,000 | $124 | 58 |
| 9395 Settlers Cir | 0.56mi | 3/2.0 | 1,468 (+8%) | 4mo | $232,000 | $158 | 58 |
| 9736 Sky Vista Dr | 0.57mi | 3/2.0 | 1,528 (+12%) | 0mo | $259,000 | $170 | 53 |
Match score weights: distance 35% · size 25% · config 20% · recency 20%. Top-matched comps best support the ARV.
Projected returns pro-forma
-3.0% appreciation · 3.0% rent growth · sell at horizon
- IRR
- -4.0%
- Equity multiple
- 0.85×
- Total profit
- $-7,571
- Equity at exit
- $26,689
- IRR
- 5.6%
- Equity multiple
- 1.41×
- Total profit
- $20,793
- Equity at exit
- $15,477
Cash invested: $50,120 (down + closing). Projections, not guarantees.
Landlord ↔ Tenant lean methodology
- Overall (STATE)
- 90 Strongly Landlord-Friendly
- State Alabama
- 90 Strongly Landlord-Friendly · R+15
- County
- — inherits STATE
- City
- — inherits STATE
ZIP-level market 36575
- Home prices YoY
- -21.8%
- Active inventory
- 185
- Price-to-rent
- 8.4×
Monthly cashflow live
- Estimated rent
- $1,778 medium interval (Pro) →
- Mortgage (P&I)
- −$939
- Tax from tax record
- −$54 /mo · $644/yr
- Insurance
- −$75
- HOA
- −$0
- Vacancy / Maint / Mgmt
- −$373
- Net cashflow
- $338
Break-even live
Sensitivity live
| Price | -10% $439 | -5% $388 | +0% $338 | +5% $287 | +10% $236 |
|---|---|---|---|---|---|
| Rent | -10% $197 | -5% $268 | +0% $338 | +5% $408 | +10% $478 |
| Rate | -1.0pp $428 | -0.5pp $383 | base $338 | +0.5pp $291 | +1.0pp $244 |
UW: 25.0% down · 7.5% · 30yr · 1.5% tax · 5.0% vac · 8.0% maint · 8.0% mgmt
Financing live
Cash to close
- Down payment
- $44,750
- Closing costs
- $5,370
- Reserves months
- —
- Total cash needed
- —
Loan-product check · same deal, 3 products live
Conventional
25% down · 7.5% · 30yr
- Down + closing
- —
- Monthly P&I
- —
- Monthly cashflow
- —
- DSCR
- —
- Eligible?
- —
Personal DTI + credit; lowest rate.
DSCR
20% down · 8.5% · 30yr
- Down + closing
- —
- Monthly P&I
- —
- Monthly cashflow
- —
- DSCR
- —
- Eligible?
- —
No personal income docs; deal must DSCR.
Hard money
10% down · 12.0% · 12mo
- Down + closing
- —
- Monthly P&I
- —
- Monthly cashflow
- —
- DSCR
- —
- Eligible?
- —
Short-term bridge; refi at stabilization.
Listing history 17 events
-
2026-06-17status $179,000 Pending 27 DOM
-
2026-06-17days on market $179,000 Active 27 DOM
-
2026-06-16days on market $179,000 Active 26 DOM
-
2026-06-15days on market $179,000 Active 25 DOM
-
2026-06-14days on market $179,000 Active 23 DOM
-
2026-06-13days on market $179,000 Active 22 DOM
-
2026-06-10days on market $179,000 Active 20 DOM
-
2026-06-09days on market $179,000 Active 19 DOM
-
2026-06-08days on market $179,000 Active 18 DOM
-
2026-06-07days on market $179,000 Active 17 DOM
-
2026-06-05days on market $179,000 Active 14 DOM
-
2026-06-03days on market $179,000 Active 13 DOM
-
2026-06-02days on market $179,000 Active 12 DOM
-
2026-06-01days on market $179,000 Active 11 DOM
-
2026-05-31days on market $179,000 Active 10 DOM
-
2026-05-30days on market $179,000 Active 9 DOM
-
2026-05-21$179,000 Active
ⓘ Source: listings_history table (triggers on properties + properties_extension) + one-shot
backfill from property_details.listing_events for pre-trigger history.
Tax reassessment forecast AL · Resets to sale price
- Current annual tax
- $644 · $54/mo
- Projected year-2 tax
- $734 · $61/mo
- Expected delta
- +$90/yr (+$7/mo · 13.9%)
ⓘ Screening estimate from a state-policy table — verify with the county assessor before closing.
Climate risk First Street
- Flood 1/10 Low FEMA zone X (unshaded) · 0% chance over 30 yrs
- Wildfire 5/10 Major
- Heat 9/10 Extreme 7 d/yr ≥106°F today · 20 d/yr by 30 yrs out
- Wind 9/10 Extreme 99% chance of damaging wind over 30 yrs
- Air quality 1/10 Low 0 unhealthy d/yr today · 0 by 30 yrs out
Nearby sold comps map
Loading sold comps map…
Walkable amenities ~0.75 mi
Loading nearby amenities…
Taxation est. · year 1
- Rental income
- $21,338
- − Mortgage interest
- −$10,027
- − Property taxes
- −$644
- − Insurance
- −$895
- − Repairs & maintenance
- −$1,707
- − Management
- −$1,707
- − Depreciation
- −$5,207
- Taxable income
- $1,150
- Est. tax owed @ 24.0%
- −$276
- After-tax cash flow
- $3,777/yr
For passive investors: Depreciation is non-cash, so a rental often shows a tax loss while cash-flowing — sheltering income. Rental losses are passive: they offset passive income freely, and up to $25,000/yr can offset ordinary (W-2) income if you actively participate and your MAGI is under $100k (phasing out to $0 by $150k); unused losses carry forward. On sale, claimed depreciation is recaptured at up to 25%, and gains may owe capital-gains tax (a 1031 exchange can defer both). Figures are a year-1 estimate at your 24.0% rate — not tax advice; consult a CPA.
Schools (NCES district)
- District
- Mobile County
- NCES district ID
- 0102370
- Math proficiency
- 15% ▼ -28.00%
- Reading proficiency
- 39% ▬ 0.00%
- Median HH income
- $42,455
- Composite
- 22.9/100
- National rank
- #8002
- State rank
- #81 of 129 in AL
Livability — Semmes
- Score
- 60/100
- State rank
- #311
- US rank
- #19360
Category grades
Schools grade is shown separately in the Schools card above.
Census & demographics
- Population (ZIP)
- 22,444
Population outlook (Mobile County) Hauer SSP2
- Today (2025)
- 415,303 people
- By 2030
- 411,755 · -0.9%
- By 2040
- 399,670 · -3.8%
- By 2050
- 382,616 · -7.9%
- By 2075
- 337,353 · -18.8%
- By 2100
- 283,391 · -31.8%
Race, ethnicity, and origin ACS 2023
- Neighborhood character
- Predominantly White (73%)
- Race & ethnicity
- White 73% Black 19% Hispanic / Latino 5% Two or more races 3%
- Common ancestry
- Lithuanian 2% Slovak 2% Serbian 2%
- Foreign-born
- 2% · Canada, Vietnam
- Languages at home
- 97% English-only · Spanish 2% Vietnamese 1%
Political lean MEDSL · Mobile
- 2024 margin
- R (+16.4) · D 41.3% · R 57.7%
- 2008→2024 swing
- -7.7pp toward R · 2008: -8.7pp · 2024: -16.4pp
- All cycles
- 2024: R+16.4 2020: R+11.9 2016: R+13.9 2012: R+9.3 2008: R+8.7
Not yet ingested
- Civics
- —
Market trends
- HPI YoY
- ▼ -60.58%
- Current HPI
- 217.5112
- Rent YoY
- —
- Metro
- —
- State GDP YoY
- ▲ 2.94%
- F500 in state
- 4
Industry mix (Fortune 500 HQ in AL)
| Industry | F500 HQs | Revenue |
|---|---|---|
| Financial Services | 1 | $8B |
|
||
| Healthcare | 1 | $5B |
|
||
Price history
2 events — show timeline
- 2026-06-17 Pending — GCMLS AL
- 2026-05-21 Listed $179,000 GCMLS AL
Cash-flow waterfall
monthlySold comps — $/sqft
last 12 mo · ≤1 miLoading sold comps…