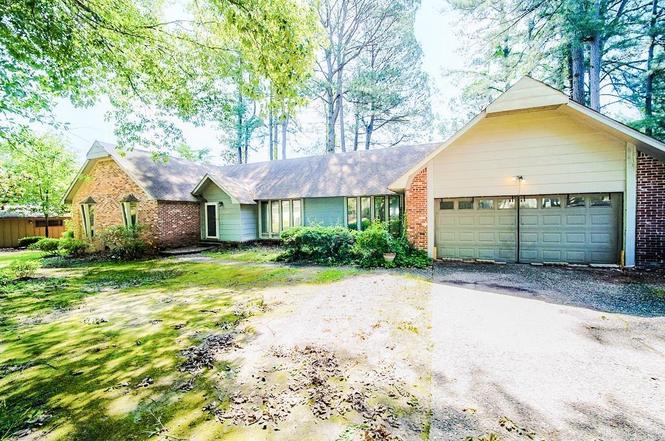
2810 W Gray Fox Ln · Jacksonville, AR
Flood risk 1/10 · Minimal
- FEMA flood zone
- X (unshaded)
- Chance of flooding over 30 yrs
- 0.0%
- Est. flood insurance / yr
- $507 – $1,088
Fire risk 3/10 · Minor
- Est. fire insurance / yr
- $1,499 – $2,785
Heat risk 6/10 · Moderate
- Hot days now (above 110°F)
- 7 days/yr
- Hot days in 30 yrs
- 18 days/yr
Wind risk 4/10 · Minor
- Chance of severe wind over 30 yrs
- 10.0%
Air-quality risk 2/10 · Minimal
- Unhealthy air days now
- 1 days/yr
- Unhealthy air days in 30 yrs
- 2 days/yr
Risk factors via First Street. Map © Google.
Why this score? — see what drove the D+ grade
The composite is a weighted blend of 9 inputs, each scored 0–100. Each bar is that input's sub-score; the figure is the points it added to the 100-point composite (weight × sub-score).
- Cash flow +15.0/30.0
- ARV discount +13.2/15.0
- DSCR +4.6/10.0
- 1% rule +3.7/10.0
- Rent growth +3.3/5.0
- Livability +3.1/5.0
- Condition / age +2.5/5.0
- Schools +1.7/10.0
- Appreciation +0.0/10.0
$199,900
🖨 Deal sheet (PDF) 📄 Offer letter ✓ Due diligence
Listing remarks MLS
GREAT FOXWOOD LOCATION! Brick & Frame, 4 Bedroom, 2.5 Bath, Home that backs to Southern Oaks golf course. Has separate Formal Living Room; Formal Dining Room; Kitchen w/ breakfast bar opens to Den/Family Room w/ wood burning Fireplace. Nice size Bedrooms; Master Bedroom has Bath w/ Dbl. sinks, walk-in shower & 2 closets. Master Bedroom & Den both have Dbl. Glass Doors that open to Huge 2 level Deck across back of house & overlook golf course. Mature shade trees and landscaping front and back.
Key facts
- Formal dining room
- Formal living room
- Golf course views
Tags
Property features AI
Finance
- Financial info: Financing options include VA, FHA, conventional, cash, or other (see remarks)
- HOA & community: Community swimming pool(s); Clubhouse; Party room; Voluntary fee; Golf course community
Exterior
- Parking: 2-car garage with automatic door opener
- Utilities: Public sewer; Public water; Municipal electric (Entergy); Cable TV; Antenna TV; Satellite TV; Private telephone; Insulated windows; Attic turbo vent
- Home design: Brick and frame exterior; Inside city limits
- Construction: Crawl space foundation; Composition roof
- Exterior features: Deck; Porch; Level lot; Located in a subdivision; Common to golf course; Golf view
Interior
- Kitchen: Microwave; Electric range
- Bedrooms: Formal living room; Den/Family room; Laundry room
- Flooring: Carpet; Vinyl; Tile
- Bathrooms: 2 full bathrooms; 1 half bathroom
- Heating & cooling: Central electric heat; Central electric cooling; Heat pump
- Interior features: Washer connection; Electric dryer connection; Ceiling fans; Wood-burning fireplace
- Laundry & utility: Washer connection; Electric dryer connection
Neighborhood map
What this means for you Summary
Snapshot
- This is a 4-bed/2.5-bath single-family listed at $200k.
Deal economics
- At list price, monthly cash flow is $62 ($739/yr) — positive.
- The deal already cash-flows at list — no discount required.
- To meet the 1% rule (rent ≥ 1% of price), the offer needs to be $174k (12.8% below list).
- Recommended offer: $174k (12.8% below list) — sets the bar for 1% rule.
- Cap rate 6.7% vs local median 5.0% in Jacksonville — top-decile yield for the area; either an underpriced asset or a hidden risk that comps aren't pricing in. Stress-test before assuming the spread holds.
Location & tenants
- Location reads 61/100 on livability (#231 in AR) — a middle-class / working-renter tenant base. Strengths: cost of living A+, housing A+, health & safety A+; Watch: schools F, crime F, amenities F.
- Jacksonville North Pulaski School District (suburban): math 18% / reading 20% proficiency, ranked #211 of 238 in AR (top 89%) — low school quality limits family demand, transient renter base, plan for 1-2y turnover; 66% free/reduced lunch — lower-income household profile, screen leases tightly.
- Market conditions: Rents rising (+3.1%/yr); 155 active listings in the ZIP; 5 comparable units currently listed for rent nearby; rentals at typical pace (median 25d on market — plan ~3-4 weeks tenant-placement turnaround); 1,006 units permitted in Pulaski County in 2024 (0 in 5+ unit buildings).
- This rent runs 38% of the median local income ($54k/yr) — at the standard rent-burdened threshold; future hikes will face affordability resistance.
Forward outlook
- Local home prices are declining (-3.0%/yr); year-one equity from $1k of loan paydown is wiped out by about $6k of value loss. Plan a longer hold.
- Pulaski County population projected at +6% by 2050 — modest demand growth; plan on rents tracking national, not racing it.
Negotiation context
- Only 9 days on market — expect competitive offers; lowballing is unlikely to land.
- 2 sale attempts since 10y ago with the ask held roughly flat each time — persistent listings suggest the price (not the market) is what's stuck; bring a comps-based counter.
- Current owner paid $125k; list at $200k implies a 60% gain — meaningful room to come down on a strong offer.
Risks & watch-outs
- Climate carrying-cost: extreme-heat days projected 7→18/yr by 2055 (HVAC capex compounding) — expect insurance premiums to compound above CPI over the hold.
Questions for the listing agent
- Built in 1973 — when were the roof, HVAC, electrical panel, plumbing, and water heater last replaced?
- Is there a deadline driving the sale (1031 exchange, divorce, estate, relocation)? That informs how much negotiation room exists.
- Schools are F-rated, which usually means shorter tenancies and higher turnover. Who's the typical renter profile here, and what's been the actual vacancy rate?
- Crime grade is F in this area — have there been break-ins, vandalism, or insurance claims at this property in the last 3 years? What carrier currently insures it and at what premium?
- The area grade is low — what's the realistic commute time and amenity access for the typical tenant pool here? Any planned neighborhood developments (good or bad) we should know about?
- What's the average days-on-market for RENTAL listings here right now (not sales)? A rising rental-DOM trend means longer vacancies and softer asking-rent achievability than the comps imply.
- What's the recent tenant-quality profile in this submarket — average credit score on applications, eviction rate, late-payment / NSF rate, and stable-employment percentage? A property-management company in the area should have these aggregated.
- How much new for-sale + rental construction is in the pipeline within 1–3 miles? Heavy new supply typically softens prices + rents 12–24 months out; constrained supply supports both.
Investment metrics
- 1% rule
- 0.87% ✗
- Cap rate
- 6.66%
- Cash-on-cash
- 1.32%
- DSCR
- 1.06
- GRM
- 9.6
CMA / ARV
- ARV (on-the-fly)
- $228,712
- Comps found
- 12
Show comp detail 12 sales within ~0.75 mi
| Address | Dist | Beds/Ba | Sqft | Sold | Price | $/sf | Match |
|---|---|---|---|---|---|---|---|
| 134 Foxdell Cir | 0.11mi | 3/2.0 (-1) | 2,066 (+2%) | 6mo | $184,000 | $89 | 79 |
| 4 Vixen Trl | 0.46mi | 3/2.0 (-1) | 2,008 (-1%) | 9mo | $225,000 | $112 | 63 |
| 715 Foxboro Dr | 0.39mi | 4/2.0 | 2,138 (+6%) | 9mo | $232,000 | $109 | 63 |
| 23 Club Rd | 0.28mi | 3/2.0 (-1) | 2,223 (+10%) | 4mo | $230,000 | $103 | 60 |
| 1 Woodhaven Ct | 0.68mi | 4/2.5 | 1,900 (-6%) | 0mo | $332,500 | $175 | 58 |
| 902 Foxwood Dr | 0.43mi | 3/2.5 (-1) | 2,162 (+7%) | 10mo | $244,000 | $113 | 55 |
| 11 Vixen Trl | 0.49mi | 3/2.0 (-1) | 1,910 (-6%) | 10mo | $215,000 | $113 | 52 |
| 108 Tecumseh Trl | 0.40mi | 3/2.0 (-1) | 1,745 (-14%) | 2mo | $145,000 | $83 | 50 |
| 1512 Puritan Dr | 0.68mi | 3/2.0 (-1) | 1,880 (-7%) | 0mo | $303,200 | $161 | 49 |
| 106 Foxrun Cv | 0.54mi | 3/2.5 (-1) | 2,281 (+13%) | 2mo | $260,000 | $114 | 47 |
| 4 Woodhaven Ct | 0.66mi | 3/2.5 (-1) | 2,140 (+6%) | 10mo | $359,900 | $168 | 46 |
| 1500 Puritan Dr | 0.71mi | 4/2.0 | 1,771 (-12%) | 2mo | $280,000 | $158 | 42 |
Match score weights: distance 35% · size 25% · config 20% · recency 20%. Top-matched comps best support the ARV.
Projected returns pro-forma
-3.0% appreciation · 3.07% rent growth · sell at horizon
- IRR
- -14.1%
- Equity multiple
- 0.49×
- Total profit
- $-28,359
- Equity at exit
- $29,806
- IRR
- -5.2%
- Equity multiple
- 0.66×
- Total profit
- $-19,193
- Equity at exit
- $17,284
Cash invested: $55,972 (down + closing). Projections, not guarantees.
Landlord ↔ Tenant lean methodology
- Overall (STATE)
- 92 Strongly Landlord-Friendly
- State Arkansas
- 92 Strongly Landlord-Friendly · R+14
- County
- — inherits STATE
- City
- — inherits STATE
ZIP-level market 72076
- Home prices YoY
- -30.3%
- Rents YoY
- 3.1%
- Active inventory
- 155
- Price-to-rent
- 9.6×
Monthly cashflow live
- Estimated rent
- $1,743 high interval (Pro) →
- Mortgage (P&I)
- −$1,048
- Tax from tax record
- −$184 /mo · $2,209/yr
- Insurance
- −$83
- HOA
- −$0
- Vacancy / Maint / Mgmt
- −$366
- Net cashflow
- $62
Break-even live
Sensitivity live
| Price | -10% $175 | -5% $118 | +0% $62 | +5% $5 | +10% $-52 |
|---|---|---|---|---|---|
| Rent | -10% $-76 | -5% $-7 | +0% $62 | +5% $130 | +10% $199 |
| Rate | -1.0pp $162 | -0.5pp $112 | base $62 | +0.5pp $10 | +1.0pp $-43 |
UW: 25.0% down · 7.5% · 30yr · 1.5% tax · 5.0% vac · 8.0% maint · 8.0% mgmt
Financing live
Cash to close
- Down payment
- $49,975
- Closing costs
- $5,997
- Reserves months
- —
- Total cash needed
- —
Loan-product check · same deal, 3 products live
Conventional
25% down · 7.5% · 30yr
- Down + closing
- —
- Monthly P&I
- —
- Monthly cashflow
- —
- DSCR
- —
- Eligible?
- —
Personal DTI + credit; lowest rate.
DSCR
20% down · 8.5% · 30yr
- Down + closing
- —
- Monthly P&I
- —
- Monthly cashflow
- —
- DSCR
- —
- Eligible?
- —
No personal income docs; deal must DSCR.
Hard money
10% down · 12.0% · 12mo
- Down + closing
- —
- Monthly P&I
- —
- Monthly cashflow
- —
- DSCR
- —
- Eligible?
- —
Short-term bridge; refi at stabilization.
Rent comps 5 comps
| Address | Beds | Baths | Sqft | Rent | $/sqft | DOM | Units | Dist |
|---|---|---|---|---|---|---|---|---|
| 2811 Fox Glenn St Jacksonville, AR | 4.0 | 2.0 | 2492 | $1,899 | $0.76 | 24d | 1 | 0.13mi |
| 2811 Fox Glenn St Jacksonville, AR | 4.0 | 2.0 | 2492 | $1,899 | $0.76 | 44d | 1 | 0.13mi |
| 104 Quapaw Pl Jacksonville, AR | 3.0 | 2.5 | 1940 | $1,575 | $0.81 | 15d | 1 | 0.26mi |
| 3000 John Harden Dr #54 Jacksonville, AR | 4.0 | 2.0 | 2280 | $1,500 | $0.66 | 24d | 1 | 0.63mi |
| 1024 Colonial Dr Jacksonville, AR | 3.0 | 2.0 | 1640 | $1,400 | $0.85 | 24d | 1 | 1.01mi |
Listing history 9 events
-
2026-06-18days on market $199,900 Active 9 DOM
-
2026-06-17days on market $199,900 Active 8 DOM
-
2026-06-16days on market $199,900 Active 7 DOM
-
2026-06-16status $199,900 Active 6 DOM
-
2026-06-15days on market $199,900 New Listing 6 DOM
-
2026-06-14days on market $199,900 New Listing 4 DOM
-
2026-06-13days on market $199,900 New Listing 3 DOM
-
2026-06-10remarks 699-char remark
-
2026-06-10$199,900 New Listing 1 DOM
ⓘ Source: listings_history table (triggers on properties + properties_extension) + one-shot
backfill from property_details.listing_events for pre-trigger history.
Tax reassessment forecast AR · Resets to sale price
- Current annual tax
- $2,209 · $184/mo
- Projected year-2 tax
- $2,209 · $184/mo
- Expected delta
- $0/yr ($0/mo · 0.0%)
ⓘ Screening estimate from a state-policy table — verify with the county assessor before closing.
Climate risk First Street
- Flood 1/10 Low FEMA zone X (unshaded) · 0% chance over 30 yrs
- Wildfire 3/10 Moderate
- Heat 6/10 Major 7 d/yr ≥110°F today · 18 d/yr by 30 yrs out
- Wind 4/10 Moderate 10% chance of damaging wind over 30 yrs
- Air quality 2/10 Low 1 unhealthy d/yr today · 2 by 30 yrs out
Nearby sold comps map
Loading sold comps map…
Walkable amenities ~0.75 mi
Loading nearby amenities…
Taxation est. · year 1
- Rental income
- $20,921
- − Mortgage interest
- −$11,198
- − Property taxes
- −$2,209
- − Insurance
- −$1,000
- − Repairs & maintenance
- −$1,674
- − Management
- −$1,674
- − Depreciation
- −$5,815
- Taxable loss
- −$2,648
- Est. tax savings @ 24.0%
- +$635
- After-tax cash flow
- $1,375/yr
For passive investors: Depreciation is non-cash, so a rental often shows a tax loss while cash-flowing — sheltering income. Rental losses are passive: they offset passive income freely, and up to $25,000/yr can offset ordinary (W-2) income if you actively participate and your MAGI is under $100k (phasing out to $0 by $150k); unused losses carry forward. On sale, claimed depreciation is recaptured at up to 25%, and gains may owe capital-gains tax (a 1031 exchange can defer both). Figures are a year-1 estimate at your 24.0% rate — not tax advice; consult a CPA.
Schools (NCES district)
- District
- Jacksonville North Pulaski School District
- NCES district ID
- 0500419
- Math proficiency
- 18% ▼ -7.00%
- Reading proficiency
- 20% ▼ -5.00%
- Median HH income
- $50,869
- Composite
- 17.16/100
- National rank
- #9110
- State rank
- #211 of 238 in AR
Livability — Jacksonville
- Score
- 61/100
- State rank
- #231
- US rank
- #17378
Category grades
Schools grade is shown separately in the Schools card above.
Census & demographics
- Census place
- Jacksonville, AR
- County
- Pulaski County · 372,764 people
- City population
- 38,437
- Metro
- Little Rock-North Little Rock-Conway, AR
- Population (ZIP)
- 38,437
- Household income
- $54,379
- Rent vs Own
- Severe rent burden
- 1733.0
Population outlook (Pulaski County) Hauer SSP2
- Today (2025)
- 415,378 people
- By 2030
- 423,720 · +2.0%
- By 2040
- 435,182 · +4.8%
- By 2050
- 440,904 · +6.1%
- By 2075
- 445,521 · +7.3%
- By 2100
- 419,173 · +0.9%
Race, ethnicity, and origin ACS 2023
- Neighborhood character
- Diverse neighborhood (Simpson 0.63)
- Race & ethnicity
- White 47% Black 38% Hispanic / Latino 8% Two or more races 8% Asian 1%
- Hispanic origin (detail)
- Mexican 6%
- Common ancestry
- Slovak 2% Italian 2% Serbian 1%
- Foreign-born
- 4% · Canada
- Languages at home
- 94% English-only · Spanish 4% Tagalog/Filipino 1%
Political lean MEDSL · Pulaski
- 2024 margin
- Strong D (+22.1) · D 59.8% · R 37.7% · Other 2.5%
- 2008→2024 swing
- +10.6pp toward D · 2008: 11.6pp · 2024: 22.1pp
- All cycles
- 2024: D+22.1 2020: D+22.5 2016: D+17.9 2012: D+11.4 2008: D+11.6
Not yet ingested
- Civics
- —
Market trends
- HPI YoY
- ▼ -87.51%
- Current HPI
- 201.6405
- Rent YoY
- ▲ 3.07%
- Metro
- Little Rock-North Little Rock-Conway, AR
- State GDP YoY
- ▲ 3.80%
- F500 in state
- 10
Industry mix (Fortune 500 HQ in AR)
| Industry | F500 HQs | Revenue |
|---|---|---|
| Retail | 1 | $681B |
|
||
| Food / Agriculture | 1 | $53B |
|
||
| Retail / Energy | 1 | $22B |
|
||
| Transportation / Logistics | 1 | $12B |
|
||
| Energy | 1 | $4B |
|
||
Price history
+42.9% since first listed6 events — show timeline
- 2026-06-09 Listed $199,900 CARMLS
- 2017-07-05 Sold (Public Records) $124,750 Public Records
- 2017-06-30 Sold (MLS) $124,750 CARMLS
- 2017-06-29 Pending — CARMLS
- 2017-05-02 Contingent — CARMLS
- 2016-10-17 Listed $139,900 CARMLS
Property tax history
+6.0%/yrLatest (2025): $2,209 · +8.3% YoY. Source: county tax records.
Cash-flow waterfall
monthlySold comps — $/sqft
last 12 mo · ≤1 miLoading sold comps…