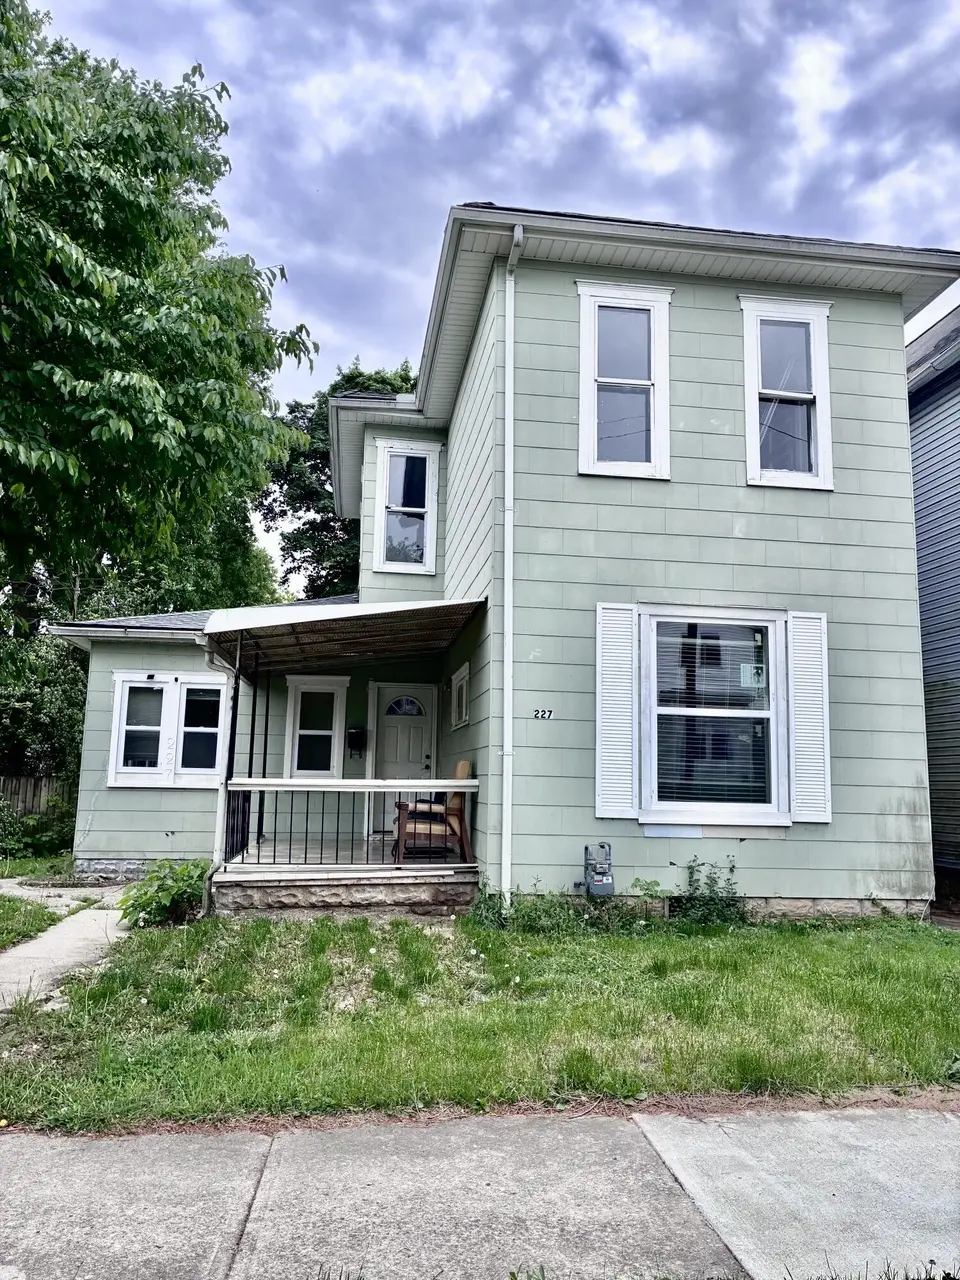
227 E Northern Ave · Springfield, OH
Flood risk 1/10 · Minimal
- FEMA flood zone
- X (unshaded)
- Chance of flooding over 30 yrs
- 0.0%
- Est. flood insurance / yr
- $473 – $860
Fire risk 1/10 · Minimal
- Est. fire insurance / yr
- $713 – $1,323
Heat risk 3/10 · Minor
- Hot days now (above 100°F)
- 7 days/yr
- Hot days in 30 yrs
- 18 days/yr
Wind risk 2/10 · Minimal
- Chance of severe wind over 30 yrs
- —
Air-quality risk 3/10 · Minor
- Unhealthy air days now
- 2 days/yr
- Unhealthy air days in 30 yrs
- 3 days/yr
Risk factors via First Street. Map © Google.
Why this score? — see what drove the B grade
The composite is a weighted blend of 9 inputs, each scored 0–100. Each bar is that input's sub-score; the figure is the points it added to the 100-point composite (weight × sub-score).
- Cash flow +27.0/30.0
- ARV discount +15.0/15.0
- 1% rule +9.6/10.0
- DSCR +9.4/10.0
- Livability +2.8/5.0
- Rent growth +2.5/5.0
- Condition / age +2.5/5.0
- Schools +1.9/10.0
- Appreciation +0.0/10.0
$119,000
🖨 Deal sheet 📄 Offer letter ✓ Due diligence
Listing remarks
Spacious and full of opportunity, this five-bedroom, two full bath home offers nearly 2,000 square feet of living space with a functional and flexible layout. The main level features three bedrooms and a full bathroom, while the upper level includes two generously sized bedrooms and an additional full bath, providing plenty of room to spread out. Major updates have already been completed, including the roof, furnace, water heater, plumbing, and electrical, giving peace of mind for years to come. The kitchen comes equipped with stainless steel appliances that convey with the sale. With its size, layout, and improvements, this home is well suited for a growing household or as a strong additio
Key facts
- Major updates
- 6,534 sq ft lot
- 2 garage spots
Tags
Property features AI
Exterior
- Parking: 2-car garage
- Security: Smoke detector(s)
- Utilities: Supplied water; Public sewer; Natural gas connected; Sewer connected
- Home design: Single family residence; Residential property
- Construction: Built in 1891; Vinyl siding; Block and stone foundation
- Exterior features: Porch; Residential lot (47 x 142)
Interior
- Kitchen: Dishwasher; Microwave; Range; Refrigerator; Electric water heater
- Bedrooms: Master Bedroom (11 x 13); Bedroom 1 (10 x 12); Bedroom 2 (10 x 10); Bedroom 3 (12 x 15); Bedroom 4 (13 x 15)
- Flooring: Laminate
- Bathrooms: 2 full bathrooms
- Heating & cooling: Forced air heating; Natural gas
- Interior features: Ceiling fan(s); Decorative fireplace; Smoke detector(s)
- Laundry & utility: Washer; Dryer
Neighborhood map
What this means for you Summary
Snapshot
- This is a 4-bed/1.0-bath single-family listed at $119k.
Deal economics
- At list price, monthly cash flow is $334 ($4k/yr) — positive.
- The deal already cash-flows at list — no discount required.
- Meets the 1% rule at list price ($2k rent vs $119k).
- Recommended offer: $115k (3.0% below list) — sets the bar for market timing.
- Cap rate 9.7% vs local median 4.8% in Springfield — top-decile yield for the area; either an underpriced asset or a hidden risk that comps aren't pricing in. Stress-test before assuming the spread holds.
Location & tenants
- Location reads 56/100 on livability (#1,108 in OH) — a working-class tenant base; expect higher turnover. Strengths: cost of living A+, housing A+; Watch: crime F, amenities F, commute F.
- Springfield City School District (urban): math 20% / reading 27% proficiency, ranked #616 of 656 in OH (top 94%) — low school quality limits family demand, transient renter base, plan for 1-2y turnover; 75% free/reduced lunch — lower-income household profile, screen leases tightly.
- Market conditions: 142 active listings in the ZIP; 8 comparable units currently listed for rent nearby; rentals leasing fast (median 11d on market — plan ~1-2 weeks tenant-placement turnaround); 232 units permitted in Clark County in 2024 (116 in 5+ unit buildings).
- This rent runs 38% of the median local income ($55k/yr) — at the standard rent-burdened threshold; future hikes will face affordability resistance.
Forward outlook
- Local home prices are declining (-3.0%/yr); year-one equity from $823 of loan paydown is wiped out by about $4k of value loss. Plan a longer hold.
- Clark County population projected at -16% by 2050 — secular population decline; favor cash flow + early exit over multi-decade hold.
- At projected returns (-3.0% appreciation + 3.0% rent growth), your $33k cash investment doubles in ~10 years — after that, you're playing with house money.
Negotiation context
- It's been on market 46 days — a 3% lower offer ($115k) is reasonable based on typical stale-listing flexibility.
- 7 sale attempts since 3y ago; this cycle's ask has dropped $20k (14%) from the opening price — seller is motivated, your offer sets the floor, not the list.
- Current owner paid $92k; 29% above their basis — modest negotiation headroom, anchor on the comps not their cost.
Risks & watch-outs
- Watch-outs: property tax is 3.7% of price; built in 1891 — expect roof / HVAC / electrical / plumbing capex.
Questions for the listing agent
- It's been on market 46 days. Have you received any prior offers? Is the seller open to a 3% concession, seller financing, or rate buy-down credit?
- Built in 1891 — when were the roof, HVAC, electrical panel, plumbing, and water heater last replaced?
- Property tax is high relative to price — has the assessment been appealed recently, and will the sale trigger a re-assessment?
- Is there a deadline driving the sale (1031 exchange, divorce, estate, relocation)? That informs how much negotiation room exists.
- Crime grade is F in this area — have there been break-ins, vandalism, or insurance claims at this property in the last 3 years? What carrier currently insures it and at what premium?
- What's the average days-on-market for RENTAL listings here right now (not sales)? A rising rental-DOM trend means longer vacancies and softer asking-rent achievability than the comps imply.
- What's the recent tenant-quality profile in this submarket — average credit score on applications, eviction rate, late-payment / NSF rate, and stable-employment percentage? A property-management company in the area should have these aggregated.
- How much new for-sale + rental construction is in the pipeline within 1–3 miles? Heavy new supply typically softens prices + rents 12–24 months out; constrained supply supports both.
Investment metrics
- 1% rule
- 1.46% ✓
- Cap rate
- 9.67%
- Cash-on-cash
- 12.05%
- DSCR
- 1.54
- GRM
- 5.7
CMA / ARV
- ARV (median comp)
- $174,561
- List price
- $119,000
- Delta
- -31.83%
- Verdict
- UNDERPRICED
- Comps
- 20 within 1.0 mi
Show comp detail 12 sales within ~0.75 mi
| Address | Dist | Beds/Ba | Sqft | Sold | Price | $/sf | Match |
|---|---|---|---|---|---|---|---|
| 307 E Northern Ave | 0.03mi | 3/1.0 (-1) | 2,043 (+5%) | 3mo | $131,000 | $64 | 83 |
| 520 E Northern Ave | 0.23mi | 4/2.0 | 1,854 (-5%) | 7mo | $75,000 | $40 | 71 |
| 1121 Elm St | 0.15mi | 4/1.0 | 1,754 (-10%) | 8mo | $187,500 | $107 | 70 |
| 614 Mason St | 0.36mi | 4/2.0 | 1,987 (+2%) | 8mo | $165,000 | $83 | 69 |
| 380 Stanton Ave | 0.31mi | 4/1.5 | 1,872 (-4%) | 12mo | $130,000 | $69 | 67 |
| 1119 Garfield Ave | 0.20mi | 3/2.0 (-1) | 2,052 (+5%) | 9mo | $220,000 | $107 | 66 |
| 315 E Madison Ave | 0.24mi | 4/2.0 | 2,116 (+8%) | 7mo | $145,000 | $69 | 65 |
| 119 E Mccreight Ave | 0.16mi | 4/2.0 | 2,216 (+14%) | 2mo | $225,000 | $102 | 64 |
| 25 Roosevelt Dr | 0.48mi | 3/1.5 (-1) | 1,928 (-1%) | 8mo | $215,000 | $112 | 62 |
| 242 Chestnut Ave | 0.38mi | 5/1.0 (+1) | 1,771 (-9%) | 3mo | $22,000 | $12 | 59 |
| 19 Ardmore Rd | 0.69mi | 3/1.5 (-1) | 2,006 (+3%) | 8mo | $271,000 | $135 | 49 |
| 1134 Cedarview Dr | 0.57mi | 3/1.0 (-1) | 1,697 (-13%) | 11mo | $149,400 | $88 | 38 |
Match score weights: distance 35% · size 25% · config 20% · recency 20%. Top-matched comps best support the ARV.
Projected returns pro-forma
-3.0% appreciation · 3.0% rent growth · sell at horizon
- IRR
- 1.7%
- Equity multiple
- 1.07×
- Total profit
- $2,177
- Equity at exit
- $17,743
- IRR
- 11.4%
- Equity multiple
- 1.90×
- Total profit
- $29,966
- Equity at exit
- $10,289
Cash invested: $33,320 (down + closing). Projections, not guarantees.
Landlord ↔ Tenant lean methodology
- Overall (STATE)
- 73 Landlord-Friendly
- State Ohio
- 73 Landlord-Friendly · R+6
- County
- — inherits STATE
- City
- — inherits STATE
ZIP-level market 45503
- Active inventory
- 142
- Price-to-rent
- 5.7×
Monthly cashflow live
- Estimated rent
- $1,735 high interval (Pro) →
- Mortgage (P&I)
- −$624
- Tax from tax record
- −$362 /mo · $4,346/yr
- Insurance
- −$50
- HOA
- −$0
- Vacancy / Maint / Mgmt
- −$364
- Net cashflow
- $334
Break-even live
UW: 25.0% down · 7.5% · 30yr · 1.5% tax · 5.0% vac · 8.0% maint · 8.0% mgmt
Financing live
Cash to close
- Down payment
- $29,750
- Closing costs
- $3,570
- Reserves months
- —
- Total cash needed
- —
Loan-product check · same deal, 3 products live
Conventional
25% down · 7.5% · 30yr
- Down + closing
- —
- Monthly P&I
- —
- Monthly cashflow
- —
- DSCR
- —
- Eligible?
- —
Personal DTI + credit; lowest rate.
DSCR
20% down · 8.5% · 30yr
- Down + closing
- —
- Monthly P&I
- —
- Monthly cashflow
- —
- DSCR
- —
- Eligible?
- —
No personal income docs; deal must DSCR.
Hard money
10% down · 12.0% · 12mo
- Down + closing
- —
- Monthly P&I
- —
- Monthly cashflow
- —
- DSCR
- —
- Eligible?
- —
Short-term bridge; refi at stabilization.
Rent comps 8 comps
| Address | Beds | Baths | Sqft | Rent | $/sqft | DOM | Units | Dist |
|---|---|---|---|---|---|---|---|---|
| 401 Section St Springfield, OH | 4.0 | 2.0 | 1612 | $1,850 | $1.15 | 11d | 1 | 0.92mi |
| 220 S Yellow Springs St Springfield, OH | 4.0 | 2.0 | 1456 | $1,645 | $1.13 | 23d | 1 | 1.29mi |
| 306 S Plum St Springfield, OH | 4.0 | 2.0 | 1352 | $1,700 | $1.26 | 44d | 1 | 1.29mi |
| 302 S Yellow Springs St Springfield, OH | 4.0 | 2.0 | 1456 | $1,845 | $1.27 | 11d | 1 | 1.34mi |
| 356 S Yellow Springs St Springfield, OH | 4.0 | 2.0 | 1606 | $1,825 | $1.14 | 11d | 1 | 1.40mi |
| 523 W Mulberry St Springfield, OH | 4.0 | 2.0 | 1456 | $1,825 | $1.25 | 11d | 1 | 1.43mi |
| 524 W Pleasant St Springfield, OH | 4.0 | 2.0 | 1456 | $1,645 | $1.13 | 11d | 1 | 1.46mi |
| 307 N Isabella St Unit 309 Springfield, OH | 3.0 | 1.5 | 1300 | $1,400 | $1.08 | 2d | 1 | 1.50mi |
Listing history 35 events
-
2026-06-19days on market $119,000 Active 46 DOM
-
2026-06-18days on market $119,000 Active 45 DOM
-
2026-06-17days on market $119,000 Active 44 DOM
-
2026-06-16days on market $119,000 Active 43 DOM
-
2026-06-15days on market $119,000 Active 42 DOM
-
2026-06-14days on market $119,000 Active 40 DOM
-
2026-06-12days on market $119,000 Active 39 DOM
-
2026-06-09days on market $119,000 Active 36 DOM
-
2026-06-08days on market $119,000 Active 35 DOM
-
2026-06-07days on market $119,000 Active 34 DOM
-
2026-06-05days on market $119,000 Active 31 DOM
-
2026-06-02days on market $119,000 Active 29 DOM
-
2026-06-01days on market $119,000 Active 28 DOM
-
2026-05-31days on market $119,000 Active 27 DOM
-
2026-05-30days on market $119,000 Active 26 DOM
-
2026-05-18status Active 730-char remark
-
2026-05-12status Pending 730-char remark
-
2026-04-28$139,000 Active 730-char remark
-
2025-12-31historical
-
2025-12-31historical
-
2025-08-27price $139,000
-
2025-08-27price $139,000
-
2025-08-07price $149,000
-
2025-08-07price $149,000
-
2025-07-14$159,000 Active
-
2025-07-14$159,000 Active
-
2023-06-17historical
-
2023-06-16historical
-
2023-06-01status Active
-
2023-05-18historical Contingency - Finance and Inspections
-
2023-05-13$120,000 Active
-
2023-05-13$120,000 Active
-
2004-01-06soldstatus $91,900
-
2003-05-08soldstatus $91,900
-
2002-08-30soldstatus $62,000
ⓘ Source: listings_history table (triggers on properties + properties_extension) + one-shot
backfill from property_details.listing_events for pre-trigger history.
Tax reassessment forecast OH · Partial reset (capped growth)
- Current annual tax
- $4,346 · $362/mo
- Projected year-2 tax
- $4,346 · $362/mo
- Expected delta
- $0/yr ($0/mo · 0.0%)
ⓘ Screening estimate from a state-policy table — verify with the county assessor before closing.
Climate risk First Street
- Flood 1/10 Low FEMA zone X (unshaded) · 0% chance over 30 yrs
- Wildfire 1/10 Low
- Heat 3/10 Moderate 7 d/yr ≥100°F today · 18 d/yr by 30 yrs out
- Wind 2/10 Low
- Air quality 3/10 Moderate 2 unhealthy d/yr today · 3 by 30 yrs out
Nearby sold comps map
Loading sold comps map…
Walkable amenities ~0.75 mi
Loading nearby amenities…
Taxation est. · year 1
- Rental income
- $20,814
- − Mortgage interest
- −$6,666
- − Property taxes
- −$4,346
- − Insurance
- −$595
- − Repairs & maintenance
- −$1,665
- − Management
- −$1,665
- − Depreciation
- −$3,462
- Taxable income
- $2,415
- Est. tax owed @ 24.0%
- −$580
- After-tax cash flow
- $3,434/yr
For passive investors: Depreciation is non-cash, so a rental often shows a tax loss while cash-flowing — sheltering income. Rental losses are passive: they offset passive income freely, and up to $25,000/yr can offset ordinary (W-2) income if you actively participate and your MAGI is under $100k (phasing out to $0 by $150k); unused losses carry forward. On sale, claimed depreciation is recaptured at up to 25%, and gains may owe capital-gains tax (a 1031 exchange can defer both). Figures are a year-1 estimate at your 24.0% rate — not tax advice; consult a CPA.
Schools (NCES district)
- District
- Springfield City School District
- NCES district ID
- 3904481
- Math proficiency
- 20% ▼ -16.00%
- Reading proficiency
- 27% ▼ -12.00%
- Median HH income
- $32,541
- Composite
- 19.12/100
- National rank
- #8834
- State rank
- #616 of 656 in OH
Livability — Springfield
- Score
- 56/100
- State rank
- #1108
- US rank
- #22551
Category grades
Schools grade is shown separately in the Schools card above.
Census & demographics
- Census place
- Springfield, OH
- County
- Clark · 134,280 people
- City population
- 33,261
- Metro
- Springfield, OH
- Population (ZIP)
- 32,673
- Household income
- $54,561
- Rent vs Own
- Severe rent burden
- 4.7
Population outlook (Clark County) Hauer SSP2
- Today (2025)
- 130,703 people
- By 2030
- 126,952 · -2.9%
- By 2040
- 118,344 · -9.5%
- By 2050
- 109,590 · -16.2%
- By 2075
- 89,464 · -31.6%
- By 2100
- 68,810 · -47.4%
Race, ethnicity, and origin ACS 2023
- Neighborhood character
- Predominantly White (84%)
- Race & ethnicity
- White 84% Black 9% Two or more races 5% Hispanic / Latino 2%
- Common ancestry
- Italian 2% Lithuanian 1% Slovak 1%
- Foreign-born
- 2% · Canada
- Languages at home
- 98% English-only · French/Haitian/Cajun 1% Spanish 1%
Political lean MEDSL · Clark
- 2024 margin
- Strong R (+29.5) · D 34.8% · R 64.3%
- 2008→2024 swing
- -27.0pp toward R · 2008: -2.5pp · 2024: -29.5pp
- All cycles
- 2024: R+29.5 2020: R+23.3 2016: R+19.5 2012: R+1.8 2008: R+2.5
Not yet ingested
- Civics
- —
Market trends
- HPI YoY
- ▼ -211.92%
- Current HPI
- 257.5694
- Rent YoY
- —
- Metro
- —
- State GDP YoY
- ▲ 1.98%
- F500 in state
- 48
Industry mix (Fortune 500 HQ in OH)
| Industry | F500 HQs | Revenue |
|---|---|---|
| Insurance | 3 | $145B |
|
||
| Industrial Machinery | 3 | $49B |
|
||
| Financial Services | 3 | $24B |
|
||
| Consumer Goods | 2 | $93B |
|
||
| Aerospace / Defense | 2 | $47B |
|
||
| Utilities | 2 | $33B |
|
||
Price history
+91.9% since first listed21 events — show timeline
- 2026-05-25 Price Changed $119,000 WRIST
- 2026-05-18 Relisted — WRIST
- 2026-05-12 Pending — WRIST
- 2026-04-28 Listed $139,000 WRIST
- 2025-12-31 Listing Removed — Dayton MLS
- 2025-12-31 Listing Removed — WRIST
- 2025-08-27 Price Changed $139,000 WRIST
- 2025-08-27 Price Changed $139,000 Dayton MLS
- 2025-08-07 Price Changed $149,000 WRIST
- 2025-08-07 Price Changed $149,000 Dayton MLS
- 2025-07-14 Listed $159,000 Dayton MLS
- 2025-07-14 Listed $159,000 WRIST
- 2023-06-17 Listing Removed — Dayton MLS
- 2023-06-16 Listing Removed — WRIST
- 2023-06-01 Relisted — WRIST
- 2023-05-18 Contingent — WRIST
- 2023-05-13 Listed $120,000 Dayton MLS
- 2023-05-13 Listed $120,000 WRIST
- 2004-01-06 Sold (Public Records) $91,900 Public Records
- 2003-05-08 Sold (Public Records) $91,900 Public Records
- 2002-08-30 Sold (Public Records) $62,000 Public Records
Property tax history
+12.1%/yrLatest (2025): $4,346 · +66.9% YoY. Source: county tax records.
Cash-flow waterfall
monthlySold comps — $/sqft
last 12 mo · ≤1 miLoading sold comps…