3237 Greendale Dr · Louisville/Jefferson County metro government (balance), KY
Flood risk 1/10 · Minimal
- FEMA flood zone
- X
- Chance of flooding over 30 yrs
- 0.0%
- Est. flood insurance / yr
- $473 – $860
Fire risk 1/10 · Minimal
- Est. fire insurance / yr
- $839 – $1,559
Heat risk 5/10 · Moderate
- Hot days now (above 104°F)
- 7 days/yr
- Hot days in 30 yrs
- 20 days/yr
Wind risk 2/10 · Minimal
- Chance of severe wind over 30 yrs
- 2.0%
Air-quality risk 3/10 · Minor
- Unhealthy air days now
- 2 days/yr
- Unhealthy air days in 30 yrs
- 3 days/yr
Risk factors via First Street. Map © Google.
Why this score? — see what drove the B- grade
The composite is a weighted blend of 9 inputs, each scored 0–100. Each bar is that input's sub-score; the figure is the points it added to the 100-point composite (weight × sub-score).
- Cash flow +30.0/30.0
- DSCR +10.0/10.0
- 1% rule +8.3/10.0
- ARV discount +7.5/15.0
- Rent growth +2.6/5.0
- Livability +2.5/5.0
- Condition / age +2.5/5.0
- Schools +2.3/10.0
- Appreciation +0.0/10.0
$110,000
🖨 Deal sheet 📄 Offer letter ✓ Due diligence
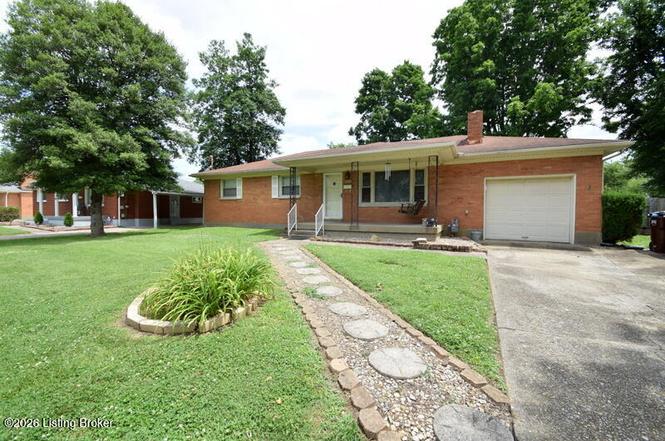
Listing remarks
Investors, Flippers , Landlords take note . This one owner home is being sold to settle an estate. Cash Offers Only. ALL Brick Home is situated on a Large . 32 Acre Lot and is need of restoration. Lots of potential to flip, or make it you next rental. Maintenance free exterior. 1 Car attached garage. Home was originally a 3 bedroom and could be again with little modification. Nice fireplace in the livingroom and Gas Log fireplace in the basement. SELLER IS SELLING AS IS AND WILL MAKE NO REPAIRS OR MODIFCATIONS . Wear a mask in the basement. Mold is present. Similar homes in the neighborhood that are renovated have sold for more than double the asking price. Opportunity Knocks! Call for a pr
Key facts
- Gas log fireplace
- Large acre lot
- 1,200 sq ft lot
Tags
Neighborhood map
What this means for you Summary
Snapshot
- This is a 2-bed/1.0-bath single-family listed at $110k.
Deal economics
- At list price, monthly cash flow is $447 ($5k/yr) — positive.
- The deal already cash-flows at list — no discount required.
- Meets the 1% rule at list price ($1k rent vs $110k).
- Cap rate 11.2% vs local median 4.0% in Louisville/Jefferson County metro government (balance) — top-decile yield for the area; either an underpriced asset or a hidden risk that comps aren't pricing in. Stress-test before assuming the spread holds.
Location & tenants
- Location reads: area grade B — affects rentability + tenant quality, not the cash-flow math above.
- Jefferson County (urban): math 19% / reading 35% proficiency, ranked #121 of 165 in KY (top 73%) — low school quality limits family demand, transient renter base, plan for 1-2y turnover.
- Market conditions: Rents flat; 204 active listings in the ZIP; 3 comparable units currently listed for rent nearby; rentals leasing fast (median 4d on market — plan ~1-2 weeks tenant-placement turnaround); 2,836 units permitted in Jefferson County in 2024 (1,558 in 5+ unit buildings).
- This rent runs 31% of the median local income ($56k/yr) — at the standard rent-burdened threshold; future hikes will face affordability resistance.
Forward outlook
- Local home prices are declining (-3.0%/yr); year-one equity from $761 of loan paydown is wiped out by about $3k of value loss. Plan a longer hold.
- Jefferson County population projected at +13% by 2050 — modest demand growth; plan on rents tracking national, not racing it.
- At projected returns (-3.0% appreciation + 0.6% rent growth), your $31k cash investment doubles in ~9 years — after that, you're playing with house money.
Negotiation context
- Only 1 days on market — expect competitive offers; lowballing is unlikely to land.
Risks & watch-outs
- Watch-outs: built in 1956 — expect roof / HVAC / electrical / plumbing capex.
- Climate carrying-cost: extreme-heat days projected 7→20/yr by 2055 (HVAC capex compounding) — expect insurance premiums to compound above CPI over the hold.
Questions for the listing agent
- Built in 1956 — when were the roof, HVAC, electrical panel, plumbing, and water heater last replaced?
- Is there a deadline driving the sale (1031 exchange, divorce, estate, relocation)? That informs how much negotiation room exists.
- What's the average days-on-market for RENTAL listings here right now (not sales)? A rising rental-DOM trend means longer vacancies and softer asking-rent achievability than the comps imply.
- What's the recent tenant-quality profile in this submarket — average credit score on applications, eviction rate, late-payment / NSF rate, and stable-employment percentage? A property-management company in the area should have these aggregated.
- How much new for-sale + rental construction is in the pipeline within 1–3 miles? Heavy new supply typically softens prices + rents 12–24 months out; constrained supply supports both.
Investment metrics
- 1% rule
- 1.33% ✓
- Cap rate
- 11.17%
- Cash-on-cash
- 17.41%
- DSCR
- 1.77
- GRM
- 6.3
CMA / ARV
- ARV (on-the-fly)
- $241,203
- Comps found
- 12
Show comp detail 12 sales within ~0.75 mi
| Address | Dist | Beds/Ba | Sqft | Sold | Price | $/sf | Match |
|---|---|---|---|---|---|---|---|
| 3219 Greendale Dr | 0.12mi | 2/2.0 | 1,850 (-6%) | 10mo | $229,000 | $124 | 73 |
| 3226 Rosewedge Way | 0.11mi | 3/2.0 (+1) | 2,115 (+8%) | 4mo | $252,000 | $119 | 69 |
| 4700 Zilma Dr | 0.37mi | 3/2.0 (+1) | 1,917 (-2%) | 2mo | $175,000 | $91 | 69 |
| 3000 Rockaway Dr | 0.31mi | 3/1.5 (+1) | 1,863 (-5%) | 8mo | $150,000 | $81 | 64 |
| 4603 Melvin Dr | 0.51mi | 3/1.0 (+1) | 1,934 (-1%) | 8mo | $237,000 | $123 | 62 |
| 3026 Bridwell Dr | 0.52mi | 2/2.0 | 2,000 (+2%) | 8mo | $250,000 | $125 | 62 |
| 2709 Melvin Ct | 0.54mi | 3/2.0 (+1) | 1,915 (-2%) | 3mo | $256,999 | $134 | 60 |
| 4416 Tara Ave | 0.46mi | 3/2.5 (+1) | 2,004 (+2%) | 9mo | $235,000 | $117 | 56 |
| 4310 Raven Ridge Dr | 0.57mi | 3/1.0 (+1) | 1,850 (-6%) | 8mo | $200,000 | $108 | 52 |
| 3603 Lenoir Ave | 0.62mi | 3/2.0 (+1) | 2,050 (+4%) | 9mo | $260,000 | $127 | 47 |
| 2570 Trubart Ln | 0.67mi | 3/2.0 (+1) | 1,700 (-13%) | 0mo | $225,000 | $132 | 37 |
| 3301 Lindenwood Dr | 0.55mi | 3/2.0 (+1) | 2,248 (+15%) | 6mo | $250,000 | $111 | 36 |
Match score weights: distance 35% · size 25% · config 20% · recency 20%. Top-matched comps best support the ARV.
Projected returns pro-forma
-3.0% appreciation · 0.57% rent growth · sell at horizon
- IRR
- 6.1%
- Equity multiple
- 1.23×
- Total profit
- $7,146
- Equity at exit
- $16,401
- IRR
- 13.3%
- Equity multiple
- 1.95×
- Total profit
- $29,223
- Equity at exit
- $9,511
Cash invested: $30,800 (down + closing). Projections, not guarantees.
Landlord ↔ Tenant lean methodology
- Overall (STATE)
- 83 Strongly Landlord-Friendly
- State Kentucky
- 83 Strongly Landlord-Friendly · R+16
- County
- — inherits STATE
- City
- — inherits STATE
ZIP-level market 40216
- Rents YoY
- 0.6%
- Active inventory
- 204
- Price-to-rent
- 6.3×
Monthly cashflow live
- Estimated rent
- $1,458 medium interval (Pro) →
- Mortgage (P&I)
- −$577
- Tax from tax record
- −$82 /mo · $983/yr
- Insurance
- −$46
- HOA
- −$0
- Vacancy / Maint / Mgmt
- −$306
- Net cashflow
- $447
Break-even live
UW: 25.0% down · 7.5% · 30yr · 1.5% tax · 5.0% vac · 8.0% maint · 8.0% mgmt
Financing live
Cash to close
- Down payment
- $27,500
- Closing costs
- $3,300
- Reserves months
- —
- Total cash needed
- —
Loan-product check · same deal, 3 products live
Conventional
25% down · 7.5% · 30yr
- Down + closing
- —
- Monthly P&I
- —
- Monthly cashflow
- —
- DSCR
- —
- Eligible?
- —
Personal DTI + credit; lowest rate.
DSCR
20% down · 8.5% · 30yr
- Down + closing
- —
- Monthly P&I
- —
- Monthly cashflow
- —
- DSCR
- —
- Eligible?
- —
No personal income docs; deal must DSCR.
Hard money
10% down · 12.0% · 12mo
- Down + closing
- —
- Monthly P&I
- —
- Monthly cashflow
- —
- DSCR
- —
- Eligible?
- —
Short-term bridge; refi at stabilization.
Rent comps 3 comps
| Address | Beds | Baths | Sqft | Rent | $/sqft | DOM | Units | Dist |
|---|---|---|---|---|---|---|---|---|
| 2304 Rockford Ln Louisville, KY | 3.0 | 1.5 | 1400 | $1,620 | $1.16 | 24d | 1 | 1.10mi |
| 2029 Lynn Lea Rd Louisville, KY | 3.0 | 2.0 | 2248 | $1,795 | $0.80 | 3d | 1 | 1.31mi |
| 5629 Fox Horn Cir Louisville, KY | 1.0–2.0 | 1.0–2.0 | 1092 | $1,145 | $1.05 | 2d | 8 | 1.44mi |
Listing history 2 events
-
2026-06-13remarks 699-char remark
-
2026-06-13$110,000 Pending 1 DOM
ⓘ Source: listings_history table (triggers on properties + properties_extension) + one-shot
backfill from property_details.listing_events for pre-trigger history.
Tax reassessment forecast KY · Resets to sale price
- Current annual tax
- $983 · $82/mo
- Projected year-2 tax
- $983 · $82/mo
- Expected delta
- $0/yr ($0/mo · 0.0%)
ⓘ Screening estimate from a state-policy table — verify with the county assessor before closing.
Climate risk First Street
- Flood 1/10 Low FEMA zone X · 0% chance over 30 yrs
- Wildfire 1/10 Low
- Heat 5/10 Major 7 d/yr ≥104°F today · 20 d/yr by 30 yrs out
- Wind 2/10 Low 2% chance of damaging wind over 30 yrs
- Air quality 3/10 Moderate 2 unhealthy d/yr today · 3 by 30 yrs out
Nearby sold comps map
Loading sold comps map…
Walkable amenities ~0.75 mi
Loading nearby amenities…
Taxation est. · year 1
- Rental income
- $17,491
- − Mortgage interest
- −$6,162
- − Property taxes
- −$983
- − Insurance
- −$550
- − Repairs & maintenance
- −$1,399
- − Management
- −$1,399
- − Depreciation
- −$3,200
- Taxable income
- $3,798
- Est. tax owed @ 24.0%
- −$911
- After-tax cash flow
- $4,451/yr
For passive investors: Depreciation is non-cash, so a rental often shows a tax loss while cash-flowing — sheltering income. Rental losses are passive: they offset passive income freely, and up to $25,000/yr can offset ordinary (W-2) income if you actively participate and your MAGI is under $100k (phasing out to $0 by $150k); unused losses carry forward. On sale, claimed depreciation is recaptured at up to 25%, and gains may owe capital-gains tax (a 1031 exchange can defer both). Figures are a year-1 estimate at your 24.0% rate — not tax advice; consult a CPA.
Schools (NCES district)
- District
- Jefferson County
- NCES district ID
- 2102990
- Math proficiency
- 19% ▼ -17.00%
- Reading proficiency
- 35% ▼ -11.00%
- Median HH income
- $47,885
- Composite
- 23.45/100
- National rank
- #7884
- State rank
- #121 of 165 in KY
Livability — Louisville/Jefferson County metro government (balance)
No livability data for this city. (Only ~50 U.S. cities are tracked.)
Census & demographics
- Census place
- Louisville/Jefferson County metro government (balance), KY
- County
- Jefferson County · 790,184 people
- City population
- 419,741
- Metro
- Louisville/Jefferson County, KY-IN
- Population (ZIP)
- 44,047
- Household income
- $56,441
- Rent vs Own
- Severe rent burden
- 1434.0
Population outlook (Jefferson County) Hauer SSP2
- Today (2025)
- 823,112 people
- By 2030
- 849,343 · +3.2%
- By 2040
- 895,696 · +8.8%
- By 2050
- 933,630 · +13.4%
- By 2075
- 1,028,262 · +24.9%
- By 2100
- 1,072,675 · +30.3%
Race, ethnicity, and origin ACS 2023
- Neighborhood character
- Diverse neighborhood (Simpson 0.60)
- Race & ethnicity
- Black 45% White 43% Hispanic / Latino 6% Two or more races 6% Asian 1%
- Hispanic origin (detail)
- Mexican 2% Cuban 3%
- Common ancestry
- Lithuanian 1% Italian 1% Slovak 1%
- Foreign-born
- 8% · Canada, Vietnam
- Languages at home
- 89% English-only · Spanish 7% French/Haitian/Cajun 1% Arabic 1%
Political lean MEDSL · Jefferson
- 2024 margin
- D (+16.6) · D 57.4% · R 40.9% · Other 1.7%
- 2008→2024 swing
- +4.5pp toward D · 2008: 12.0pp · 2024: 16.6pp
- All cycles
- 2024: D+16.6 2020: D+20.1 2016: D+13.3 2012: D+11.1 2008: D+12.0
Not yet ingested
- Civics
- —
Market trends
- HPI YoY
- ▼ -234.72%
- Current HPI
- 269.5447
- Rent YoY
- ▲ 0.57%
- Metro
- Louisville/Jefferson County, KY-IN
- State GDP YoY
- ▲ 1.81%
- F500 in state
- 4
Industry mix (Fortune 500 HQ in KY)
| Industry | F500 HQs | Revenue |
|---|---|---|
| Healthcare | 1 | $118B |
|
||
| Food / Beverage | 1 | $7B |
|
||
Price history
2 events — show timeline
- 2026-06-11 Pending — Metro Search MLS
- 2026-06-11 Listed $110,000 Metro Search MLS
Property tax history
+2.4%/yrLatest (2025): $983 · -5.1% YoY. Source: county tax records.
Cash-flow waterfall
monthlySold comps — $/sqft
last 12 mo · ≤1 miLoading sold comps…