 Multi-family
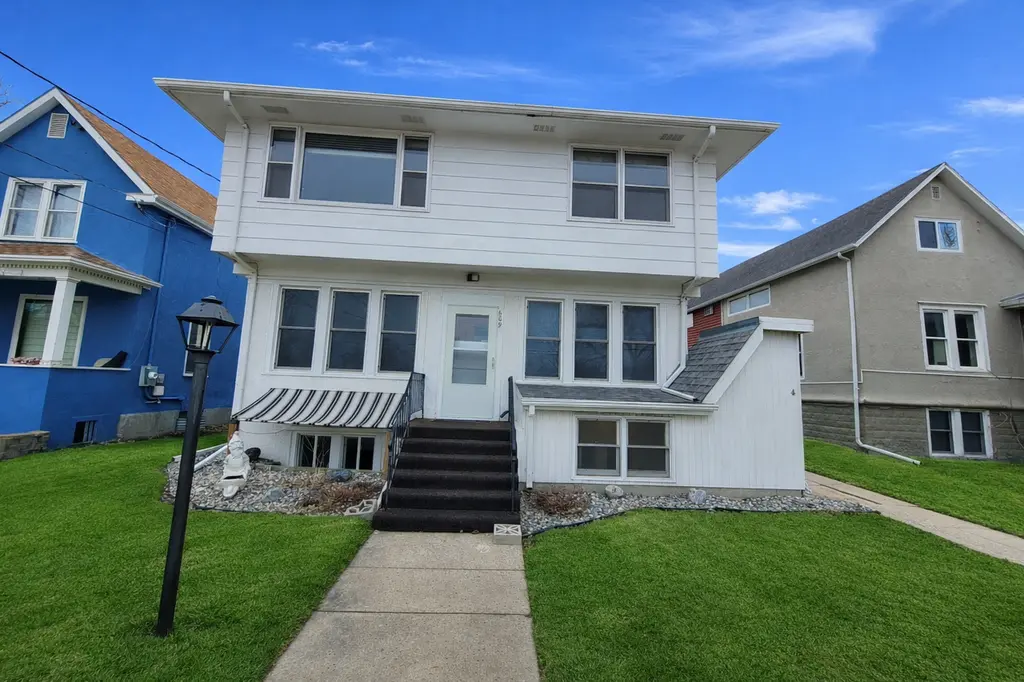
609 3rd St N · Fargo, ND
Flood risk 1/10 · Minimal
- FEMA flood zone
- X (shaded)
- Chance of flooding over 30 yrs
- 0.0%
- Est. flood insurance / yr
- $507 – $1,088
Fire risk 1/10 · Minimal
- Est. fire insurance / yr
- $1,289 – $2,393
Heat risk 2/10 · Minimal
- Hot days now (above 98°F)
- 7 days/yr
- Hot days in 30 yrs
- 12 days/yr
Wind risk 2/10 · Minimal
- Chance of severe wind over 30 yrs
- —
Air-quality risk 3/10 · Minor
- Unhealthy air days now
- 3 days/yr
- Unhealthy air days in 30 yrs
- 3 days/yr
Risk factors via First Street. Map © Google.
Why this score? — see what drove the D+ grade
The composite is a weighted blend of 9 inputs, each scored 0–100. Each bar is that input's sub-score; the figure is the points it added to the 100-point composite (weight × sub-score).
- Cash flow +18.5/30.0
- ARV discount +7.5/15.0
- DSCR +5.8/10.0
- Livability +4.2/5.0
- 1% rule +4.0/10.0
- Rent growth +3.7/5.0
- Schools +3.6/10.0
- Condition / age +2.5/5.0
- Appreciation +0.0/10.0
$284,900
🖨 Deal sheet 📄 Offer letter ✓ Due diligence
Multi-family units
County records classify this as Multi-Family (2-4 Unit). Listing-text estimate: 1 unit. estimate disagrees with records
Key facts
- Newer shingles
- Landscaped
- Extra rental income
Tags
Property features AI
Finance
- Other: Property not owner occupied
- Financial info: Property operated as multi-unit (4 total units); Gross income reported: $41,460; Net operating income reported: $33,445; Owner pays electricity and heat; Reported expenses include fuel, water/sewer, insurance, and maintenance
Exterior
- Parking: Detached/attached garage with space for 4 cars; Garage approximately 21 x 41 with 8' wide by 7' high door(s)
- Utilities: City water (in street); City sewer (in street); Natural gas; Electric service with circuit breakers and fuses
- Home design: Residential income property; Two levels
- Construction: Asphalt roof; Block foundation; Foundation dimensions approximately 29 x 39; Above-grade finished area and additional finished below-grade space
- Exterior features: Wood exterior; Lot approximately 0.16 acres (50 x 140)
Interior
- Kitchen: Range; Refrigerator
- Bedrooms: 4 total bedrooms (unit distribution across the building)
- Bathrooms: Multiple full bathrooms across units
- Heating & cooling: Boiler heating
- Interior features: Block foundation in basement; Walk-in closet
- Laundry & utility: Laundry located in basement
Neighborhood map
What this means for you Summary
Snapshot
- This is a ?-bed/4.0-bath multifamily listed at $285k.
Deal economics
- At list price, monthly cash flow is $273 ($3k/yr) — positive.
- The deal already cash-flows at list — no discount required.
- To meet the 1% rule (rent ≥ 1% of price), the offer needs to be $255k (10.4% below list).
- Recommended offer: $255k (10.4% below list) — sets the bar for 1% rule.
- Cap rate 7.4% vs local median 2.5% in Fargo — top-decile yield for the area; either an underpriced asset or a hidden risk that comps aren't pricing in. Stress-test before assuming the spread holds.
Location & tenants
- Location reads 85/100 on livability (#1 in ND, #605 nationally) — a professional / high-income tenant draw. Strengths: amenities A+, commute A+, cost of living A+; Watch: crime F.
- Fargo 1 (urban): math 41% / reading 44% proficiency, ranked #28 of 53 in ND (top 53%) — families likely to look elsewhere, expect single-tenant / working-renter base with shorter leases.
- Market conditions: Rents rising fast (+4.7%/yr); 205 active listings in the ZIP; 5 comparable units currently listed for rent nearby; rentals leasing fast (median 14d on market — plan ~1-2 weeks tenant-placement turnaround); 1,218 units permitted in Cass County in 2024 (410 in 5+ unit buildings).
- At $2,554/mo this rent would consume 51% of the median local household income ($60k/yr) (locally 1919% of renters already pay >50% of income on rent) — very limited rent-growth headroom before tenants either downsize or default.
Forward outlook
- Local home prices are declining (-3.0%/yr); year-one equity from $2k of loan paydown is wiped out by about $9k of value loss. Plan a longer hold.
- Cass County population projected at +69% by 2050 — long-run rental-demand tailwind backs the buy-and-hold thesis.
Negotiation context
- It's been on market 66 days — a 6% lower offer ($268k) is reasonable based on typical stale-listing flexibility.
- 3 sale attempts; this cycle's ask has dropped $15k (5%) from the opening price — seller is motivated, your offer sets the floor, not the list.
- Current owner paid $27k; list at $285k implies a 953% gain — meaningful room to come down on a strong offer.
Risks & watch-outs
- Watch-outs: built in 1900 — expect roof / HVAC / electrical / plumbing capex.
Questions for the listing agent
- It's been on market 66 days. Have you received any prior offers? Is the seller open to a 10% concession, seller financing, or rate buy-down credit?
- Built in 1900 — when were the roof, HVAC, electrical panel, plumbing, and water heater last replaced?
- Why hasn't it sold? Are there any deal-killer items the seller is aware of (foundation, flood, title, zoning, code violations)?
- Is there a deadline driving the sale (1031 exchange, divorce, estate, relocation)? That informs how much negotiation room exists.
- Crime grade is F in this area — have there been break-ins, vandalism, or insurance claims at this property in the last 3 years? What carrier currently insures it and at what premium?
- The area grade is low — what's the realistic commute time and amenity access for the typical tenant pool here? Any planned neighborhood developments (good or bad) we should know about?
- What's the average days-on-market for RENTAL listings here right now (not sales)? A rising rental-DOM trend means longer vacancies and softer asking-rent achievability than the comps imply.
- What's the recent tenant-quality profile in this submarket — average credit score on applications, eviction rate, late-payment / NSF rate, and stable-employment percentage? A property-management company in the area should have these aggregated.
- How much new apartment / multifamily construction is in the pipeline within 1–3 miles? Heavy new supply (>2% of stock underway) typically softens rents 12–24 months out; light construction supports rent growth.
Investment metrics
- 1% rule
- 0.90% ✗
- Cap rate
- 7.44%
- Cash-on-cash
- 4.10%
- DSCR
- 1.18
- GRM
- 9.3
CMA / ARV
No comps found within radius.
Projected returns pro-forma
-3.0% appreciation · 4.71% rent growth · sell at horizon
- IRR
- -8.2%
- Equity multiple
- 0.69×
- Total profit
- $-24,431
- Equity at exit
- $42,480
- IRR
- 3.2%
- Equity multiple
- 1.25×
- Total profit
- $19,675
- Equity at exit
- $24,633
Cash invested: $79,772 (down + closing). Projections, not guarantees.
Landlord ↔ Tenant lean methodology
- Overall (STATE)
- 82 Strongly Landlord-Friendly
- State North Dakota
- 82 Strongly Landlord-Friendly · R+20
- County
- — inherits STATE
- City
- — inherits STATE
ZIP-level market 58102
- Rents YoY
- 4.7%
- Active inventory
- 205
- Price-to-rent
- 18.6×
Monthly cashflow live
- Estimated rent
- $2,554 high interval (Pro) →
- Mortgage (P&I)
- −$1,494
- Tax from tax record
- −$132 /mo · $1,587/yr
- Insurance
- −$119
- HOA
- −$0
- Vacancy / Maint / Mgmt
- −$536
- Net cashflow
- $273
Break-even live
2-unit breakdown (identical units grouped — click to expand)
| Units | Beds | Baths | Est. rent |
|---|---|---|---|
| 2× units | 2 | 1 | $2,554 |
| #1 | 2 | 1 | $1,277 |
| #2 | 2 | 1 | $1,277 |
| Total (2 units) | $2,554 | ||
UW: 25.0% down · 7.5% · 30yr · 1.5% tax · 5.0% vac · 8.0% maint · 8.0% mgmt
Financing live
Cash to close
- Down payment
- $71,225
- Closing costs
- $8,547
- Reserves months
- —
- Total cash needed
- —
Loan-product check · same deal, 3 products live
Conventional
25% down · 7.5% · 30yr
- Down + closing
- —
- Monthly P&I
- —
- Monthly cashflow
- —
- DSCR
- —
- Eligible?
- —
Personal DTI + credit; lowest rate.
DSCR
20% down · 8.5% · 30yr
- Down + closing
- —
- Monthly P&I
- —
- Monthly cashflow
- —
- DSCR
- —
- Eligible?
- —
No personal income docs; deal must DSCR.
Hard money
10% down · 12.0% · 12mo
- Down + closing
- —
- Monthly P&I
- —
- Monthly cashflow
- —
- DSCR
- —
- Eligible?
- —
Short-term bridge; refi at stabilization.
Rent comps 5 comps
| Address | Beds | Baths | Sqft | Rent | $/sqft | DOM | Units | Dist |
|---|---|---|---|---|---|---|---|---|
| 630 1st Ave N Fargo, ND | 1.0–4.0 | 1.0–2.0 | 1098 | $1,200 | $1.09 | 13d | 6 | 0.52mi |
| 21 8th St N Fargo, ND | 4.0 | 1.0–3.0 | 949 | $1,202 | $1.27 | 13d | 6 | 0.63mi |
| 810 4th Ave S Unit 138 Moorhead, MN | 3.0 | 2.0 | 1750 | $1,325 | $0.76 | 21d | 1 | 1.11mi |
| 1900 Dakota Dr N Fargo, ND | 3.0–4.0 | 2.0–3.0 | 1324 | $1,425 | $1.08 | 13d | 7 | 1.38mi |
| 1521 1st Ave N Moorhead, MN | 1.0–3.0 | 1.0–2.0 | 1050 | $1,208 | $1.15 | 43d | 1 | 1.42mi |
Listing history 24 events
-
2026-06-18days on market $284,900 Active 66 DOM
-
2026-06-17days on market $284,900 Active 65 DOM
-
2026-06-16days on market $284,900 Active 64 DOM
-
2026-06-15days on market $284,900 Active 63 DOM
-
2026-06-14days on market $284,900 Active 61 DOM
-
2026-06-13days on market $284,900 Active 60 DOM
-
2026-06-10days on market $284,900 Active 58 DOM
-
2026-06-09days on market $284,900 Active 57 DOM
-
2026-06-08days on market $284,900 Active 56 DOM
-
2026-06-07pricedays on market $284,900 Active 55 DOM
-
2026-06-02days on market $299,900 Active 50 DOM
-
2026-06-01days on market $299,900 Active 49 DOM
-
2026-05-31days on market $299,900 Active 48 DOM
-
2026-05-30days on market $299,900 Active 47 DOM
-
2026-04-13$299,900 Active
-
2026-03-03historical
-
2025-10-31$299,900 Active
-
2025-10-10historical
-
2025-10-01price $299,900
-
2025-09-12price $309,900
-
2025-08-15price $319,900
-
2025-07-23$329,900 Active
-
2012-09-06soldstatus
-
2010-12-29soldstatus $27,063
ⓘ Source: listings_history table (triggers on properties + properties_extension) + one-shot
backfill from property_details.listing_events for pre-trigger history.
Tax reassessment forecast ND · Resets to sale price
- Current annual tax
- $1,587 · $132/mo
- Projected year-2 tax
- $2,792 · $233/mo
- Expected delta
- +$1,205/yr (+$100/mo · 75.9%)
ⓘ Screening estimate from a state-policy table — verify with the county assessor before closing.
Climate risk First Street
- Flood 1/10 Low FEMA zone X (shaded) · 0% chance over 30 yrs
- Wildfire 1/10 Low
- Heat 2/10 Low 7 d/yr ≥98°F today · 12 d/yr by 30 yrs out
- Wind 2/10 Low
- Air quality 3/10 Moderate 3 unhealthy d/yr today · 3 by 30 yrs out
Nearby sold comps map
Loading sold comps map…
Walkable amenities ~0.75 mi
Loading nearby amenities…
Taxation est. · year 1
- Rental income
- $30,648
- − Mortgage interest
- −$15,959
- − Property taxes
- −$1,587
- − Insurance
- −$1,424
- − Repairs & maintenance
- −$2,452
- − Management
- −$2,452
- − Depreciation
- −$8,288
- Taxable loss
- −$1,514
- Est. tax savings @ 24.0%
- +$363
- After-tax cash flow
- $3,635/yr
For passive investors: Depreciation is non-cash, so a rental often shows a tax loss while cash-flowing — sheltering income. Rental losses are passive: they offset passive income freely, and up to $25,000/yr can offset ordinary (W-2) income if you actively participate and your MAGI is under $100k (phasing out to $0 by $150k); unused losses carry forward. On sale, claimed depreciation is recaptured at up to 25%, and gains may owe capital-gains tax (a 1031 exchange can defer both). Figures are a year-1 estimate at your 24.0% rate — not tax advice; consult a CPA.
Schools (NCES district)
- District
- Fargo 1
- NCES district ID
- 3806780
- Math proficiency
- 41% ▼ -7.00%
- Reading proficiency
- 44% ▼ -7.00%
- Median HH income
- $46,524
- Composite
- 36.23/100
- National rank
- #4721
- State rank
- #28 of 53 in ND
Livability — Fargo
- Score
- 85/100
- State rank
- #1
- US rank
- #605
Category grades
Schools grade is shown separately in the Schools card above.
Census & demographics
- Census place
- Fargo, ND
- County
- Cass County · 177,143 people
- City population
- 130,876
- Metro
- Fargo, ND-MN
- Population (ZIP)
- 32,912
- Household income
- $59,533
- Rent vs Own
- Severe rent burden
- 1919.0
Population outlook (Cass County) Hauer SSP2
- Today (2025)
- 223,771 people
- By 2030
- 251,835 · +12.5%
- By 2040
- 311,816 · +39.3%
- By 2050
- 378,694 · +69.2%
- By 2075
- 571,386 · +155.3%
- By 2100
- 769,727 · +244.0%
Race, ethnicity, and origin ACS 2023
- Neighborhood character
- Predominantly White (84%)
- Race & ethnicity
- White 84% Hispanic / Latino 5% Two or more races 5% Black 4% Asian 3%
- Hispanic origin (detail)
- Mexican 2% Puerto Rican 2%
- Common ancestry
- Portuguese 27% Romanian 3% Scottish 2%
- Foreign-born
- 4% · Canada, China
- Languages at home
- 92% English-only · Spanish 3% Other Indo-European 2%
Political lean MEDSL · Cass
- 2024 margin
- Lean R (+8.4) · D 44.9% · R 53.3% · Other 1.9%
- 2008→2024 swing
- -15.5pp toward R · 2008: 7.1pp · 2024: -8.4pp
- All cycles
- 2024: R+8.4 2020: R+2.7 2016: R+10.7 2012: R+3.0 2008: D+7.1
Not yet ingested
- Civics
- —
Market trends
- HPI YoY
- ▼ -171.16%
- Current HPI
- 155.885
- Rent YoY
- ▲ 4.71%
- Metro
- Fargo, ND-MN
- State GDP YoY
- ▲ 2.09%
- F500 in state
- 2
Industry mix (Fortune 500 HQ in ND)
| Industry | F500 HQs | Revenue |
|---|---|---|
| Utilities / Construction | 1 | $6B |
|
||
Price history
+1008.2% since first listed10 events — show timeline
- 2026-04-13 Listed $299,900 NORTHSTARMLS as Distributed by MLS Grid
- 2026-03-03 Listing Removed — NORTHSTARMLS as Distributed by MLS Grid
- 2025-10-31 Listed $299,900 NORTHSTARMLS as Distributed by MLS Grid
- 2025-10-10 Listing Removed — NORTHSTARMLS as Distributed by MLS Grid
- 2025-10-01 Price Changed $299,900 NORTHSTARMLS as Distributed by MLS Grid
- 2025-09-12 Price Changed $309,900 NORTHSTARMLS as Distributed by MLS Grid
- 2025-08-15 Price Changed $319,900 NORTHSTARMLS as Distributed by MLS Grid
- 2025-07-23 Listed $329,900 NORTHSTARMLS as Distributed by MLS Grid
- 2012-09-06 Sold (Public Records) — Public Records
- 2010-12-29 Sold (Public Records) $27,063 Public Records
Cash-flow waterfall
monthlySold comps — $/sqft
last 12 mo · ≤1 miLoading sold comps…