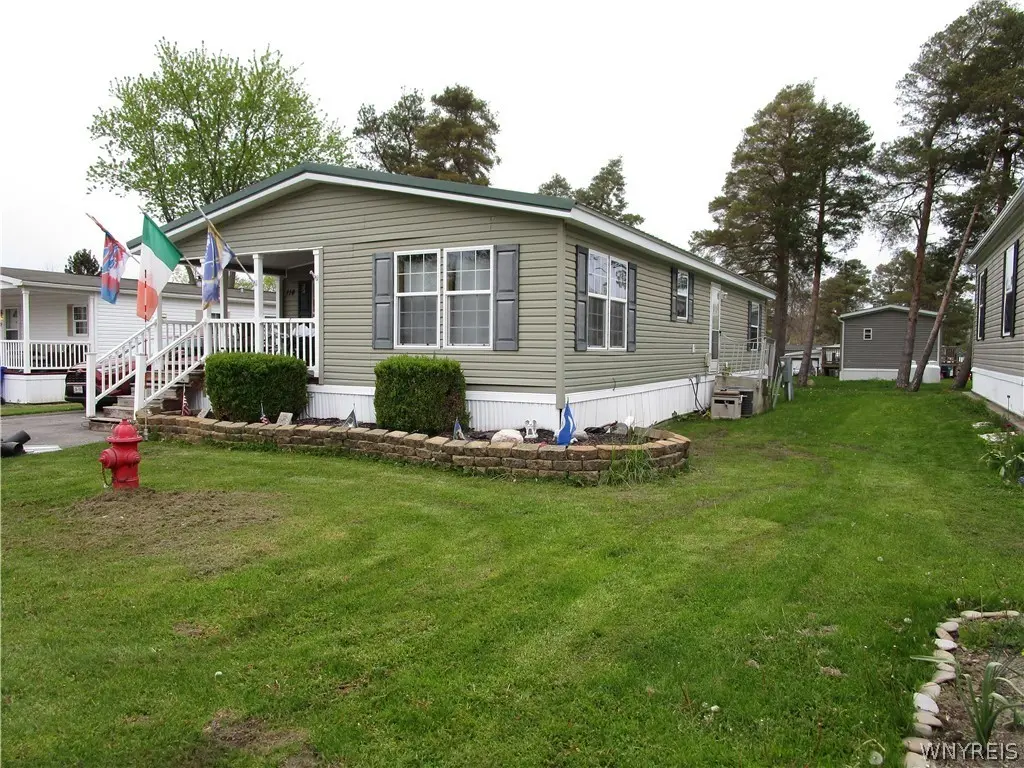
3450 Howard Rd #114 · Wanakah, NY
Flood risk 1/10 · Minimal
- FEMA flood zone
- X (unshaded)
- Chance of flooding over 30 yrs
- 0.0%
- Est. flood insurance / yr
- $507 – $1,088
Fire risk 1/10 · Minimal
- Est. fire insurance / yr
- $691 – $1,283
Heat risk 2/10 · Minimal
- Hot days now (above 93°F)
- 7 days/yr
- Hot days in 30 yrs
- 15 days/yr
Wind risk 1/10 · Minimal
- Chance of severe wind over 30 yrs
- —
Air-quality risk 4/10 · Minor
- Unhealthy air days now
- 4 days/yr
- Unhealthy air days in 30 yrs
- 9 days/yr
Risk factors via First Street. Map © Google.
Why this score? — see what drove the B grade
The composite is a weighted blend of 9 inputs, each scored 0–100. Each bar is that input's sub-score; the figure is the points it added to the 100-point composite (weight × sub-score).
- Cash flow +30.0/30.0
- DSCR +10.0/10.0
- 1% rule +8.8/10.0
- ARV discount +7.5/15.0
- Schools +4.7/10.0
- Rent growth +3.8/5.0
- Livability +3.5/5.0
- Condition / age +2.5/5.0
- Appreciation +0.0/10.0
$119,873
🖨 Deal sheet 📄 Offer letter ✓ Due diligence
Listing remarks
Welcome to this charming and well-maintained manufactured home situated in the lovely Waterfalls Village Park! You’ll appreciate the close proximity to Hamburg Beach, Woodlawn State Park, Canalside, and all the local amenities. This affordable home features 3/4 bedrooms and 2 full baths, with an inviting open floor plan where the kitchen seamlessly flows into the living room. Appliances are negotiable. Recent updates include a newer roof (5 years old), new flooring and carpeting. Enjoy amenities like Central Air, first-floor laundry, a covered front deck, a spacious shed, and a beautiful yard. Taxes are included in the lot rent. Buyers will need to be approved by Waterfalls Village Pa
Key facts
- Open floor plan
- New carpeting
- Newer roof
Tags
Property features AI
Finance
- HOA & community: Land lease: $784/month
Exterior
- Parking: No garage
- Utilities: Electricity connected (circuit breakers); Propane water heater; Public water connected; Sewer connected; High-speed internet available
- Home design: Single-story dwelling; Double wide mobile home (Skyline); Resale property
- Construction: Vinyl siding; Architectural shingle roof; Block foundation; Existing construction
- Exterior features: Covered porch; Concrete driveway; Shed(s) and additional storage
Interior
- Kitchen: Gas oven and gas range; Refrigerator; Appliances negotiable
- Bedrooms: Three main-level bedrooms; Bedroom dimensions include 12 x 12, 12 x 9, and 11 x 8 (first level)
- Flooring: Carpet; Vinyl; Varied flooring
- Bathrooms: Two full bathrooms (both on the main level)
- Heating & cooling: Propane forced-air heating; Central air conditioning
- Interior features: Eat-in kitchen; Living/dining room; Convertible bedroom; Primary bedroom with private bath
- Laundry & utility: Main-level laundry; Washer and dryer included
Neighborhood map
What this means for you Summary
Snapshot
- This is a 3-bed/2.0-bath manufactured listed at $120k.
Deal economics
- At list price, monthly cash flow is $496 ($6k/yr) — positive.
- The deal already cash-flows at list — no discount required.
- Meets the 1% rule at list price ($2k rent vs $120k).
- Recommended offer: $116k (3.0% below list) — sets the bar for market timing.
- Cap rate 11.3% vs local median 3.1% in Wanakah — top-decile yield for the area; either an underpriced asset or a hidden risk that comps aren't pricing in. Stress-test before assuming the spread holds.
Location & tenants
- Location reads 69/100 on livability (#508 in NY) — a middle-class / working-renter tenant base. Strengths: employment A+, housing A+, crime B+; Watch: amenities F, commute F, health & safety F.
- Frontier Central School District (suburban): math 54% / reading 55% proficiency, ranked #301 of 590 in NY (top 51%) — acceptable for families but not a draw, mixed tenant base, ~2y average lease; only 20% free/reduced lunch — higher-income household profile.
- Market conditions: Rents rising fast (+5.2%/yr); 262 active listings in the ZIP; 4 comparable units currently listed for rent nearby; rentals leasing fast (median 2d on market — plan ~1-2 weeks tenant-placement turnaround); solid renter incomes; 1,244 units permitted in Erie County in 2024 (563 in 5+ unit buildings).
Forward outlook
- Local home prices are declining (-3.0%/yr); year-one equity from $829 of loan paydown is wiped out by about $4k of value loss. Plan a longer hold.
- At projected returns (-3.0% appreciation + 5.2% rent growth), your $34k cash investment doubles in ~6 years — after that, you're playing with house money.
Negotiation context
- It's been on market 36 days — a 3% lower offer ($116k) is reasonable based on typical stale-listing flexibility.
Questions for the listing agent
- It's been on market 36 days. Have you received any prior offers? Is the seller open to a 3% concession, seller financing, or rate buy-down credit?
- Is there a deadline driving the sale (1031 exchange, divorce, estate, relocation)? That informs how much negotiation room exists.
- What's the average days-on-market for RENTAL listings here right now (not sales)? A rising rental-DOM trend means longer vacancies and softer asking-rent achievability than the comps imply.
- What's the recent tenant-quality profile in this submarket — average credit score on applications, eviction rate, late-payment / NSF rate, and stable-employment percentage? A property-management company in the area should have these aggregated.
- How much new for-sale + rental construction is in the pipeline within 1–3 miles? Heavy new supply typically softens prices + rents 12–24 months out; constrained supply supports both.
Investment metrics
- 1% rule
- 1.38% ✓
- Cap rate
- 11.26%
- Cash-on-cash
- 17.73%
- DSCR
- 1.79
- GRM
- 6.1
CMA / ARV
- ARV (median comp)
- $41,762
- List price
- $119,873
- Delta
- 187.04%
- Verdict
- OVERPRICED
- Comps
- 15 within 1.0 mi
Show comp detail 12 sales within ~0.75 mi
| Address | Dist | Beds/Ba | Sqft | Sold | Price | $/sf | Match |
|---|---|---|---|---|---|---|---|
| 52 Waterview Pkwy | 0.39mi | 3/2.0 | 924 (-5%) | 3mo | $65,000 | $70 | 71 |
| 41 S Roxbury Dr | 0.48mi | 3/2.0 | 924 (-5%) | 3mo | $40,000 | $43 | 67 |
| 50 S Roxbury Dr | 0.43mi | 3/2.0 | 924 (-5%) | 6mo | $84,900 | $92 | 66 |
| 87 Waterview Pkwy | 0.35mi | 2/1.5 (-1) | 924 (-5%) | 11mo | $46,000 | $50 | 59 |
| 21 Brush Dr | 0.50mi | 3/2.0 | 1,066 (+9%) | 4mo | $93,500 | $88 | 58 |
| 32 Waterview Pkwy | 0.42mi | 2/1.0 (-1) | 936 (-4%) | 8mo | $25,000 | $27 | 58 |
| 17 Rippleway Dr | 0.60mi | 3/1.0 | 1,036 (+6%) | 1mo | $28,000 | $27 | 57 |
| 37 Waterview Pkwy | 0.40mi | 2/1.0 (-1) | 924 (-5%) | 11mo | $56,000 | $61 | 54 |
| 32 Brookridge Dr | 0.65mi | 2/1.0 (-1) | 924 (-5%) | 2mo | $37,250 | $40 | 50 |
| 10 Vibernum Dr | 0.63mi | 3/1.0 | 924 (-5%) | 10mo | $23,500 | $25 | 49 |
| 16 Jean Dr | 0.46mi | 2/1.0 (-1) | 924 (-5%) | 14mo | $41,000 | $44 | 49 |
| 2 Vibernum Dr | 0.64mi | 2/1.0 (-1) | 924 (-5%) | 10mo | $26,000 | $28 | 44 |
Match score weights: distance 35% · size 25% · config 20% · recency 20%. Top-matched comps best support the ARV.
Projected returns pro-forma
-3.0% appreciation · 5.21% rent growth · sell at horizon
- IRR
- 11.7%
- Equity multiple
- 1.47×
- Total profit
- $15,920
- Equity at exit
- $17,873
- IRR
- 22.3%
- Equity multiple
- 3.11×
- Total profit
- $70,674
- Equity at exit
- $10,364
Cash invested: $33,564 (down + closing). Projections, not guarantees.
Landlord ↔ Tenant lean methodology
- Overall (STATE)
- 15 Strongly Tenant-Friendly
- State New York
- 15 Strongly Tenant-Friendly · D+10
- County
- — inherits STATE
- City
- — inherits STATE
ZIP-level market 14075
- Rents YoY
- 5.2%
- Active inventory
- 262
- Price-to-rent
- 6.1×
Monthly cashflow live
- Estimated rent
- $1,649 medium interval (Pro) →
- Mortgage (P&I)
- −$629
- Tax from tax record
- −$128 /mo · $1,542/yr
- Insurance
- −$50
- HOA
- −$0
- Vacancy / Maint / Mgmt
- −$346
- Net cashflow
- $496
Break-even live
UW: 25.0% down · 7.5% · 30yr · 1.5% tax · 5.0% vac · 8.0% maint · 8.0% mgmt
Financing live
Cash to close
- Down payment
- $29,968
- Closing costs
- $3,596
- Reserves months
- —
- Total cash needed
- —
Loan-product check · same deal, 3 products live
Conventional
25% down · 7.5% · 30yr
- Down + closing
- —
- Monthly P&I
- —
- Monthly cashflow
- —
- DSCR
- —
- Eligible?
- —
Personal DTI + credit; lowest rate.
DSCR
20% down · 8.5% · 30yr
- Down + closing
- —
- Monthly P&I
- —
- Monthly cashflow
- —
- DSCR
- —
- Eligible?
- —
No personal income docs; deal must DSCR.
Hard money
10% down · 12.0% · 12mo
- Down + closing
- —
- Monthly P&I
- —
- Monthly cashflow
- —
- DSCR
- —
- Eligible?
- —
Short-term bridge; refi at stabilization.
Rent comps 4 comps
| Address | Beds | Baths | Sqft | Rent | $/sqft | DOM | Units | Dist |
|---|---|---|---|---|---|---|---|---|
| 3580 Sowles Rd Hamburg, NY | 2.0 | 1.0 | 850 | $1,450 | $1.71 | 1d | 1 | 0.64mi |
| 4819 Southwestern Blvd Hamburg, NY | 2.0 | 2.0 | 1170 | $2,055 | $1.76 | 1d | 1 | 0.93mi |
| 4600 Southwestern Blvd Hamburg, NY | 1.0–2.0 | 1.0 | 725 | $1,750 | $2.41 | 1d | 13 | 1.39mi |
| 4591 Southwestern Blvd Hamburg, NY | 1.0–2.0 | 1.0 | 737 | $1,415 | $1.92 | 1d | 12 | 1.44mi |
Listing history 15 events
-
2026-06-18days on market $119,873 Active 36 DOM
-
2026-06-17days on market $119,873 Active 35 DOM
-
2026-06-16days on market $119,873 Active 34 DOM
-
2026-06-15days on market $119,873 Active 33 DOM
-
2026-06-13days on market $119,873 Active 31 DOM
-
2026-06-10days on market $119,873 Active 28 DOM
-
2026-06-09days on market $119,873 Active 27 DOM
-
2026-06-08days on market $119,873 Active 26 DOM
-
2026-06-07days on market $119,873 Active 25 DOM
-
2026-06-05days on market $119,873 Active 22 DOM
-
2026-06-03days on market $119,873 Active 21 DOM
-
2026-06-02days on market $119,873 Active 20 DOM
-
2026-06-01days on market $119,873 Active 19 DOM
-
2026-05-31days on market $119,873 Active 18 DOM
-
2026-05-13$124,873 Active 827-char remark
ⓘ Source: listings_history table (triggers on properties + properties_extension) + one-shot
backfill from property_details.listing_events for pre-trigger history.
Tax reassessment forecast NY · Partial reset (capped growth)
- Current annual tax
- $1,542 · $128/mo
- Projected year-2 tax
- $1,784 · $149/mo
- Expected delta
- +$242/yr (+$20/mo · 15.7%)
ⓘ Screening estimate from a state-policy table — verify with the county assessor before closing.
Climate risk First Street
- Flood 1/10 Low FEMA zone X (unshaded) · 0% chance over 30 yrs
- Wildfire 1/10 Low
- Heat 2/10 Low 7 d/yr ≥93°F today · 15 d/yr by 30 yrs out
- Wind 1/10 Low
- Air quality 4/10 Moderate 4 unhealthy d/yr today · 9 by 30 yrs out
Nearby sold comps map
Loading sold comps map…
Walkable amenities ~0.75 mi
Loading nearby amenities…
Taxation est. · year 1
- Rental income
- $19,792
- − Mortgage interest
- −$6,715
- − Property taxes
- −$1,542
- − Insurance
- −$599
- − Repairs & maintenance
- −$1,583
- − Management
- −$1,583
- − Depreciation
- −$3,487
- Taxable income
- $4,282
- Est. tax owed @ 24.0%
- −$1,028
- After-tax cash flow
- $4,923/yr
For passive investors: Depreciation is non-cash, so a rental often shows a tax loss while cash-flowing — sheltering income. Rental losses are passive: they offset passive income freely, and up to $25,000/yr can offset ordinary (W-2) income if you actively participate and your MAGI is under $100k (phasing out to $0 by $150k); unused losses carry forward. On sale, claimed depreciation is recaptured at up to 25%, and gains may owe capital-gains tax (a 1031 exchange can defer both). Figures are a year-1 estimate at your 24.0% rate — not tax advice; consult a CPA.
Schools (NCES district)
- District
- Frontier Central School District
- NCES district ID
- 3611670
- Math proficiency
- 54% ▼ -16.00%
- Reading proficiency
- 55% ▼ -10.00%
- Median HH income
- $58,807
- Composite
- 47.36/100
- National rank
- #2291
- State rank
- #301 of 590 in NY
Livability — Wanakah
- Score
- 69/100
- State rank
- #508
- US rank
- #8972
Category grades
Schools grade is shown separately in the Schools card above.
Census & demographics
- County
- Erie County · 714,559 people
- Metro
- Buffalo-Cheektowaga, NY
- Population (ZIP)
- 44,520
- Household income
- $83,383
- Rent vs Own
- Severe rent burden
- 824.0
Population outlook (Erie County) Hauer SSP2
- Today (2025)
- 933,037 people
- By 2030
- 935,181 · +0.2%
- By 2040
- 928,531 · -0.5%
- By 2050
- 905,725 · -2.9%
- By 2075
- 834,037 · -10.6%
- By 2100
- 708,033 · -24.1%
Race, ethnicity, and origin ACS 2023
- Neighborhood character
- Predominantly White (92%)
- Race & ethnicity
- White 92% Two or more races 4% Hispanic / Latino 3% Black 1%
- Common ancestry
- Romanian 20% Lithuanian 2% Slovak 2%
- Foreign-born
- 2% · Canada
- Languages at home
- 97% English-only · Spanish 1% Other Indo-European 1%
Political lean MEDSL · Erie
- 2024 margin
- Lean D (+9.7) · D 54.8% · R 45.2%
- 2008→2024 swing
- -7.9pp toward R · 2008: 17.5pp · 2024: 9.7pp
- All cycles
- 2024: D+9.7 2020: D+14.7 2016: D+4.8 2012: D+15.6 2008: D+17.5
Not yet ingested
- Civics
- —
Market trends
- HPI YoY
- ▼ -261.10%
- Current HPI
- 300.2852
- Rent YoY
- ▲ 5.21%
- Metro
- Buffalo-Cheektowaga, NY
- State GDP YoY
- ▲ 2.60%
- F500 in state
- 92
Industry mix (Fortune 500 HQ in NY)
| Industry | F500 HQs | Revenue |
|---|---|---|
| Financial Services | 10 | $950B |
|
||
| Consumer Goods | 9 | $162B |
|
||
| Insurance | 4 | $225B |
|
||
| Telecommunications | 2 | $144B |
|
||
| Pharmaceuticals | 2 | $112B |
|
||
| Media / Entertainment | 2 | $69B |
|
||
Price history
-4.0% since first listed2 events — show timeline
- 2026-05-26 Price Changed $119,873 WNYREIS
- 2026-05-13 Listed $124,873 WNYREIS
Property tax history
+11.4%/yrLatest (2025): $1,542 · +98.2% YoY. Source: county tax records.
Cash-flow waterfall
monthlySold comps — $/sqft
last 12 mo · ≤1 miLoading sold comps…