 Multi-family
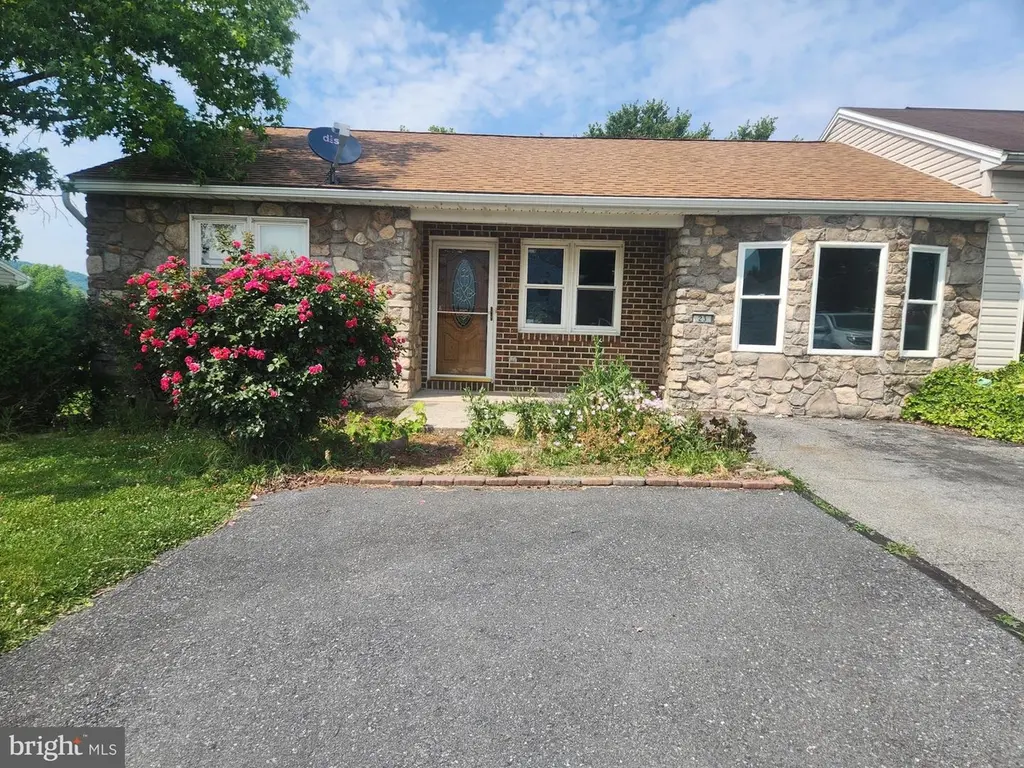
23 Furman Rd · Franklin, PA
Flood risk 1/10 · Minimal
- FEMA flood zone
- X (unshaded)
- Chance of flooding over 30 yrs
- 0.0%
- Est. flood insurance / yr
- $473 – $860
Fire risk 2/10 · Minimal
- Est. fire insurance / yr
- $511 – $949
Heat risk 5/10 · Moderate
- Hot days now (above 101°F)
- 7 days/yr
- Hot days in 30 yrs
- 16 days/yr
Wind risk 3/10 · Minor
- Chance of severe wind over 30 yrs
- 6.0%
Air-quality risk 3/10 · Minor
- Unhealthy air days now
- 1 days/yr
- Unhealthy air days in 30 yrs
- 4 days/yr
Risk factors via First Street. Map © Google.
Why this score? — see what drove the C+ grade
The composite is a weighted blend of 9 inputs, each scored 0–100. Each bar is that input's sub-score; the figure is the points it added to the 100-point composite (weight × sub-score).
- Cash flow +27.2/30.0
- DSCR +9.5/10.0
- ARV discount +7.5/15.0
- 1% rule +7.2/10.0
- Schools +4.1/10.0
- Livability +3.5/5.0
- Rent growth +2.5/5.0
- Condition / age +2.5/5.0
- Appreciation +0.0/10.0
$210,000
🖨 Deal sheet 📄 Offer letter ✓ Due diligence
Multi-family units
County records classify this as Multi-Family (2-4 Unit). Listing-text estimate: 1 unit. estimate disagrees with records
Listing remarks
Come check out this home! You will not believe all the space that this home has, 2 bedrooms, 1.5 baths. There is a sunroom plus a bonus room that use to be the garage. The basement has a laundry area, 1/2 bath, family room, craft room plus a workshop. There is plenty of storage! Come check out this home!
Key facts
- Craft room
- Plenty of storage
- Laundry area
Tags
Property features AI
Finance
- Other: Assessor used as source for finished area measurements; Lease not considered
Exterior
- Parking: Driveway parking for two vehicles; Two total garage and parking spaces
- Utilities: Public water; Public sewer
- Home design: Fee simple ownership; Property in good condition; Not in a federal flood zone
- Construction: Vinyl siding and stone exterior; Asphalt roof; Full basement (partially finished) with windows; Built year information from assessor
- Exterior features: Chain link fencing; Walkout basement; Above-grade and below-grade exterior structures
Interior
- Kitchen: Refrigerator; Stove; Microwave
- Bedrooms: Two bedrooms on the main level
- Flooring: Carpet; Laminate
- Bathrooms: One full bathroom; One half bathroom on a lower level
- Heating & cooling: Heat pump heating; Central air conditioning; Electric hot water; 100 Amp electric service
- Interior features: Ceiling fans; Pantry; Two fireplaces
- Laundry & utility: Laundry in the basement; Workshop space in basement; Basement shelving; Sump pump
Neighborhood map
What this means for you Summary
Snapshot
- This is a 2-bed/1.0-bath multifamily listed at $210k.
Deal economics
- At list price, monthly cash flow is $602 ($7k/yr) — positive.
- The deal already cash-flows at list — no discount required.
- Meets the 1% rule at list price ($3k rent vs $210k).
- Cap rate 9.7% vs local median 4.8% in Franklin — top-decile yield for the area; either an underpriced asset or a hidden risk that comps aren't pricing in. Stress-test before assuming the spread holds.
Location & tenants
- Location reads 69/100 on livability (#812 in PA) — a middle-class / working-renter tenant base. Strengths: cost of living A+, housing A+, crime B+; Watch: health & safety C-, employment D, amenities F.
- Northern York County SD (rural): math 35% / reading 57% proficiency, ranked #223 of 539 in PA (top 41%) — families likely to look elsewhere, expect single-tenant / working-renter base with shorter leases; only 16% free/reduced lunch — higher-income household profile.
- Zoned schools: Northern El Sch (math 27% / reading 47%, grade F, #1,004 of 1,518 statewide, top 68%, 395 students, 40% FRL); Northern Ms (math 23% / reading 52%, grade F, #292 of 512 statewide, top 58%, 751 students, 26% FRL); Northern Hs (math 56%, 1,051 students, 21% FRL).
- Market conditions: 92 active listings in the ZIP; 2 comparable units currently listed for rent nearby; 1,328 units permitted in York County in 2024 (338 in 5+ unit buildings).
Forward outlook
- Local home prices are declining (-3.0%/yr); year-one equity from $1k of loan paydown is wiped out by about $6k of value loss. Plan a longer hold.
- At projected returns (-3.0% appreciation + 3.0% rent growth), your $59k cash investment doubles in ~10 years — after that, you're playing with house money.
Negotiation context
- Only 9 days on market — expect competitive offers; lowballing is unlikely to land.
- Current owner paid $77k; list at $210k implies a 173% gain — meaningful room to come down on a strong offer.
Risks & watch-outs
- Climate carrying-cost: extreme-heat days projected 7→16/yr by 2055 (HVAC capex compounding) — expect insurance premiums to compound above CPI over the hold.
Questions for the listing agent
- Is there a deadline driving the sale (1031 exchange, divorce, estate, relocation)? That informs how much negotiation room exists.
- Schools are D-rated, which usually means shorter tenancies and higher turnover. Who's the typical renter profile here, and what's been the actual vacancy rate?
- What's the average days-on-market for RENTAL listings here right now (not sales)? A rising rental-DOM trend means longer vacancies and softer asking-rent achievability than the comps imply.
- What's the recent tenant-quality profile in this submarket — average credit score on applications, eviction rate, late-payment / NSF rate, and stable-employment percentage? A property-management company in the area should have these aggregated.
- How much new apartment / multifamily construction is in the pipeline within 1–3 miles? Heavy new supply (>2% of stock underway) typically softens rents 12–24 months out; light construction supports rent growth.
Investment metrics
- 1% rule
- 1.22% ✓
- Cap rate
- 9.74%
- Cash-on-cash
- 12.30%
- DSCR
- 1.55
- GRM
- 6.8
CMA / ARV
No comps found within radius.
Projected returns pro-forma
-3.0% appreciation · 3.0% rent growth · sell at horizon
- IRR
- 1.9%
- Equity multiple
- 1.07×
- Total profit
- $4,361
- Equity at exit
- $31,312
- IRR
- 11.5%
- Equity multiple
- 1.91×
- Total profit
- $53,277
- Equity at exit
- $18,157
Cash invested: $58,800 (down + closing). Projections, not guarantees.
Landlord ↔ Tenant lean methodology
- Overall (STATE)
- 62 Landlord-Friendly
- State Pennsylvania
- 62 Landlord-Friendly · EVEN
- County
- — inherits STATE
- City
- — inherits STATE
ZIP-level market 17019
- Home prices YoY
- -26.9%
- Active inventory
- 92
- Price-to-rent
- 13.7×
Monthly cashflow live
- Estimated rent
- $2,555 medium interval (Pro) →
- Mortgage (P&I)
- −$1,101
- Tax from tax record
- −$227 /mo · $2,726/yr
- Insurance
- −$88
- HOA
- −$0
- Vacancy / Maint / Mgmt
- −$537
- Net cashflow
- $602
Break-even live
2-unit breakdown (identical units grouped — click to expand)
| Units | Beds | Baths | Est. rent |
|---|---|---|---|
| 2× units | 2 | 1.5 | $2,556 |
| #1 | 2 | 1.5 | $1,278 |
| #2 | 2 | 1.5 | $1,278 |
| Total (2 units) | $2,555 | ||
UW: 25.0% down · 7.5% · 30yr · 1.5% tax · 5.0% vac · 8.0% maint · 8.0% mgmt
Financing live
Cash to close
- Down payment
- $52,500
- Closing costs
- $6,300
- Reserves months
- —
- Total cash needed
- —
Loan-product check · same deal, 3 products live
Conventional
25% down · 7.5% · 30yr
- Down + closing
- —
- Monthly P&I
- —
- Monthly cashflow
- —
- DSCR
- —
- Eligible?
- —
Personal DTI + credit; lowest rate.
DSCR
20% down · 8.5% · 30yr
- Down + closing
- —
- Monthly P&I
- —
- Monthly cashflow
- —
- DSCR
- —
- Eligible?
- —
No personal income docs; deal must DSCR.
Hard money
10% down · 12.0% · 12mo
- Down + closing
- —
- Monthly P&I
- —
- Monthly cashflow
- —
- DSCR
- —
- Eligible?
- —
Short-term bridge; refi at stabilization.
Rent comps 2 comps
| Address | Beds | Baths | Sqft | Rent | $/sqft | DOM | Units | Dist |
|---|---|---|---|---|---|---|---|---|
| 301 S Baltimore St Dillsburg, PA | 3.0 | 1.0 | 1500 | $1,650 | $1.10 | 21d | 1 | 1.42mi |
| 127 S 2nd St Dillsburg, PA | 1.0 | 1.0 | 800 | $975 | $1.22 | 43d | 1 | 1.44mi |
Listing history 9 events
-
2026-06-19price $210,000 Active 9 DOM
-
2026-06-18days on market $229,900 Active 9 DOM
-
2026-06-17days on market $229,900 Active 8 DOM
-
2026-06-16days on market $229,900 Active 7 DOM
-
2026-06-15days on market $229,900 Active 6 DOM
-
2026-06-14days on market $229,900 Active 4 DOM
-
2026-06-13days on market $229,900 Active 3 DOM
-
2026-06-10remarks 307-char remark
-
2026-06-10$229,900 Active 1 DOM
ⓘ Source: listings_history table (triggers on properties + properties_extension) + one-shot
backfill from property_details.listing_events for pre-trigger history.
Tax reassessment forecast PA · Partial reset (capped growth)
- Current annual tax
- $2,726 · $227/mo
- Projected year-2 tax
- $3,022 · $252/mo
- Expected delta
- +$296/yr (+$25/mo · 10.8%)
ⓘ Screening estimate from a state-policy table — verify with the county assessor before closing.
Climate risk First Street
- Flood 1/10 Low FEMA zone X (unshaded) · 0% chance over 30 yrs
- Wildfire 2/10 Low
- Heat 5/10 Major 7 d/yr ≥101°F today · 16 d/yr by 30 yrs out
- Wind 3/10 Moderate 6% chance of damaging wind over 30 yrs
- Air quality 3/10 Moderate 1 unhealthy d/yr today · 4 by 30 yrs out
Nearby sold comps map
Loading sold comps map…
Walkable amenities ~0.75 mi
Loading nearby amenities…
Taxation est. · year 1
- Rental income
- $30,660
- − Mortgage interest
- −$11,763
- − Property taxes
- −$2,726
- − Insurance
- −$1,050
- − Repairs & maintenance
- −$2,453
- − Management
- −$2,453
- − Depreciation
- −$6,109
- Taxable income
- $4,106
- Est. tax owed @ 24.0%
- −$985
- After-tax cash flow
- $6,244/yr
For passive investors: Depreciation is non-cash, so a rental often shows a tax loss while cash-flowing — sheltering income. Rental losses are passive: they offset passive income freely, and up to $25,000/yr can offset ordinary (W-2) income if you actively participate and your MAGI is under $100k (phasing out to $0 by $150k); unused losses carry forward. On sale, claimed depreciation is recaptured at up to 25%, and gains may owe capital-gains tax (a 1031 exchange can defer both). Figures are a year-1 estimate at your 24.0% rate — not tax advice; consult a CPA.
Schools (NCES district)
- District
- Northern York County SD
- NCES district ID
- 4217760
- Math proficiency
- 35% ▼ -11.00%
- Reading proficiency
- 57% ▼ -12.00%
- Median HH income
- $65,255
- Composite
- 40.84/100
- National rank
- #3629
- State rank
- #223 of 539 in PA
Livability — Franklin
- Score
- 69/100
- State rank
- #812
- US rank
- #8260
Category grades
Schools grade is shown separately in the Schools card above.
Census & demographics
- Population (ZIP)
- 19,294
Population outlook (York County) Hauer SSP2
- Today (2025)
- 454,205 people
- By 2030
- 457,407 · +0.7%
- By 2040
- 457,529 · +0.7%
- By 2050
- 448,261 · -1.3%
- By 2075
- 427,388 · -5.9%
- By 2100
- 384,218 · -15.4%
Race, ethnicity, and origin ACS 2023
- Neighborhood character
- Predominantly White (92%)
- Race & ethnicity
- White 92% Two or more races 4% Hispanic / Latino 2% Black 1%
- Common ancestry
- Romanian 2% Lithuanian 2% Serbian 1%
- Foreign-born
- 3% · Canada, South Korea
- Languages at home
- 96% English-only · Spanish 2% Russian/Polish/Slavic 1% German/W. Germanic 1%
Political lean MEDSL · York
- 2024 margin
- Strong R (+25.3) · D 36.9% · R 62.1%
- 2008→2024 swing
- -11.7pp toward R · 2008: -13.6pp · 2024: -25.3pp
- All cycles
- 2024: R+25.3 2020: R+24.6 2016: R+29.3 2012: R+21.2 2008: R+13.6
Not yet ingested
- Civics
- —
Market trends
- HPI YoY
- ▼ -93.66%
- Current HPI
- 254.4777
- Rent YoY
- —
- Metro
- —
- State GDP YoY
- ▲ 1.68%
- F500 in state
- 34
Industry mix (Fortune 500 HQ in PA)
| Industry | F500 HQs | Revenue |
|---|---|---|
| Healthcare | 2 | $309B |
|
||
| Insurance | 2 | $27B |
|
||
| Telecommunications / Media | 1 | $124B |
|
||
| Industrial Distribution | 1 | $22B |
|
||
| Financial Services | 1 | $20B |
|
||
| Chemicals / Materials | 1 | $18B |
|
||
Price history
+245.7% since first listed3 events — show timeline
- 2026-06-09 Listed $229,900 BRIGHT MLS
- 1997-02-11 Sold (Public Records) $77,000 Public Records
- 1989-07-26 Sold (Public Records) $66,500 Public Records
Property tax history
+3.0%/yrLatest (2025): $2,726 · +1.1% YoY. Source: county tax records.
Cash-flow waterfall
monthlySold comps — $/sqft
last 12 mo · ≤1 miLoading sold comps…