433 County Road St N · Hendrum, MN
Flood risk 1/10 · Minimal
- FEMA flood zone
- X
- Chance of flooding over 30 yrs
- 0.0%
- Est. flood insurance / yr
- $473 – $860
Fire risk 1/10 · Minimal
- Est. fire insurance / yr
- $888 – $1,650
Heat risk 2/10 · Minimal
- Hot days now (above 98°F)
- 7 days/yr
- Hot days in 30 yrs
- 12 days/yr
Wind risk 2/10 · Minimal
- Chance of severe wind over 30 yrs
- —
Air-quality risk 3/10 · Minor
- Unhealthy air days now
- 3 days/yr
- Unhealthy air days in 30 yrs
- 3 days/yr
Risk factors via First Street. Map © Google.
Why this score? — see what drove the C grade
The composite is a weighted blend of 9 inputs, each scored 0–100. Each bar is that input's sub-score; the figure is the points it added to the 100-point composite (weight × sub-score).
- Cash flow +19.7/30.0
- ARV discount +7.5/15.0
- DSCR +6.2/10.0
- 1% rule +5.2/10.0
- Appreciation +5.0/10.0
- Schools +5.0/10.0
- Livability +3.2/5.0
- Rent growth +2.5/5.0
- Condition / age +1.0/5.0
$105,000
🖨 Deal sheet 📄 Offer letter ✓ Due diligence
Listing remarks
Opportunity knocks on this 3-bedroom, 2-bath mobile home sitting on a full acre of private land in Hendrum, MN — priced at $105,000. Sold as-is, this fixer-upper is packed with potential for the right buyer willing to put in the work. The layout has great bones, featuring a private primary suite, a hidden pantry/laundry room tucked off the kitchen, and over an acre of wide-open, private lot to make your own. The real stars here are the extras — a massive 3-car detached garage perfect for a home business, workshop, or serious hobbyist, plus three additional storage sheds for all your toys and tools. The spacious yard offers endless possibilities for gardening, entertaining, or ju
Key facts
- Spacious yard
- Private land
- Hidden pantry
Tags
Property features AI
Finance
- Other: Lot nearly 1 acre (about 0.996 acres) with dimensions ~170 x 300
Exterior
- Parking: Detached/attached garage space for 3 cars; Garage approximately 40 x 30 (about 1,200 sq ft)
- Utilities: City water (connected); City sewer (connected); Power provided by Red River Valley Co-op Power Association; Propane fuel
- Home design: Residential manufactured home; One level
- Construction: Asphalt roof; Pillar/post/pier foundation; Built on a foundation area of about 1,178; Above-grade finished area about 1,178
- Exterior features: Covered patio/porch; Deck; Storage shed; County road frontage
Interior
- Kitchen: Dishwasher; Range; Refrigerator; Freezer
- Bedrooms: 3 bedrooms
- Bathrooms: 2 full bathrooms
- Heating & cooling: Forced air heating; No central air
- Interior features: Dishwasher; Dryer; Freezer; Range; Refrigerator; Washer; Primary bedroom with walk-in closet; Private primary bath
- Laundry & utility: Washer; Dryer; Rented fuel tank (propane)
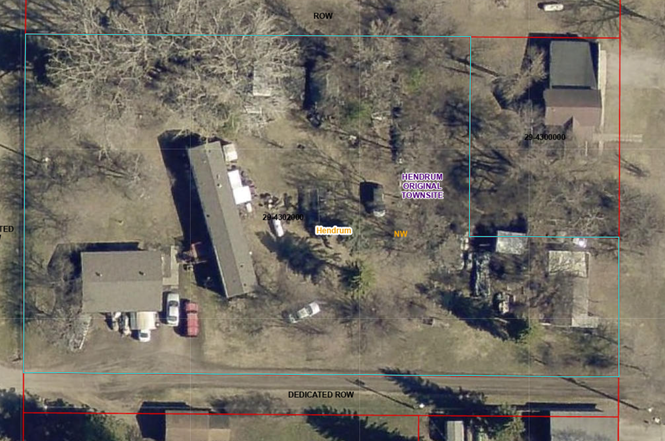
Neighborhood map
What this means for you Summary
Snapshot
- This is a 3-bed/2.0-bath single-family listed at $105k. Condition is rated poor.
Deal economics
- At list price, monthly cash flow is $123 ($1k/yr) — positive.
- The deal already cash-flows at list — no discount required.
- Meets the 1% rule at list price ($1k rent vs $105k).
Location & tenants
- Location reads 65/100 on livability (#528 in MN) — a middle-class / working-renter tenant base. Strengths: cost of living A+, housing A+, schools B+; Watch: crime D+, health & safety D+, amenities F.
- Market conditions: 5 active listings in the ZIP; 8 units permitted in Norman County in 2024 (0 in 5+ unit buildings).
Forward outlook
- In year one you build about $4k of equity ($726 loan paydown + $3k appreciation (3.0% local appreciation)).
- At projected returns (3.0% appreciation + 3.0% rent growth), your $29k cash investment doubles in ~5 years — after that, you're playing with house money.
- By year 9, paydown + projected appreciation supports a ~$33k cash-out refi (75% LTV) — recoverable capital for the next deal without selling this one.
Negotiation context
- Only 1 days on market — expect competitive offers; lowballing is unlikely to land.
Questions for the listing agent
- Have any recent inspections been done? Can we get a copy of the seller's disclosures and any deferred-maintenance estimates?
- Is there a deadline driving the sale (1031 exchange, divorce, estate, relocation)? That informs how much negotiation room exists.
- Schools are B-rated — typically a magnet for longer-tenancy family renters. What's the average tenant stay here, and is there a school-zone premium baked into asking?
- Crime grade is D in this area — have there been break-ins, vandalism, or insurance claims at this property in the last 3 years? What carrier currently insures it and at what premium?
- What's the average days-on-market for RENTAL listings here right now (not sales)? A rising rental-DOM trend means longer vacancies and softer asking-rent achievability than the comps imply.
- What's the recent tenant-quality profile in this submarket — average credit score on applications, eviction rate, late-payment / NSF rate, and stable-employment percentage? A property-management company in the area should have these aggregated.
- How much new for-sale + rental construction is in the pipeline within 1–3 miles? Heavy new supply typically softens prices + rents 12–24 months out; constrained supply supports both.
Investment metrics
- 1% rule
- 1.02% ✓
- Cap rate
- 7.70%
- Cash-on-cash
- 5.03%
- DSCR
- 1.22
- GRM
- 8.1
CMA / ARV
No comps found within radius.
Projected returns pro-forma
3.0% appreciation · 3.0% rent growth · sell at horizon
- IRR
- 12.2%
- Equity multiple
- 1.70×
- Total profit
- $20,515
- Equity at exit
- $47,213
- IRR
- 14.3%
- Equity multiple
- 3.11×
- Total profit
- $62,068
- Equity at exit
- $72,760
Cash invested: $29,400 (down + closing). Projections, not guarantees.
Landlord ↔ Tenant lean methodology
- Overall (STATE)
- 46 Balanced
- State Minnesota
- 46 Balanced · D+2
- County
- — inherits STATE
- City
- — inherits STATE
ZIP-level market 56550
- Active inventory
- 5
- Price-to-rent
- 8.1×
Monthly cashflow live
- Estimated rent
- $1,075 medium interval (Pro) →
- Mortgage (P&I)
- −$551
- Tax est. 1.5%
- −$131 /mo · $1,575/yr
- Insurance
- −$44
- HOA
- −$0
- Vacancy / Maint / Mgmt
- −$226
- Net cashflow
- $123
Break-even live
UW: 25.0% down · 7.5% · 30yr · 1.5% tax · 5.0% vac · 8.0% maint · 8.0% mgmt
Financing live
Cash to close
- Down payment
- $26,250
- Closing costs
- $3,150
- Reserves months
- —
- Total cash needed
- —
Loan-product check · same deal, 3 products live
Conventional
25% down · 7.5% · 30yr
- Down + closing
- —
- Monthly P&I
- —
- Monthly cashflow
- —
- DSCR
- —
- Eligible?
- —
Personal DTI + credit; lowest rate.
DSCR
20% down · 8.5% · 30yr
- Down + closing
- —
- Monthly P&I
- —
- Monthly cashflow
- —
- DSCR
- —
- Eligible?
- —
No personal income docs; deal must DSCR.
Hard money
10% down · 12.0% · 12mo
- Down + closing
- —
- Monthly P&I
- —
- Monthly cashflow
- —
- DSCR
- —
- Eligible?
- —
Short-term bridge; refi at stabilization.
Listing history 2 events
-
2026-06-17remarks 687-char remark
-
2026-06-17$105,000 Coming Soon 1 DOM
ⓘ Source: listings_history table (triggers on properties + properties_extension) + one-shot
backfill from property_details.listing_events for pre-trigger history.
Climate risk First Street
- Flood 1/10 Low FEMA zone X · 0% chance over 30 yrs
- Wildfire 1/10 Low
- Heat 2/10 Low 7 d/yr ≥98°F today · 12 d/yr by 30 yrs out
- Wind 2/10 Low
- Air quality 3/10 Moderate 3 unhealthy d/yr today · 3 by 30 yrs out
Nearby sold comps map
Loading sold comps map…
Walkable amenities ~0.75 mi
Loading nearby amenities…
Taxation est. · year 1
- Rental income
- $12,894
- − Mortgage interest
- −$5,882
- − Property taxes
- −$1,575
- − Insurance
- −$525
- − Repairs & maintenance
- −$1,032
- − Management
- −$1,032
- − Depreciation
- −$3,055
- Taxable loss
- −$205
- Est. tax savings @ 24.0%
- +$49
- After-tax cash flow
- $1,528/yr
For passive investors: Depreciation is non-cash, so a rental often shows a tax loss while cash-flowing — sheltering income. Rental losses are passive: they offset passive income freely, and up to $25,000/yr can offset ordinary (W-2) income if you actively participate and your MAGI is under $100k (phasing out to $0 by $150k); unused losses carry forward. On sale, claimed depreciation is recaptured at up to 25%, and gains may owe capital-gains tax (a 1031 exchange can defer both). Figures are a year-1 estimate at your 24.0% rate — not tax advice; consult a CPA.
Condition & rehab AI · 2 photos
This fixer-upper mobile home requires extensive renovations and repairs to bring it up to current standards. Significant updates to the exterior, interior, and systems are needed to increase its resale and rental value.
Repairs flagged
- Major kitchen — No photos of the kitchen
- Major bathrooms — No photos of the bathrooms
- Major roof — No photos of the roof
- Major exterior — No photos of the exterior
- Major flooring — No photos of the flooring
- Major interior walls/paint — No photos of the interior walls/paint
- Major windows — No photos of the windows
- Major foundation/structure — No photos of the foundation/structure
- Major HVAC/mechanicals — No photos of the HVAC/mechanicals
- Major landscaping/curb appeal — No photos of the landscaping/curb appeal
Value-add opportunities
- Both extensive exterior renovation — A fresh exterior will attract more buyers and renters
- Both kitchen and bathroom updates — Modern kitchens and bathrooms are highly sought after
- Both roof replacement — A new roof will increase the home's value and reduce maintenance costs
- Both HVAC system upgrade — A new HVAC system will improve comfort and energy efficiency
- Both landscaping and curb appeal — A well-maintained yard and curb appeal will make the home more attractive
Renovation cost estimate screening
| Repair item | Severity | Est. cost |
|---|---|---|
| kitchen · No photos of the kitchen | Major | $15,000–50,000 |
| bathrooms · No photos of the bathrooms | Major | $15,000–50,000 |
| roof · No photos of the roof | Major | $15,000–50,000 |
| exterior · No photos of the exterior | Major | $15,000–50,000 |
| flooring · No photos of the flooring | Major | $15,000–50,000 |
| interior walls/paint · No photos of the interior walls/paint | Major | $15,000–50,000 |
| windows · No photos of the windows | Major | $15,000–50,000 |
| foundation/structure · No photos of the foundation/structure | Major | $15,000–50,000 |
| HVAC/mechanicals · No photos of the HVAC/mechanicals | Major | $15,000–50,000 |
| landscaping/curb appeal · No photos of the landscaping/curb appeal | Major | $15,000–50,000 |
| Total estimated repair cost · 10 items | $150,000–500,000 |
Value-add ROI direction
- Both extensive exterior renovation — A fresh exterior will attract more buyers and renters ↑
- Both kitchen and bathroom updates — Modern kitchens and bathrooms are highly sought after ↑
- Both roof replacement — A new roof will increase the home's value and reduce maintenance costs ↑
- Both HVAC system upgrade — A new HVAC system will improve comfort and energy efficiency ↑
- Both landscaping and curb appeal — A well-maintained yard and curb appeal will make the home more attractive ↑
ⓘ Cost ranges are severity-bucket heuristics (US national rule-of-thumb). Get contractor quotes + a written scope before underwriting a rehab budget.
Schools (NCES district)
No district data.
Livability — Hendrum
- Score
- 65/100
- State rank
- #528
- US rank
- #12695
Category grades
Schools grade is shown separately in the Schools card above.
Census & demographics
- Census place
- Hendrum, MN
- Population (ZIP)
- 291
Population outlook (Norman County) Hauer SSP2
- Today (2025)
- 6,540 people
- By 2030
- 6,489 · -0.8%
- By 2040
- 6,436 · -1.6%
- By 2050
- 6,348 · -2.9%
- By 2075
- 6,263 · -4.2%
- By 2100
- 5,731 · -12.4%
Race, ethnicity, and origin ACS 2023
- Neighborhood character
- Predominantly White (92%)
- Race & ethnicity
- White 92% Two or more races 6% Hispanic / Latino 1%
- Common ancestry
- Portuguese 39% Arab 5% Lithuanian 2%
- Foreign-born
- 3%
- Languages at home
- 96% English-only · Arabic 4%
Political lean MEDSL · Norman
- 2024 margin
- Strong R (+22.2) · D 37.5% · R 59.8% · Other 2.7%
- 2008→2024 swing
- -49.2pp toward R · 2008: 26.9pp · 2024: -22.2pp
- All cycles
- 2024: R+22.2 2020: R+16.0 2016: R+13.5 2012: D+10.8 2008: D+26.9
Not yet ingested
- Civics
- —
Market trends
- HPI YoY
- —
- Current HPI
- —
- Rent YoY
- —
- Metro
- —
- State GDP YoY
- ▲ 2.41%
- F500 in state
- 34
Industry mix (Fortune 500 HQ in MN)
| Industry | F500 HQs | Revenue |
|---|---|---|
| Healthcare | 2 | $407B |
|
||
| Retail | 2 | $150B |
|
||
| Consumer Goods | 2 | $32B |
|
||
| Industrial Machinery | 2 | $6B |
|
||
| Agriculture | 1 | $40B |
|
||
| Healthcare / Medical Devices | 1 | $32B |
|
||
Price history
1 event — show timeline
- 2026-06-17 Coming Soon $105,000 NORTHSTARMLS as Distributed by MLS Grid
Cash-flow waterfall
monthlySold comps — $/sqft
last 12 mo · ≤1 miLoading sold comps…