 🌊 Lakefront
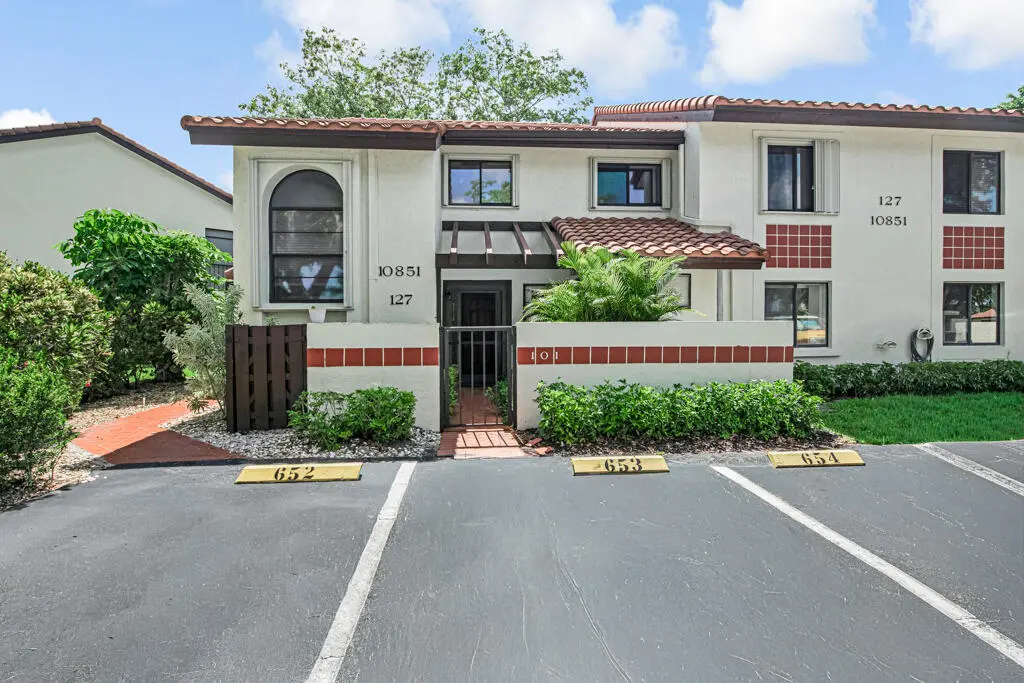
10851 Palm Lake Ave #101 · Golf, FL
Flood risk 1/10 · Minimal
- FEMA flood zone
- X (unshaded)
- Chance of flooding over 30 yrs
- 0.0%
- Est. flood insurance / yr
- $507 – $1,088
Fire risk 1/10 · Minimal
- Est. fire insurance / yr
- $947 – $1,759
Heat risk 9/10 · Severe
- Hot days now (above 106°F)
- 7 days/yr
- Hot days in 30 yrs
- 25 days/yr
Wind risk 10/10 · Severe
- Chance of severe wind over 30 yrs
- 99.0%
Air-quality risk 2/10 · Minimal
- Unhealthy air days now
- 1 days/yr
- Unhealthy air days in 30 yrs
- 2 days/yr
Risk factors via First Street. Map © Google.
Why this score? — see what drove the B grade
The composite is a weighted blend of 9 inputs, each scored 0–100. Each bar is that input's sub-score; the figure is the points it added to the 100-point composite (weight × sub-score).
- Cash flow +27.3/30.0
- 1% rule +10.0/10.0
- DSCR +9.5/10.0
- ARV discount +7.5/15.0
- Appreciation +4.9/10.0
- Schools +4.3/10.0
- Livability +3.2/5.0
- Rent growth +2.8/5.0
- Condition / age +2.5/5.0
$175,000
🖨 Deal sheet 📄 Offer letter ✓ Due diligence
Listing remarks
Don't miss your opportunity to own this slice of paradise. Immaculate corner ground floor unit. Property Features: * 2 Bedrooms + Den/optional 3rd Bedroom - Versatile space for a home office or guest room * Lakeside Location - Enjoy breathtaking water views LAKE FRONT Florida Room - w/ serene lake views * Expansive Primary Suite - Walk-in closet, additional wall closet * Multiple Outdoor Spaces - Florida room, front courtyard & side patio for ultimate relaxation . Located in the desirable Palm Chase community, residents enjoy access to resort-style amenities including a pool, pickleball and tennis courts, fitness center, walking paths, and bocce ball. Clubhouse with Heated/Cool
Key facts
- Lakeside location
- Palm chase community
- $867 HOA
Tags
Property features AI
Finance
- Other: Pets not allowed; Senior community
- HOA & community: Association: PALM CHASE; Quarterly HOA fee (includes cable TV, internet, grounds maintenance, security, common areas, common real estate tax, reserve funds, roof repairs, recreation facility); Community amenities include: clubhouse, fitness center, pool (heated), tennis courts, pickleball courts, billiard room, game room, library, community room, manager on site, on-site management, gated community, security, recreation facilities, maintenance, internet included
Exterior
- Parking: Assigned parking; Guest parking; 1 open parking space (1 total parking)
- Security: Security gate
- Utilities: Public water; Public sewer; Cable connected
- Home design: Condominium; One-level living; 2-story building total; Faces east; Resale condition
- Construction: CBS construction; Spanish tile roof
- Exterior features: Waterfront property (no specific waterfront features listed); Entry at ground level
Interior
- Kitchen: Dishwasher; Disposal; Electric range; Microwave; Refrigerator; Electric water heater
- Bedrooms: 3 bedrooms on the main level
- Flooring: Carpet; Tile
- Bathrooms: 2 full bathrooms on the main level
- Heating & cooling: Central heating (electric); Central air conditioning (electric); Ceiling fans
- Interior features: Walk-in closets; Blinds on windows; Furnished negotiable
- Laundry & utility: Inside laundry with washer hookup
Neighborhood map
What this means for you Summary
Snapshot
- This is a 3-bed/2.0-bath condo listed at $175k.
Deal economics
- At list price, monthly cash flow is $506 ($6k/yr) — positive.
- The deal already cash-flows at list — no discount required.
- Meets the 1% rule at list price ($3k rent vs $175k).
- Recommended offer: $172k (1.5% below list) — sets the bar for market timing.
Location & tenants
- Location reads 63/100 on livability (#703 in FL) — a middle-class / working-renter tenant base. Strengths: crime A+, employment A+, housing A+; Watch: amenities F, commute F, cost of living F.
- Palm Beach (suburban): math 46% / reading 53% proficiency, ranked #34 of 73 in FL (top 47%) — families likely to look elsewhere, expect single-tenant / working-renter base with shorter leases.
- Zoned schools: Crosspointe Elementary School (math 36% / reading 45%, grade F, #1,471 of 2,144 statewide, top 69%, 652 students, 75% FRL); Boynton Beach Community High (math 13% / reading 25%, grade F, #565 of 667 statewide, top 85%, 1,547 students, 65% FRL) — zoned schools average 70% FRL vs 52% district-wide (18 pts higher); higher-poverty schools than district average — tighter screening recommended.
- Zoned-school proficiency averages 30% at this address vs 50% district-wide (-20 pts) — the specific schools serving this property underperform the Palm Beach average; the district grade overstates school quality for this exact location.
- Market conditions: Rents rising (+1.3%/yr); 479 active listings in the ZIP; 40 comparable units currently listed for rent nearby; rentals at typical pace (median 25d on market — plan ~3-4 weeks tenant-placement turnaround); solid renter incomes; 3,974 units permitted in Palm Beach County in 2024 (1,012 in 5+ unit buildings).
- At $3,117/mo this rent would consume 46% of the median local household income ($81k/yr) (locally 902% of renters already pay >50% of income on rent) — very limited rent-growth headroom before tenants either downsize or default.
Forward outlook
- In year one you build about $787 of equity ($1k loan paydown + $-423 appreciation (-0.2% local appreciation)).
- Palm Beach County population projected at +30% by 2050 — long-run rental-demand tailwind backs the buy-and-hold thesis.
- At projected returns (-0.2% appreciation + 1.3% rent growth), your $49k cash investment doubles in ~7 years — after that, you're playing with house money.
Negotiation context
- It's been on market 27 days — a 2% lower offer ($172k) is reasonable based on typical stale-listing flexibility.
Risks & watch-outs
- Watch-outs: HOA is 28% of rent.
- Climate carrying-cost: severe wind risk, 99% chance of damaging wind over 30y; extreme-heat days projected 7→25/yr by 2055 (HVAC capex compounding) — expect insurance premiums to compound above CPI over the hold.
Questions for the listing agent
- What does the HOA fee cover, when was the last increase, and are there any pending special assessments or reserve-fund shortfalls?
- Any open or pending special assessments — roof, HVAC, plumbing, elevator, façade? What's the per-unit balance and payoff schedule, and is the seller paying it off at close or rolling it to the buyer?
- Is there a deadline driving the sale (1031 exchange, divorce, estate, relocation)? That informs how much negotiation room exists.
- This sits on a lake — are riparian / water-frontage rights deeded with the parcel? Any dock permits, shoreline easements, or HOA water-use restrictions?
- What's the documented flood / surge / shoreline-erosion history here (FEMA AND non-FEMA — e.g., storm surge, creek backup, septic-field saturation)?
- Any water-quality or seasonal algae-bloom issues that affect tenant satisfaction or short-term-rental demand?
- What's the average days-on-market for RENTAL listings here right now (not sales)? A rising rental-DOM trend means longer vacancies and softer asking-rent achievability than the comps imply.
- What's the recent tenant-quality profile in this submarket — average credit score on applications, eviction rate, late-payment / NSF rate, and stable-employment percentage? A property-management company in the area should have these aggregated.
- How much new apartment / multifamily construction is in the pipeline within 1–3 miles? Heavy new supply (>2% of stock underway) typically softens rents 12–24 months out; light construction supports rent growth.
Investment metrics
- 1% rule
- 1.78% ✓
- Cap rate
- 9.76%
- Cash-on-cash
- 12.40%
- DSCR
- 1.55
- GRM
- 4.7
CMA / ARV
No comps found within radius.
Projected returns pro-forma
-0.24% appreciation · 1.28% rent growth · sell at horizon
- IRR
- 9.0%
- Equity multiple
- 1.42×
- Total profit
- $20,346
- Equity at exit
- $48,710
- IRR
- 12.6%
- Equity multiple
- 2.25×
- Total profit
- $61,011
- Equity at exit
- $56,898
Cash invested: $49,000 (down + closing). Projections, not guarantees.
Landlord ↔ Tenant lean methodology
- Overall (STATE)
- 87 Strongly Landlord-Friendly
- State Florida
- 87 Strongly Landlord-Friendly · R+3
- County
- — inherits STATE
- City
- — inherits STATE
ZIP-level market 33437
- Home prices YoY
- -0.1%
- Rents YoY
- 1.3%
- Active inventory
- 479
- Price-to-rent
- 4.7×
Monthly cashflow live
- Estimated rent
- $3,117 high interval (Pro) →
- Mortgage (P&I)
- −$918
- Tax from tax record
- −$99 /mo · $1,187/yr
- Insurance
- −$73
- HOA
- −$867
- Vacancy / Maint / Mgmt
- −$655
- Net cashflow
- $506
Break-even live
UW: 25.0% down · 7.5% · 30yr · 1.5% tax · 5.0% vac · 8.0% maint · 8.0% mgmt
Financing live
Cash to close
- Down payment
- $43,750
- Closing costs
- $5,250
- Reserves months
- —
- Total cash needed
- —
Loan-product check · same deal, 3 products live
Conventional
25% down · 7.5% · 30yr
- Down + closing
- —
- Monthly P&I
- —
- Monthly cashflow
- —
- DSCR
- —
- Eligible?
- —
Personal DTI + credit; lowest rate.
DSCR
20% down · 8.5% · 30yr
- Down + closing
- —
- Monthly P&I
- —
- Monthly cashflow
- —
- DSCR
- —
- Eligible?
- —
No personal income docs; deal must DSCR.
Hard money
10% down · 12.0% · 12mo
- Down + closing
- —
- Monthly P&I
- —
- Monthly cashflow
- —
- DSCR
- —
- Eligible?
- —
Short-term bridge; refi at stabilization.
Rent comps 40 comps
| Address | Beds | Baths | Sqft | Rent | $/sqft | DOM | Units | Dist |
|---|---|---|---|---|---|---|---|---|
| 11115 Oakdale Rd Boynton Beach, FL | 3.0 | 2.0 | 1713 | $4,200 | $2.45 | 24d | 1 | 0.25mi |
| 10624 Tropic Palm Ave #202 Boynton Beach, FL | 3.0 | 2.0 | 1385 | $2,550 | $1.84 | 24d | 1 | 0.26mi |
| 10592 Tropic Palm Ave #202 Boynton Beach, FL | 2.0 | 2.0 | 1385 | $2,450 | $1.77 | 24d | 1 | 0.28mi |
| 10921 Royal Caribbean Cir Boynton Beach, FL | 3.0 | 2.0 | 1782 | $3,800 | $2.13 | 24d | 1 | 0.31mi |
| 10921 Royal Caribbean Cir Boynton Beach, FL | 3.0 | 2.0 | 1762 | $3,800 | $2.16 | 4d | 1 | 0.31mi |
| 10596 Sunset Isles Ct Boynton Beach, FL | 3.0 | 2.0 | 1769 | $4,500 | $2.54 | 24d | 1 | 0.50mi |
| 5217 Cedar Lake Rd Boynton Beach, FL | 1.0–3.0 | 1.0–2.0 | 1030 | $2,811 | $2.73 | 2d | 51 | 0.53mi |
| 11234 Green Lake Dr #102 Boynton Beach, FL | 2.0 | 2.0 | 1196 | $2,200 | $1.84 | 24d | 1 | 0.56mi |
| 5020 Ashley Lake Dr Boynton Beach, FL | 2.0 | 2.0 | 1002 | $2,394 | $2.39 | 3d | 1 | 0.57mi |
| 5020 Ashley Lake Dr Boynton Beach, FL | 2.0 | 2.0 | 1002 | $2,346 | $2.34 | 14d | 1 | 0.57mi |
| 11211 S Military Trl Boynton Beach, FL | 1.0–3.0 | 1.0–2.0 | 1033 | $2,688 | $2.60 | 1d | 31 | 0.57mi |
| 11282 Green Lake Dr #204 Boynton Beach, FL | 2.0 | 2.0 | 1196 | $3,750 | $3.14 | 24d | 1 | 0.57mi |
| 11230 Green Lake Dr #204 Boynton Beach, FL | 3.0 | 2.0 | 1549 | $3,000 | $1.94 | 12d | 1 | 0.61mi |
| 4944 Equestrian Cir Unit A Boynton Beach, FL | 2.0 | 2.0 | 1400 | $2,500 | $1.79 | 7d | 1 | 0.62mi |
| 4907 Boxwood Cir Boynton Beach, FL | 3.0 | 2.0 | 1731 | $2,900 | $1.68 | 24d | 1 | 0.63mi |
| 5570 Piping Rock Dr Boynton Beach, FL | 2.0 | 2.0 | 1478 | $2,850 | $1.93 | 24d | 1 | 0.64mi |
| 10187 Mangrove Dr #104 Boynton Beach, FL | 2.0 | 2.0 | 1260 | $2,350 | $1.87 | 24d | 1 | 0.65mi |
| 10056 Boynton Place Cir Boynton Beach, FL | 3.0 | 2.0 | 1253 | $2,950 | $2.35 | 2d | 1 | 0.74mi |
| 10056 Boynton Place Cir Boynton Beach, FL | 3.0 | 2.0 | 1253 | $3,000 | $2.39 | 24d | 1 | 0.74mi |
| 10492 Boynton Place Cir Boynton Beach, FL | 1.0–3.0 | 1.0–2.0 | 1017 | $2,839 | $2.79 | 1d | 19 | 0.90mi |
| 6037 Rossmoor Lakes Ct Boynton Beach, FL | 3.0 | 2.0 | 1617 | $4,700 | $2.91 | 24d | 1 | 0.92mi |
| 5895 Autumn Lake Ln Unit A Boynton Beach, FL | 3.0 | 2.0 | 1469 | $2,600 | $1.77 | 24d | 1 | 0.96mi |
| 6446 Aspen Glen Cir Boynton Beach, FL | 3.0 | 2.0 | 1800 | $3,800 | $2.11 | 20d | 1 | 0.98mi |
| 6446 Aspen Glen Cir Unit 6446 Boynton Beach, FL | 3.0 | 2.0 | 1800 | $4,000 | $2.22 | 24d | 1 | 0.98mi |
| 4419 Sanderling Cir E Boynton Beach, FL | 3.0 | 3.5 | 1866 | $10,000 | $5.36 | 24d | 1 | 0.98mi |
| 5133 Brisata Cir Unit P Boynton Beach, FL | 3.0 | 2.0 | 1374 | $2,800 | $2.04 | 24d | 1 | 1.09mi |
| 5750 Fairway Park Ct #101 Boynton Beach, FL | 3.0 | 2.0 | 1426 | $1,850 | $1.30 | 24d | 1 | 1.09mi |
| 6396 Park Lake Cir Boynton Beach, FL | 3.0 | 2.5 | 1422 | $2,950 | $2.07 | 15d | 1 | 1.10mi |
| 10390 Utopia Cir E Unit E Boynton Beach, FL | 3.0 | 2.0 | 1845 | $4,200 | $2.28 | 3d | 1 | 1.12mi |
| 10390 Utopia Cir E Unit 10390 Boynton Beach, FL | 3.0 | 2.0 | 1845 | $4,200 | $2.28 | 24d | 1 | 1.12mi |
| 5157 Floria Way Unit J Boynton Beach, FL | 3.0 | 2.0 | 1447 | $3,300 | $2.28 | 24d | 1 | 1.13mi |
| 5418 Firenze Dr Unit P Boynton Beach, FL | 2.0 | 2.0 | 1139 | $2,400 | $2.11 | 3d | 1 | 1.13mi |
| 9935 Pineapple Tree Dr #202 Boynton Beach, FL | 2.0 | 2.0 | 1008 | $2,575 | $2.55 | 15d | 1 | 1.14mi |
| 4249 Quail Ridge Dr N Unit A Boynton Beach, FL | 2.0 | 2.0 | 1212 | $4,000 | $3.30 | 24d | 1 | 1.15mi |
| 9900 Pineapple Tree Dr #106 Boynton Beach, FL | 2.0 | 2.0 | 1008 | $2,250 | $2.23 | 24d | 1 | 1.20mi |
| 5275 Europa Dr Unit I Boynton Beach, FL | 3.0 | 2.0 | 1282 | $2,500 | $1.95 | 2d | 1 | 1.23mi |
| 12118 Country Greens Blvd Boynton Beach, FL | 3.0 | 2.0 | 1566 | $3,000 | $1.92 | 11d | 1 | 1.27mi |
| 5155 Europa Dr Unit J Boynton Beach, FL | 3.0 | 2.0 | 1333 | $2,750 | $2.06 | 24d | 1 | 1.27mi |
| 4525 Nutmeg Tree Ln Unit A Boynton Beach, FL | 2.0 | 2.0 | 1404 | $3,000 | $2.14 | 24d | 1 | 1.28mi |
| 5675 Northpointe Ln Boynton Beach, FL | 2.0 | 2.5 | 1163 | $2,950 | $2.54 | 24d | 1 | 1.28mi |
HOA detail condo
- Monthly dues
- $867 · $10,404/yr
- Likely covers
- waterpoolgym
- Assessments
- None detected in remarks — confirm with the listing agent.
Listing history 14 events
-
2026-06-18days on market $175,000 Active 27 DOM
-
2026-06-17days on market $175,000 Active 26 DOM
-
2026-06-16days on market $175,000 Active 25 DOM
-
2026-06-15days on market $175,000 Active 24 DOM
-
2026-06-13days on market $175,000 Active 22 DOM
-
2026-06-09days on market $175,000 Active 18 DOM
-
2026-06-08days on market $175,000 Active 17 DOM
-
2026-06-07days on market $175,000 Active 16 DOM
-
2026-06-04days on market $175,000 Active 13 DOM
-
2026-06-03days on market $175,000 Active 12 DOM
-
2026-06-02days on market $175,000 Active 11 DOM
-
2026-06-01days on market $175,000 Active 10 DOM
-
2026-05-31days on market $175,000 Active 9 DOM
-
2026-05-22$175,000 Active
ⓘ Source: listings_history table (triggers on properties + properties_extension) + one-shot
backfill from property_details.listing_events for pre-trigger history.
Tax reassessment forecast FL · Resets to sale price
- Current annual tax
- $1,187 · $99/mo
- Projected year-2 tax
- $1,452 · $121/mo
- Expected delta
- +$266/yr (+$22/mo · 22.4%)
ⓘ Screening estimate from a state-policy table — verify with the county assessor before closing.
Climate risk First Street
- Flood 1/10 Low FEMA zone X (unshaded) · 0% chance over 30 yrs
- Wildfire 1/10 Low
- Heat 9/10 Extreme 7 d/yr ≥106°F today · 25 d/yr by 30 yrs out
- Wind 10/10 Extreme 99% chance of damaging wind over 30 yrs
- Air quality 2/10 Low 1 unhealthy d/yr today · 2 by 30 yrs out
Nearby sold comps map
Loading sold comps map…
Walkable amenities ~0.75 mi
Loading nearby amenities…
Taxation est. · year 1
- Rental income
- $37,409
- − Mortgage interest
- −$9,803
- − Property taxes
- −$1,187
- − Insurance
- −$875
- − Repairs & maintenance
- −$2,993
- − Management
- −$2,993
- − HOA
- −$10,404
- − Depreciation
- −$5,091
- Taxable income
- $4,064
- Est. tax owed @ 24.0%
- −$975
- After-tax cash flow
- $5,099/yr
For passive investors: Depreciation is non-cash, so a rental often shows a tax loss while cash-flowing — sheltering income. Rental losses are passive: they offset passive income freely, and up to $25,000/yr can offset ordinary (W-2) income if you actively participate and your MAGI is under $100k (phasing out to $0 by $150k); unused losses carry forward. On sale, claimed depreciation is recaptured at up to 25%, and gains may owe capital-gains tax (a 1031 exchange can defer both). Figures are a year-1 estimate at your 24.0% rate — not tax advice; consult a CPA.
Schools (NCES district)
- District
- Palm Beach
- NCES district ID
- 1201500
- Math proficiency
- 46% ▼ -16.00%
- Reading proficiency
- 53% ▼ -4.00%
- Median HH income
- $53,943
- Composite
- 42.72/100
- National rank
- #3160
- State rank
- #34 of 73 in FL
Livability — Golf
- Score
- 63/100
- State rank
- #703
- US rank
- #14941
Category grades
Schools grade is shown separately in the Schools card above.
Census & demographics
- County
- Palm Beach County · 1,438,312 people
- Metro
- Miami-Fort Lauderdale-Pompano Beach, FL
- Population (ZIP)
- 37,229
- Household income
- $80,710
- Rent vs Own
- Severe rent burden
- 902.0
Population outlook (Palm Beach County) Hauer SSP2
- Today (2025)
- 1,637,487 people
- By 2030
- 1,743,255 · +6.5%
- By 2040
- 1,948,712 · +19.0%
- By 2050
- 2,132,979 · +30.3%
- By 2075
- 2,530,027 · +54.5%
- By 2100
- 2,706,979 · +65.3%
Race, ethnicity, and origin ACS 2023
- Neighborhood character
- Predominantly White (68%)
- Race & ethnicity
- White 68% Two or more races 13% Hispanic / Latino 12% Black 10% Asian 3%
- Hispanic origin (detail)
- Mexican 1% Puerto Rican 2% Cuban 1% Dominican 1%
- Common ancestry
- Scotch-Irish 8% Romanian 8% Hispanic 6%
- Foreign-born
- 18% · Canada, Jamaica, Vietnam
- Languages at home
- 78% English-only · Spanish 10% French/Haitian/Cajun 6% Other Indo-European 2%
Political lean MEDSL · Palm Beach
- 2024 margin
- Toss-up / Even · D 50.0% · R 49.2%
- 2008→2024 swing
- -22.1pp toward R · 2008: 22.9pp · 2024: 0.8pp
- All cycles
- 2024: D+0.8 2020: D+12.8 2016: D+15.3 2012: D+17.0 2008: D+22.9
Not yet ingested
- Civics
- —
Market trends
- HPI YoY
- ▼ -0.24%
- Current HPI
- 257.5891
- Rent YoY
- ▲ 1.28%
- Metro
- Miami-Fort Lauderdale-Pompano Beach, FL
- State GDP YoY
- ▲ 3.28%
- F500 in state
- 36
Industry mix (Fortune 500 HQ in FL)
| Industry | F500 HQs | Revenue |
|---|---|---|
| Industrial Technology | 2 | $29B |
|
||
| Insurance | 2 | $17B |
|
||
| Retail | 1 | $60B |
|
||
| Technology Distribution | 1 | $58B |
|
||
| Homebuilding | 1 | $35B |
|
||
| Technology Manufacturing | 1 | $35B |
|
||
Price history
1 event — show timeline
- 2026-05-22 Listed $175,000 Beaches MLS
Property tax history
-0.9%/yrLatest (2025): $1,187 · +4.2% YoY. Source: county tax records.
Cash-flow waterfall
monthlySold comps — $/sqft
last 12 mo · ≤1 miLoading sold comps…