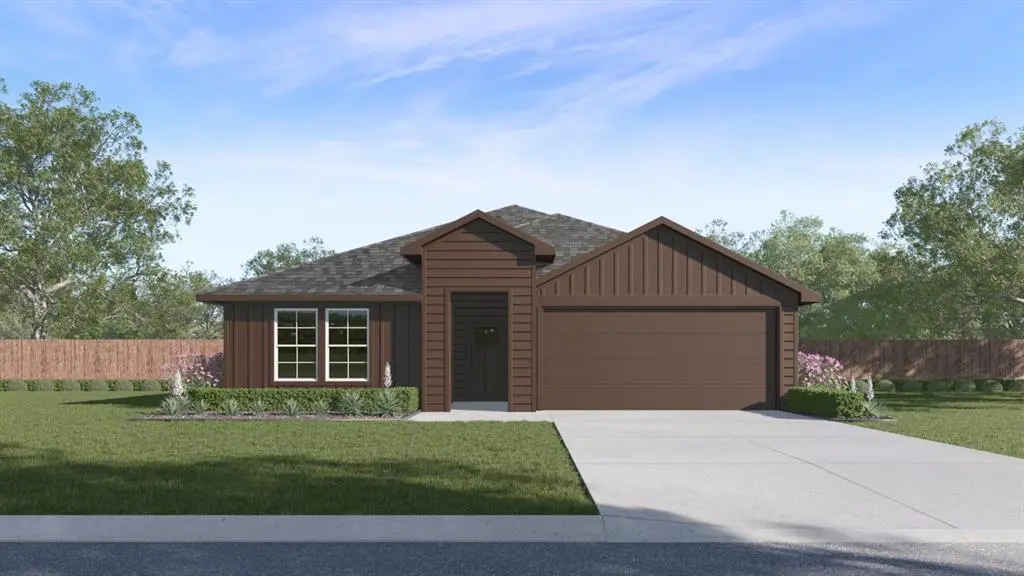
1202 Breezy Oak Dr · Josephine, TX
Flood risk No data
- FEMA flood zone
- —
- Chance of flooding over 30 yrs
- —
- Est. flood insurance / yr
- —
Fire risk No data
- Est. fire insurance / yr
- —
Heat risk No data
- Hot days now (above threshold)
- —
- Hot days in 30 yrs
- —
Wind risk No data
- Chance of severe wind over 30 yrs
- —
Air-quality risk No data
- Unhealthy air days now
- —
- Unhealthy air days in 30 yrs
- —
Risk factors via First Street. Map © Google.
Why this score? — see what drove the D- grade
The composite is a weighted blend of 9 inputs, each scored 0–100. Each bar is that input's sub-score; the figure is the points it added to the 100-point composite (weight × sub-score).
- Appreciation +10.0/10.0
- Cash flow +6.9/30.0
- ARV discount +6.6/15.0
- Schools +3.2/10.0
- Livability +3.0/5.0
- Rent growth +2.5/5.0
- Condition / age +2.5/5.0
- 1% rule +2.0/10.0
- DSCR +1.1/10.0
$296,990
🖨 Deal sheet (PDF) 📄 Offer letter ✓ Due diligence
Listing remarks
New! Spacious open floor plan! Four bedrooms, two full baths, with covered patio. Home includes, large island kitchen, granite counters throughout, LED lighting, full sprinkler system, professionally engineered post tension foundation, and much more! Waverly Estates is a new D. R. Horton community in Josephine. The community is conveniently located just minutes from Interstate 30, providing easy access to Rockwall and the DFW Metroplex. Waverly Estates offers a variety of single-family homes to choose from. If you're looking for a new home in the Josephine area, Waverly Estates is the perfect community for you.
Key facts
- Open floor plan
- Led lighting
- Large island kitchen
Tags
Property features AI
Finance
- Other: Builder listing; possession upon completion or at closing/funding
- Financial info: Listing accepts Cash, Conventional, FHA, USDA, and VA financing; No second mortgage indicated
- HOA & community: Mandatory association; Semi-annual HOA fee (includes full use of facilities); HOA management: AAM
Exterior
- Parking: Attached 2-car garage; Covered parking for 2 vehicles
- Security: Smoke detectors; Carbon monoxide detectors
- Utilities: City water; City sewer; Property in a municipal utility district; Energy-efficient features including upgraded attic insulation, HVAC, insulation, efficient lighting, programmable thermostat, and efficient windows
- Home design: Single family residence; One level; New construction - incomplete (year built 2026); Not attached to another property; Subdivision: Waverly Estates
- Construction: Composition roof; Slab foundation; New construction
- Exterior features: Wood fencing; Less than 0.5 acre lot
Interior
- Kitchen: Dishwasher; Disposal; Electric range; Microwave; Water line to refrigerator; Breakfast bar; Built-in cabinets; Natural stone/granite counters
- Bedrooms: Primary bedroom on level 1 with ensuite bath and walk-in closet; Three additional bedrooms on level 1 (split bedroom plan)
- Flooring: Carpet; Laminate
- Bathrooms: Two full bathrooms
- Heating & cooling: Central heating (natural gas); Central air (electric)
- Interior features: Open floorplan; Eat-in kitchen; Kitchen island; Granite counters; Pantry; Decorative lighting; Cable TV available; High speed internet available
- Laundry & utility: No specific laundry details provided
Neighborhood map
What this means for you Summary
Snapshot
- This is a 4-bed/2.0-bath single-family listed at $297k.
Deal economics
- At list price, monthly cash flow is $-453 ($-5k/yr) — negative.
- To cash-flow at today's rent, offer at most $231k (22.1% below list).
- To meet the 1% rule (rent ≥ 1% of price), the offer needs to be $208k (29.9% below list).
- Recommended offer: $208k (29.9% below list) — sets the bar for 1% rule.
Location & tenants
- Location reads 60/100 on livability (#1,076 in TX) — a middle-class / working-renter tenant base. Strengths: cost of living A+, housing A+, crime A-; Watch: schools F, amenities F, commute F.
- Community ISD (rural): math 30% / reading 38% proficiency, ranked #479 of 826 in TX (top 58%) — families likely to look elsewhere, expect single-tenant / working-renter base with shorter leases.
- Market conditions: 421 active listings in the ZIP; 31 comparable units currently listed for rent nearby; rentals at typical pace (median 14d on market — plan ~3-4 weeks tenant-placement turnaround); 19,194 units permitted in Collin County in 2024 (3,988 in 5+ unit buildings).
Forward outlook
- In year one you build about $32k of equity ($2k loan paydown + $30k appreciation (10.0% local appreciation)).
- Collin County population projected at +60% by 2050 — long-run rental-demand tailwind backs the buy-and-hold thesis.
- By year 2, paydown + projected appreciation supports a ~$51k cash-out refi (75% LTV) — recoverable capital for the next deal without selling this one.
Negotiation context
- It's been on market 26 days — a 2% lower offer ($293k) is reasonable based on typical stale-listing flexibility.
Questions for the listing agent
- What do current leases actually rent for vs. the listed asking? Can we see a recent rent roll and the last 12 months of T-12 income?
- What does the HOA fee cover, when was the last increase, and are there any pending special assessments or reserve-fund shortfalls?
- Is there a deadline driving the sale (1031 exchange, divorce, estate, relocation)? That informs how much negotiation room exists.
- Schools are F-rated, which usually means shorter tenancies and higher turnover. Who's the typical renter profile here, and what's been the actual vacancy rate?
- The area grade is low — what's the realistic commute time and amenity access for the typical tenant pool here? Any planned neighborhood developments (good or bad) we should know about?
- What's the average days-on-market for RENTAL listings here right now (not sales)? A rising rental-DOM trend means longer vacancies and softer asking-rent achievability than the comps imply.
- What's the recent tenant-quality profile in this submarket — average credit score on applications, eviction rate, late-payment / NSF rate, and stable-employment percentage? A property-management company in the area should have these aggregated.
- How much new for-sale + rental construction is in the pipeline within 1–3 miles? Heavy new supply typically softens prices + rents 12–24 months out; constrained supply supports both.
Investment metrics
- 1% rule
- 0.70% ✗
- Cap rate
- 4.46%
- Cash-on-cash
- -6.54%
- DSCR
- 0.71
- GRM
- 11.9
CMA / ARV
- ARV (on-the-fly)
- $291,456
- Comps found
- 12
Show comp detail 12 sales within ~0.75 mi
| Address | Dist | Beds/Ba | Sqft | Sold | Price | $/sf | Match |
|---|---|---|---|---|---|---|---|
| 1133 Bristlecone Dr | 0.05mi | 4/2.0 | 2,024 (0%) | 0mo | $324,990 | $161 | 97 |
| 512 Saddle Blanket Dr | 0.21mi | 4/2.0 | 2,024 (0%) | 2mo | $291,535 | $144 | 88 |
| 516 Saddle Blanket Dr | 0.24mi | 4/3.0 | 2,034 (+0%) | 1mo | $301,490 | $148 | 84 |
| 205 Weathered Way | 0.36mi | 4/2.0 | 2,042 (+1%) | 2mo | $342,990 | $168 | 80 |
| 505 Silver Birch Dr | 0.16mi | 5/2.0 (+1) | 1,938 (-4%) | 0mo | $269,990 | $139 | 80 |
| 407 Saddle Blanket Dr | 0.11mi | 4/2.0 | 1,801 (-11%) | 2mo | $273,990 | $152 | 75 |
| 506 Saddle Blanket Dr | 0.18mi | 4/2.0 | 1,801 (-11%) | 1mo | $290,990 | $162 | 72 |
| 305 Silo Cir | 0.58mi | 4/2.0 | 2,074 (+2%) | 2mo | $259,999 | $125 | 67 |
| 1307 Community Way | 0.56mi | 4/2.0 | 2,104 (+4%) | 2mo | $265,000 | $126 | 65 |
| 500 Northern Red Dr | 0.37mi | 4/2.0 | 2,314 (+14%) | 1mo | $303,490 | $131 | 58 |
| 708 Wisteria Dr | 0.63mi | 4/2.5 | 2,155 (+6%) | 1mo | $255,000 | $118 | 57 |
| 503 Silo Cir | 0.73mi | 4/2.0 | 1,732 (-14%) | 2mo | $249,900 | $144 | 40 |
Match score weights: distance 35% · size 25% · config 20% · recency 20%. Top-matched comps best support the ARV.
Projected returns pro-forma
10.0% appreciation · 3.0% rent growth · sell at horizon
- IRR
- 19.7%
- Equity multiple
- 2.60×
- Total profit
- $132,943
- Equity at exit
- $267,552
- IRR
- 18.1%
- Equity multiple
- 5.98×
- Total profit
- $414,314
- Equity at exit
- $576,986
Cash invested: $83,157 (down + closing). Projections, not guarantees.
Landlord ↔ Tenant lean methodology
- Overall (STATE)
- 87 Strongly Landlord-Friendly
- State Texas
- 87 Strongly Landlord-Friendly · R+5
- County
- — inherits STATE
- City
- — inherits STATE
ZIP-level market 75173
- Home prices YoY
- 3.1%
- Active inventory
- 421
- Price-to-rent
- 11.9×
Monthly cashflow live
- Estimated rent
- $2,083 high interval (Pro) →
- Mortgage (P&I)
- −$1,557
- Tax est. 1.5%
- −$371 /mo · $4,455/yr
- Insurance
- −$124
- HOA
- −$46
- Vacancy / Maint / Mgmt
- −$437
- Net cashflow
- $-453
Break-even live
Sensitivity live
| Price | -10% $-248 | -5% $-351 | +0% $-453 | +5% $-556 | +10% $-658 |
|---|---|---|---|---|---|
| Rent | -10% $-618 | -5% $-535 | +0% $-453 | +5% $-371 | +10% $-289 |
| Rate | -1.0pp $-304 | -0.5pp $-378 | base $-453 | +0.5pp $-530 | +1.0pp $-608 |
UW: 25.0% down · 7.5% · 30yr · 1.5% tax · 5.0% vac · 8.0% maint · 8.0% mgmt
Financing live
Cash to close
- Down payment
- $74,248
- Closing costs
- $8,910
- Reserves months
- —
- Total cash needed
- —
Loan-product check · same deal, 3 products live
Conventional
25% down · 7.5% · 30yr
- Down + closing
- —
- Monthly P&I
- —
- Monthly cashflow
- —
- DSCR
- —
- Eligible?
- —
Personal DTI + credit; lowest rate.
DSCR
20% down · 8.5% · 30yr
- Down + closing
- —
- Monthly P&I
- —
- Monthly cashflow
- —
- DSCR
- —
- Eligible?
- —
No personal income docs; deal must DSCR.
Hard money
10% down · 12.0% · 12mo
- Down + closing
- —
- Monthly P&I
- —
- Monthly cashflow
- —
- DSCR
- —
- Eligible?
- —
Short-term bridge; refi at stabilization.
Rent comps 31 comps
| Address | Beds | Baths | Sqft | Rent | $/sqft | DOM | Units | Dist |
|---|---|---|---|---|---|---|---|---|
| 503 Saddle Blanket Dr Nevada, TX | 4.0 | 3.0 | 2077 | $2,190 | $1.05 | 45d | 1 | 0.12mi |
| 504 Saddle Blanket Dr Nevada, TX | 4.0 | 2.0 | 1649 | $1,949 | $1.18 | 16d | 1 | 0.14mi |
| 504 Saddle Blanket Dr Nevada, TX | 4.0 | 2.0 | 1649 | $1,925 | $1.17 | 7d | 1 | 0.14mi |
| 319 Plum Dr Nevada, TX | 4.0 | 2.0 | 1587 | $1,899 | $1.20 | 11d | 1 | 0.48mi |
| 1307 Community Way Royse City, TX | 4.0 | 2.0 | 2104 | $2,100 | $1.00 | 45d | 1 | 0.58mi |
| 305 Silo Cir Royse City, TX | 4.0 | 2.0 | 2074 | $2,100 | $1.01 | 25d | 1 | 0.60mi |
| 311 Milo Way Royse City, TX | 4.0 | 2.0 | 2074 | $2,200 | $1.06 | 7d | 1 | 0.65mi |
| 802 Turnbuckle Ct Royse City, TX | 4.0 | 2.0 | 1577 | $1,849 | $1.17 | 45d | 1 | 0.74mi |
| 1004 Cotton Gin Ct Royse City, TX | 4.0 | 2.0 | 1875 | $1,850 | $0.99 | 14d | 1 | 0.84mi |
| 1007 Cotton Gin Ct Royse City, TX | 3.0 | 2.0 | 1611 | $2,050 | $1.27 | 45d | 1 | 0.85mi |
| 801 Meadow Creek Ln Josephine, TX | 4.0 | 2.0 | 1757 | $2,500 | $1.42 | 6d | 1 | 0.85mi |
| 508 Windrow Dr Royse City, TX | 3.0 | 2.0 | 1533 | $1,875 | $1.22 | 25d | 1 | 0.85mi |
| 508 Windrow Dr Royse City, TX | 3.0 | 2.0 | 1533 | $1,900 | $1.24 | 45d | 1 | 0.85mi |
| 722 Windmill St Josephine, TX | 4.0 | 2.0 | 1568 | $2,190 | $1.40 | 3d | 1 | 0.86mi |
| 800 Windmill St Josephine, TX | 4.0 | 2.0 | 1843 | $2,100 | $1.14 | 8d | 1 | 0.87mi |
| 800 Windmill St Josephine, TX | 4.0 | 2.0 | 1843 | $2,100 | $1.14 | 0d | 1 | 0.87mi |
| 1503 Cotton Gin Ct Royse City, TX | 3.0 | 2.0 | 1566 | $2,200 | $1.40 | 45d | 1 | 0.89mi |
| 315 Pine Hollow Way Josephine, TX | 4.0 | 3.0 | 2212 | $2,300 | $1.04 | 8d | 1 | 0.90mi |
| 1501 Bridle Dr Josephine, TX | 4.0 | 2.0 | 2081 | $1,975 | $0.95 | 45d | 1 | 0.93mi |
| 1210 Honeysuckle Dr Josephine, TX | 5.0 | 2.0 | 1995 | $2,100 | $1.05 | 14d | 1 | 0.96mi |
| 813 Cottonwood Way Royse City, TX | 4.0 | 3.0 | 2347 | $2,350 | $1.00 | 14d | 1 | 0.98mi |
| 717 Cottonwood WAY Josephine, TX | 4.0 | 3.0 | 2073 | $2,125 | $1.03 | 0d | 1 | 1.03mi |
| 306 E Cook St Josephine, TX | 3.0 | 2.0 | 1817 | $2,100 | $1.16 | 0d | 1 | 1.03mi |
| 711 Cistern Way Royse City, TX | 4.0 | 2.0 | 2081 | $1,975 | $0.95 | 8d | 1 | 1.05mi |
| 1208 Fieldstone Ct Royse City, TX | 4.0 | 2.0 | 1835 | $2,000 | $1.09 | 45d | 1 | 1.05mi |
| 1413 Thunder Canyon Way Josephine, TX | 5.0 | 2.0 | 2006 | $2,500 | $1.25 | 45d | 1 | 1.12mi |
| 1910 Bailer Way Royse City, TX | 3.0 | 2.0 | 1592 | $1,995 | $1.25 | 25d | 1 | 1.34mi |
| 2000 Bailer Way Royse City, TX | 3.0 | 2.5 | 1947 | $2,500 | $1.28 | 4d | 1 | 1.35mi |
| 2008 Bailer Way Royse City, TX | 3.0 | 2.0 | 1509 | $1,975 | $1.31 | 20d | 1 | 1.37mi |
| 816 Country Rd Royse City, TX | 4.0 | 2.5 | 2080 | $2,550 | $1.23 | 0d | 1 | 1.41mi |
| 903 Shear Dr Royse City, TX | 3.0 | 2.5 | 1898 | $2,000 | $1.05 | 4d | 1 | 1.41mi |
HOA detail
- Monthly dues
- $46 · $552/yr
Listing history 17 events
-
2026-06-21days on market $296,990 Active 26 DOM
-
2026-06-18days on market $296,990 Active 23 DOM
-
2026-06-17days on market $296,990 Active 22 DOM
-
2026-06-16days on market $296,990 Active 21 DOM
-
2026-06-15days on market $296,990 Active 20 DOM
-
2026-06-13days on market $296,990 Active 18 DOM
-
2026-06-13days on market $296,990 Active 17 DOM
-
2026-06-10price $296,990 Active 14 DOM
-
2026-06-09days on market $326,990 Active 14 DOM
-
2026-06-08days on market $326,990 Active 13 DOM
-
2026-06-07days on market $326,990 Active 12 DOM
-
2026-06-04days on market $326,990 Active 9 DOM
-
2026-06-03days on market $326,990 Active 8 DOM
-
2026-06-02days on market $326,990 Active 7 DOM
-
2026-06-01days on market $326,990 Active 6 DOM
-
2026-05-31days on market $326,990 Active 5 DOM
-
2026-05-26$326,990 Active
ⓘ Source: listings_history table (triggers on properties + properties_extension) + one-shot
backfill from property_details.listing_events for pre-trigger history.
Nearby sold comps map
Loading sold comps map…
Walkable amenities ~0.75 mi
Loading nearby amenities…
Taxation est. · year 1
- Rental income
- $24,991
- − Mortgage interest
- −$16,636
- − Property taxes
- −$4,455
- − Insurance
- −$1,485
- − Repairs & maintenance
- −$1,999
- − Management
- −$1,999
- − HOA
- −$552
- − Depreciation
- −$8,640
- Taxable loss
- −$10,775
- Est. tax savings @ 24.0%
- +$2,586
- After-tax cash flow
- $-2,852/yr
For passive investors: Depreciation is non-cash, so a rental often shows a tax loss while cash-flowing — sheltering income. Rental losses are passive: they offset passive income freely, and up to $25,000/yr can offset ordinary (W-2) income if you actively participate and your MAGI is under $100k (phasing out to $0 by $150k); unused losses carry forward. On sale, claimed depreciation is recaptured at up to 25%, and gains may owe capital-gains tax (a 1031 exchange can defer both). Figures are a year-1 estimate at your 24.0% rate — not tax advice; consult a CPA.
Schools (NCES district)
- District
- Community ISD
- NCES district ID
- 4814850
- Math proficiency
- 30% ▼ -23.00%
- Reading proficiency
- 38% ▼ -11.00%
- Median HH income
- $71,841
- Composite
- 31.58/100
- National rank
- #5951
- State rank
- #479 of 826 in TX
Livability — Josephine
- Score
- 60/100
- State rank
- #1076
- US rank
- #19105
Category grades
Schools grade is shown separately in the Schools card above.
Census & demographics
- Population (ZIP)
- 9,284
Population outlook (Collin County) Hauer SSP2
- Today (2025)
- 1,210,074 people
- By 2030
- 1,358,201 · +12.2%
- By 2040
- 1,654,061 · +36.7%
- By 2050
- 1,937,359 · +60.1%
- By 2075
- 2,567,039 · +112.1%
- By 2100
- 2,952,048 · +144.0%
Race, ethnicity, and origin ACS 2023
- Neighborhood character
- Majority White (65%)
- Race & ethnicity
- White 65% Hispanic / Latino 28% Two or more races 15% Black 2% Native American 1%
- Hispanic origin (detail)
- Mexican 26%
- Common ancestry
- Slovak 2% Serbian 1% Iranian 1%
- Foreign-born
- 17% · Canada, Jamaica
- Languages at home
- 74% English-only · Spanish 24% Arabic 1%
Political lean MEDSL · Collin
- 2024 margin
- R (+11.1) · D 43.1% · R 54.3% · Other 2.6%
- 2008→2024 swing
- +14.4pp toward D · 2008: -25.6pp · 2024: -11.1pp
- All cycles
- 2024: R+11.1 2020: R+4.3 2016: R+17.0 2012: R+31.6 2008: R+25.6
Not yet ingested
- Civics
- —
Market trends
- HPI YoY
- ▲ 10.09%
- Current HPI
- 331.12
- Rent YoY
- —
- Metro
- —
- State GDP YoY
- ▲ 3.95%
- F500 in state
- 110
Industry mix (Fortune 500 HQ in TX)
| Industry | F500 HQs | Revenue |
|---|---|---|
| Energy | 16 | $1,198B |
|
||
| Technology | 5 | $198B |
|
||
| Engineering / Construction | 4 | $72B |
|
||
| Energy Services | 3 | $60B |
|
||
| Utilities | 3 | $41B |
|
||
| Healthcare | 2 | $330B |
|
||
Price history
1 event — show timeline
- 2026-05-26 Listed $326,990 NTREIS
Cash-flow waterfall
monthlySold comps — $/sqft
last 12 mo · ≤1 miLoading sold comps…