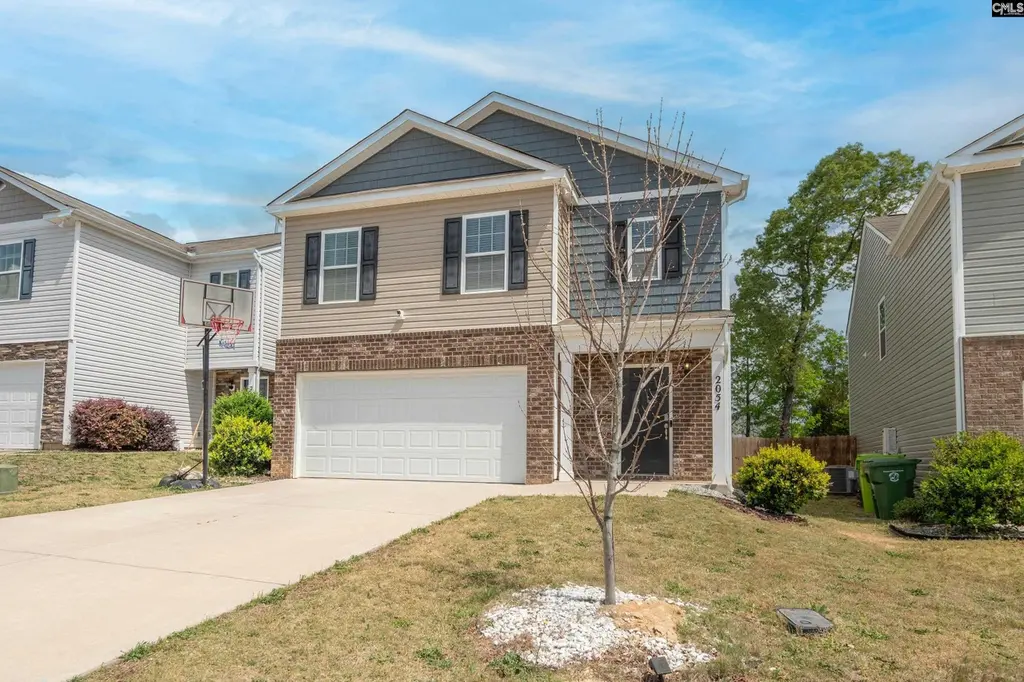
2054 Elmridge Rd · Columbia, SC
Flood risk No data
- FEMA flood zone
- —
- Chance of flooding over 30 yrs
- —
- Est. flood insurance / yr
- —
Fire risk No data
- Est. fire insurance / yr
- —
Heat risk No data
- Hot days now (above threshold)
- —
- Hot days in 30 yrs
- —
Wind risk No data
- Chance of severe wind over 30 yrs
- —
Air-quality risk No data
- Unhealthy air days now
- —
- Unhealthy air days in 30 yrs
- —
Risk factors via First Street. Map © Google.
Why this score? — see what drove the D grade
The composite is a weighted blend of 9 inputs, each scored 0–100. Each bar is that input's sub-score; the figure is the points it added to the 100-point composite (weight × sub-score).
- Cash flow +10.1/30.0
- ARV discount +7.5/15.0
- Appreciation +5.0/10.0
- Livability +3.9/5.0
- 1% rule +3.1/10.0
- DSCR +2.9/10.0
- Schools +2.6/10.0
- Rent growth +2.5/5.0
- Condition / age +2.5/5.0
$285,000
🖨 Deal sheet (PDF) 📄 Offer letter ✓ Due diligence
Listing remarks
Home features Solar power, enjoy very low if any utility bills, equipment will be paid off at closing by the seller for the right purchase price. Great floor plan, 5 bedrooms, one bedroom and full bath are on the main floor, all other bedrooms and 2 other bathrooms are on the 2nd floor with a loft area which is great for home schooling, work from home, home gym or living space. Kitchen, dining room and living room are all open, the walk-in Pantry will be your pride and joy! Slider leads to fenced back yard, Community has sidewalks, within minutes to the VA hospital, USC Stadium, downtown Columbia and only minutes to Fort Jackson. Easy access to I-77 for a quick commute to Charlotte! Locatio
Key facts
- Fenced back yard
- Loft area
- 2 garage spots
Tags
Property features AI
Finance
- Other: Directions: East on Leesburg Road to Trotter, head south to community on the left
- HOA & community: Property is part of an association
Exterior
- Parking: Attached garage with 2 spaces
- Utilities: Public sewer; Public water; Electric service
- Home design: Two-story house; House faces west
- Construction: Slab foundation
- Exterior features: Vinyl exterior; Wood privacy fence in rear; Paved road access; Public water
Interior
- Kitchen: Kitchen island; Pantry; Granite countertops; Tiled backsplash
- Bedrooms: Master bedroom on second floor; Additional bedrooms on main and second floors
- Flooring: Luxury vinyl plank flooring in living room and kitchen
- Bathrooms: Three full bathrooms total; One main full bathroom; Two secondary full bathrooms
- Heating & cooling: Central cooling; Central electric heating
- Interior features: Fireplace in living room; Ceiling fan(s); Recessed lighting; Built-in microwave; Electric water heater; Free-standing range
- Laundry & utility: Electric water heater (listed under equipment)
Neighborhood map
What this means for you Summary
Snapshot
- This is a 5-bed/3.0-bath single-family listed at $285k.
Deal economics
- At list price, monthly cash flow is $-165 ($-2k/yr) — negative.
- To cash-flow at today's rent, offer at most $261k (8.4% below list).
- To meet the 1% rule (rent ≥ 1% of price), the offer needs to be $232k (18.6% below list).
- Recommended offer: $232k (18.6% below list) — sets the bar for 1% rule.
Location & tenants
- Location reads 78/100 on livability (#18 in SC, #2,436 nationally) — a middle-class / working-renter tenant base. Strengths: amenities A+, commute A+, cost of living A+; Watch: employment D, crime F.
- Richland 01 (urban): math 26% / reading 36% proficiency, ranked #54 of 80 in SC (top 68%) — families likely to look elsewhere, expect single-tenant / working-renter base with shorter leases; 64% free/reduced lunch — lower-income household profile, screen leases tightly.
- Zoned schools: Mill Creek Elementary (math 22% / reading 22%, grade F, #475 of 597 statewide, top 81%, 339 students, 100% FRL); Lower Richland High (math 5% / reading 64%, grade F, #185 of 196 statewide, top 94%, 1,244 students, 100% FRL) — zoned schools average 100% FRL vs 64% district-wide (36 pts higher); higher-poverty schools than district average — tighter screening recommended.
- Market conditions: 1 active listings in the ZIP; 5 comparable units currently listed for rent nearby; rentals at typical pace (median 16d on market — plan ~3-4 weeks tenant-placement turnaround); 3,472 units permitted in Richland County in 2024 (1,096 in 5+ unit buildings).
Forward outlook
- In year one you build about $11k of equity ($2k loan paydown + $9k appreciation (3.0% local appreciation)).
- Richland County population projected at +30% by 2050 — long-run rental-demand tailwind backs the buy-and-hold thesis.
- By year 4, paydown + projected appreciation supports a ~$36k cash-out refi (75% LTV) — recoverable capital for the next deal without selling this one.
Negotiation context
- It's been on market 78 days — a 6% lower offer ($268k) is reasonable based on typical stale-listing flexibility.
- 2 sale attempts since 5y ago with the ask held roughly flat each time — persistent listings suggest the price (not the market) is what's stuck; bring a comps-based counter.
Questions for the listing agent
- What do current leases actually rent for vs. the listed asking? Can we see a recent rent roll and the last 12 months of T-12 income?
- It's been on market 78 days. Have you received any prior offers? Is the seller open to a 19% concession, seller financing, or rate buy-down credit?
- What does the HOA fee cover, when was the last increase, and are there any pending special assessments or reserve-fund shortfalls?
- Why hasn't it sold? Are there any deal-killer items the seller is aware of (foundation, flood, title, zoning, code violations)?
- Is there a deadline driving the sale (1031 exchange, divorce, estate, relocation)? That informs how much negotiation room exists.
- Schools are D-rated, which usually means shorter tenancies and higher turnover. Who's the typical renter profile here, and what's been the actual vacancy rate?
- Crime grade is F in this area — have there been break-ins, vandalism, or insurance claims at this property in the last 3 years? What carrier currently insures it and at what premium?
- The area grade is low — what's the realistic commute time and amenity access for the typical tenant pool here? Any planned neighborhood developments (good or bad) we should know about?
- What's the average days-on-market for RENTAL listings here right now (not sales)? A rising rental-DOM trend means longer vacancies and softer asking-rent achievability than the comps imply.
- What's the recent tenant-quality profile in this submarket — average credit score on applications, eviction rate, late-payment / NSF rate, and stable-employment percentage? A property-management company in the area should have these aggregated.
- How much new for-sale + rental construction is in the pipeline within 1–3 miles? Heavy new supply typically softens prices + rents 12–24 months out; constrained supply supports both.
Investment metrics
- 1% rule
- 0.81% ✗
- Cap rate
- 5.60%
- Cash-on-cash
- -2.48%
- DSCR
- 0.89
- GRM
- 10.2
CMA / ARV
No comps found within radius.
Projected returns pro-forma
3.0% appreciation · 3.0% rent growth · sell at horizon
- IRR
- 5.2%
- Equity multiple
- 1.30×
- Total profit
- $23,891
- Equity at exit
- $128,148
- IRR
- 8.3%
- Equity multiple
- 2.25×
- Total profit
- $99,874
- Equity at exit
- $197,492
Cash invested: $79,800 (down + closing). Projections, not guarantees.
Landlord ↔ Tenant lean methodology
- Overall (STATE)
- 90 Strongly Landlord-Friendly
- State South Carolina
- 90 Strongly Landlord-Friendly · R+6
- County
- — inherits STATE
- City
- — inherits STATE
ZIP-level market 29209-4363
- Active inventory
- 1
- Price-to-rent
- 10.2×
Monthly cashflow live
- Estimated rent
- $2,321 high interval (Pro) →
- Mortgage (P&I)
- −$1,495
- Tax est. 1.5%
- −$356 /mo · $4,275/yr
- Insurance
- −$119
- HOA
- −$29
- Vacancy / Maint / Mgmt
- −$487
- Net cashflow
- $-165
Break-even live
Sensitivity live
| Price | -10% $32 | -5% $-66 | +0% $-165 | +5% $-263 | +10% $-362 |
|---|---|---|---|---|---|
| Rent | -10% $-348 | -5% $-256 | +0% $-165 | +5% $-73 | +10% $19 |
| Rate | -1.0pp $-21 | -0.5pp $-92 | base $-165 | +0.5pp $-239 | +1.0pp $-314 |
UW: 25.0% down · 7.5% · 30yr · 1.5% tax · 5.0% vac · 8.0% maint · 8.0% mgmt
Financing live
Cash to close
- Down payment
- $71,250
- Closing costs
- $8,550
- Reserves months
- —
- Total cash needed
- —
Loan-product check · same deal, 3 products live
Conventional
25% down · 7.5% · 30yr
- Down + closing
- —
- Monthly P&I
- —
- Monthly cashflow
- —
- DSCR
- —
- Eligible?
- —
Personal DTI + credit; lowest rate.
DSCR
20% down · 8.5% · 30yr
- Down + closing
- —
- Monthly P&I
- —
- Monthly cashflow
- —
- DSCR
- —
- Eligible?
- —
No personal income docs; deal must DSCR.
Hard money
10% down · 12.0% · 12mo
- Down + closing
- —
- Monthly P&I
- —
- Monthly cashflow
- —
- DSCR
- —
- Eligible?
- —
Short-term bridge; refi at stabilization.
Rent comps 5 comps
| Address | Beds | Baths | Sqft | Rent | $/sqft | DOM | Units | Dist |
|---|---|---|---|---|---|---|---|---|
| 352 Sandbach Rd Columbia, SC | 4.0 | 2.5 | 1976 | $2,300 | $1.16 | 15d | 1 | 0.25mi |
| 331 Crooked Pine Ct Columbia, SC | 4.0 | 2.5 | 1775 | $2,133 | $1.20 | 20d | 1 | 1.09mi |
| 706 Common Widgeon WAY Hopkins, SC | 4.0 | 2.5 | 2157 | $2,430 | $1.13 | 15d | 1 | 1.15mi |
| 244 Savannah Wood Rd Hopkins, SC | 5.0 | 3.0 | 3033 | $2,500 | $0.82 | 15d | 1 | 1.15mi |
| 1912 Dominion Dr Columbia, SC | 4.0 | 2.0 | 1614 | $2,300 | $1.43 | 24d | 1 | 1.17mi |
HOA detail
- Monthly dues
- $29 · $348/yr
- Likely covers
- gym
Listing history 18 events
-
2026-06-21remarks 699-char remark
-
2026-06-21pricedays on market $285,000 Active 78 DOM
-
2026-06-18days on market $299,000 Active 75 DOM
-
2026-06-17days on market $299,000 Active 74 DOM
-
2026-06-16days on market $299,000 Active 73 DOM
-
2026-06-15days on market $299,000 Active 72 DOM
-
2026-06-14days on market $299,000 Active 70 DOM
-
2026-06-10days on market $299,000 Active 67 DOM
-
2026-06-09days on market $299,000 Active 66 DOM
-
2026-06-08days on market $299,000 Active 65 DOM
-
2026-06-07days on market $299,000 Active 64 DOM
-
2026-06-03days on market $299,000 Active 60 DOM
-
2026-06-03days on market $299,000 Active 59 DOM
-
2026-06-01days on market $299,000 Active 58 DOM
-
2026-05-31days on market $299,000 Active 57 DOM
-
2026-04-04$299,000 Active
-
2021-11-23historical
-
2021-11-21$248,240 Active
ⓘ Source: listings_history table (triggers on properties + properties_extension) + one-shot
backfill from property_details.listing_events for pre-trigger history.
Nearby sold comps map
Loading sold comps map…
Walkable amenities ~0.75 mi
Loading nearby amenities…
Taxation est. · year 1
- Rental income
- $27,855
- − Mortgage interest
- −$15,964
- − Property taxes
- −$4,275
- − Insurance
- −$1,425
- − Repairs & maintenance
- −$2,228
- − Management
- −$2,228
- − HOA
- −$348
- − Depreciation
- −$8,291
- Taxable loss
- −$6,905
- Est. tax savings @ 24.0%
- +$1,657
- After-tax cash flow
- $-320/yr
For passive investors: Depreciation is non-cash, so a rental often shows a tax loss while cash-flowing — sheltering income. Rental losses are passive: they offset passive income freely, and up to $25,000/yr can offset ordinary (W-2) income if you actively participate and your MAGI is under $100k (phasing out to $0 by $150k); unused losses carry forward. On sale, claimed depreciation is recaptured at up to 25%, and gains may owe capital-gains tax (a 1031 exchange can defer both). Figures are a year-1 estimate at your 24.0% rate — not tax advice; consult a CPA.
Schools (NCES district)
- District
- Richland 01
- NCES district ID
- 4503360
- Math proficiency
- 26% ▼ -7.00%
- Reading proficiency
- 36% ▼ -5.00%
- Median HH income
- $38,931
- Composite
- 25.94/100
- National rank
- #7335
- State rank
- #54 of 80 in SC
Livability — Columbia
- Score
- 78/100
- State rank
- #18
- US rank
- #2436
Category grades
Schools grade is shown separately in the Schools card above.
Census & demographics
No demographic data for this ZIP.
Market trends
- HPI YoY
- —
- Current HPI
- —
- Rent YoY
- —
- Metro
- —
- State GDP YoY
- ▲ 4.51%
- F500 in state
- 2
Industry mix (Fortune 500 HQ in SC)
| Industry | F500 HQs | Revenue |
|---|---|---|
| Packaging | 1 | $7B |
|
||
Price history
+20.4% since first listed3 events — show timeline
- 2026-04-04 Listed $299,000 Consolidated MLS
- 2021-11-23 Delisted — Consolidated MLS
- 2021-11-21 Listed $248,240 Consolidated MLS
Cash-flow waterfall
monthlySold comps — $/sqft
last 12 mo · ≤1 miLoading sold comps…