8 Sweetbay Dr · Palm Coast, FL
Flood risk 9/10 · Severe
- FEMA flood zone
- AE
- Chance of flooding over 30 yrs
- 0.98%
- Est. flood insurance / yr
- $1,737 – $8,500
Fire risk 3/10 · Minor
- Est. fire insurance / yr
- $947 – $1,759
Heat risk 9/10 · Severe
- Hot days now (above 105°F)
- 7 days/yr
- Hot days in 30 yrs
- 21 days/yr
Wind risk 10/10 · Severe
- Chance of severe wind over 30 yrs
- 99.0%
Air-quality risk 2/10 · Minimal
- Unhealthy air days now
- 2 days/yr
- Unhealthy air days in 30 yrs
- 2 days/yr
Risk factors via First Street. Map © Google.
Why this score? — see what drove the B grade
The composite is a weighted blend of 9 inputs, each scored 0–100. Each bar is that input's sub-score; the figure is the points it added to the 100-point composite (weight × sub-score).
- Cash flow +30.0/30.0
- 1% rule +10.0/10.0
- DSCR +10.0/10.0
- ARV discount +7.5/15.0
- Schools +4.6/10.0
- Livability +3.5/5.0
- Rent growth +2.7/5.0
- Condition / age +2.5/5.0
- Appreciation +0.0/10.0
$243,900
🖨 Deal sheet 📄 Offer letter ✓ Due diligence
Listing remarks
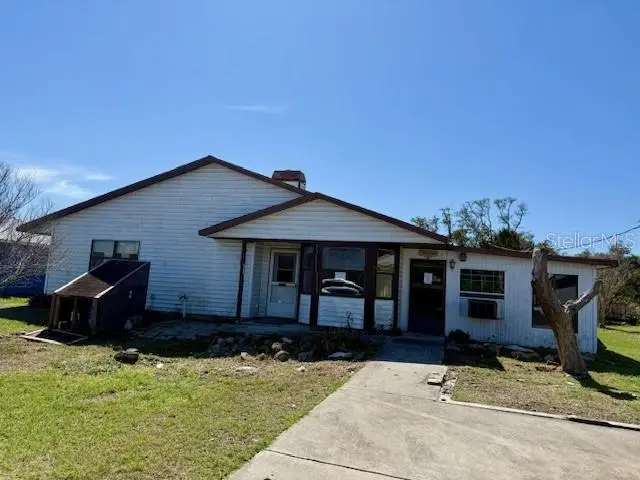
Unbelievable opportunity to own a beachside fixer-upper located just off A1A in the highly sought-after Hammock area—only steps to the ocean! Perfectly situated close to the public beach access, shopping center, and all the new restaurants, this location offers the ultimate Florida coastal lifestyle. With no HOA or CDD fees and short-term rentals allowed, this is an incredible opportunity to create your dream beach retreat or a high-demand income-producing property. A true diamond in the rough, this home is ready for your vision and transformation. Featuring 3 bedrooms, 2 bathrooms, soaring ceilings, a cozy fireplace, and an open kitchen layout, there’s so much to work with. Enj
Key facts
- Spacious backyard
- Public beach access
- 0.23 acre lot
Tags
Property features AI
Finance
- Other: Homestead exempt; Zoned R-1
- Financial info: Lease restrictions apply
- HOA & community: No HOA association indicated
Exterior
- Utilities: Public water; Septic tank sewer; Cable available
- Home design: Single-family residence; One story; Faces northeast
- Construction: Frame construction; Shingle roof; Slab foundation; Built on a 0.23-acre lot
- Exterior features: Sliding doors; Dirt road access
Interior
- Kitchen: Dishwasher; Range; Refrigerator
- Bedrooms: 3 bedrooms
- Flooring: Carpet; Tile
- Bathrooms: 2 full bathrooms
- Heating & cooling: Central heating; Central air conditioning
- Interior features: Ceiling fans
- Laundry & utility: Dedicated laundry room
Neighborhood map
What this means for you Summary
Snapshot
- This is a 3-bed/2.0-bath single-family listed at $244k.
Deal economics
- At list price, monthly cash flow is $2k ($25k/yr) — positive.
- The deal already cash-flows at list — no discount required.
- Meets the 1% rule at list price ($5k rent vs $244k).
- Recommended offer: $222k (9.0% below list) — sets the bar for market timing.
- Cap rate 18.5% vs local median 3.8% in Palm Coast — top-decile yield for the area; either an underpriced asset or a hidden risk that comps aren't pricing in. Stress-test before assuming the spread holds.
Location & tenants
- Location reads 69/100 on livability (#478 in FL) — a middle-class / working-renter tenant base. Strengths: housing A+, health & safety A+, cost of living B+; Watch: amenities F, commute F.
- Flagler (rural): math 53% / reading 56% proficiency, ranked #20 of 73 in FL (top 27%) — acceptable for families but not a draw, mixed tenant base, ~2y average lease.
- Market conditions: Rents flat; 1600 active listings in the ZIP; 11 comparable units currently listed for rent nearby; rentals at typical pace (median 24d on market — plan ~3-4 weeks tenant-placement turnaround); solid renter incomes; 2,588 units permitted in Flagler County in 2024 (0 in 5+ unit buildings).
- At $5,001/mo this rent would consume 72% of the median local household income ($84k/yr) (locally 816% of renters already pay >50% of income on rent) — very limited rent-growth headroom before tenants either downsize or default.
Forward outlook
- Local home prices are declining (-3.0%/yr); year-one equity from $2k of loan paydown is wiped out by about $7k of value loss. Plan a longer hold.
- Flagler County population projected at +28% by 2050 — long-run rental-demand tailwind backs the buy-and-hold thesis.
- At projected returns (-3.0% appreciation + 0.8% rent growth), your $68k cash investment doubles in ~4 years — after that, you're playing with house money.
Negotiation context
- It's been on market 92 days — a 9% lower offer ($222k) is reasonable based on typical stale-listing flexibility.
Risks & watch-outs
- Watch-outs: flood insurance adds $427/mo.
- Climate carrying-cost: in FEMA flood zone AE (mandatory federal flood insurance); severe wind risk, 99% chance of damaging wind over 30y; extreme-heat days projected 7→21/yr by 2055 (HVAC capex compounding) — expect insurance premiums to compound above CPI over the hold.
Questions for the listing agent
- It's been on market 92 days. Have you received any prior offers? Is the seller open to a 9% concession, seller financing, or rate buy-down credit?
- What's the actual annual flood-insurance premium (NFIP or private), and is the property in a SFHA with mandatory coverage?
- Why hasn't it sold? Are there any deal-killer items the seller is aware of (foundation, flood, title, zoning, code violations)?
- Is there a deadline driving the sale (1031 exchange, divorce, estate, relocation)? That informs how much negotiation room exists.
- What's the average days-on-market for RENTAL listings here right now (not sales)? A rising rental-DOM trend means longer vacancies and softer asking-rent achievability than the comps imply.
- What's the recent tenant-quality profile in this submarket — average credit score on applications, eviction rate, late-payment / NSF rate, and stable-employment percentage? A property-management company in the area should have these aggregated.
- How much new for-sale + rental construction is in the pipeline within 1–3 miles? Heavy new supply typically softens prices + rents 12–24 months out; constrained supply supports both.
Investment metrics
- 1% rule
- 2.05% ✓
- Cap rate
- 18.49%
- Cash-on-cash
- 43.57%
- DSCR
- 2.94
- GRM
- 4.1
CMA / ARV
- ARV (on-the-fly)
- $553,800
- Comps found
- 12
Show comp detail 12 sales within ~0.75 mi
| Address | Dist | Beds/Ba | Sqft | Sold | Price | $/sf | Match |
|---|---|---|---|---|---|---|---|
| 7 Bristol Dr | 0.19mi | 3/2.5 | 1,906 (-2%) | 4mo | $645,000 | $338 | 82 |
| 35 Bedford Dr | 0.28mi | 3/2.5 | 1,940 (-0%) | 3mo | $450,000 | $232 | 81 |
| 16 Avalon Ter | 0.19mi | 3/2.0 | 1,842 (-6%) | 3mo | $530,000 | $288 | 79 |
| 14 Dogwood Ter | 0.18mi | 3/2.0 | 1,834 (-6%) | 3mo | $520,000 | $284 | 79 |
| 5 Nantucket Dr | 0.30mi | 3/2.5 | 1,991 (+2%) | 4mo | $430,000 | $216 | 77 |
| 23 Moody Dr | 0.59mi | 3/2.0 | 1,948 (-0%) | 6mo | $552,500 | $284 | 68 |
| 31 Andover Dr | 0.30mi | 3/2.5 | 1,758 (-10%) | 4mo | $325,000 | $185 | 65 |
| 30 Medford Dr | 0.31mi | 3/2.5 | 1,722 (-12%) | 6mo | $325,600 | $189 | 59 |
| 5 Rollins Dr | 0.47mi | 4/2.5 (+1) | 2,098 (+8%) | 2mo | $675,000 | $322 | 57 |
| 12 Moody Dr | 0.57mi | 3/2.0 | 1,746 (-10%) | 1mo | $685,000 | $392 | 55 |
| 45 Moody Dr | 0.61mi | 3/2.0 | 1,728 (-11%) | 5mo | $695,000 | $402 | 48 |
| 31 Ocean St | 0.68mi | 2/2.5 (-1) | 1,714 (-12%) | 5mo | $479,000 | $279 | 37 |
Match score weights: distance 35% · size 25% · config 20% · recency 20%. Top-matched comps best support the ARV.
Projected returns pro-forma
-3.0% appreciation · 0.85% rent growth · sell at horizon
- IRR
- 29.2%
- Equity multiple
- 2.18×
- Total profit
- $80,843
- Equity at exit
- $36,366
- IRR
- 35.3%
- Equity multiple
- 3.90×
- Total profit
- $197,972
- Equity at exit
- $21,088
Cash invested: $68,292 (down + closing). Projections, not guarantees.
Landlord ↔ Tenant lean methodology
- Overall (STATE)
- 87 Strongly Landlord-Friendly
- State Florida
- 87 Strongly Landlord-Friendly · R+3
- County
- — inherits STATE
- City
- — inherits STATE
ZIP-level market 32137
- Home prices YoY
- -34.5%
- Rents YoY
- 0.8%
- Active inventory
- 1600
- Price-to-rent
- 4.1×
Monthly cashflow live
- Estimated rent
- $5,001 high interval (Pro) →
- Mortgage (P&I)
- −$1,279
- Tax from tax record
- −$90 /mo · $1,084/yr
- Insurance
- −$102
- Flood insurance flood zone
- −$427 /mo · $5,118/yr
- HOA
- −$0
- Vacancy / Maint / Mgmt
- −$1,050
- Net cashflow
- $2,053
Break-even live
UW: 25.0% down · 7.5% · 30yr · 1.5% tax · 5.0% vac · 8.0% maint · 8.0% mgmt
Financing live
Cash to close
- Down payment
- $60,975
- Closing costs
- $7,317
- Reserves months
- —
- Total cash needed
- —
Loan-product check · same deal, 3 products live
Conventional
25% down · 7.5% · 30yr
- Down + closing
- —
- Monthly P&I
- —
- Monthly cashflow
- —
- DSCR
- —
- Eligible?
- —
Personal DTI + credit; lowest rate.
DSCR
20% down · 8.5% · 30yr
- Down + closing
- —
- Monthly P&I
- —
- Monthly cashflow
- —
- DSCR
- —
- Eligible?
- —
No personal income docs; deal must DSCR.
Hard money
10% down · 12.0% · 12mo
- Down + closing
- —
- Monthly P&I
- —
- Monthly cashflow
- —
- DSCR
- —
- Eligible?
- —
Short-term bridge; refi at stabilization.
Rent comps 11 comps
| Address | Beds | Baths | Sqft | Rent | $/sqft | DOM | Units | Dist |
|---|---|---|---|---|---|---|---|---|
| 22 Bristol Dr Palm Coast, FL | 2.0 | 2.0 | 1637 | $1,975 | $1.21 | 14d | 1 | 0.13mi |
| 35 Andover Dr Unit 1060869P Palm Coast, FL | 3.0 | 2.0 | 1496 | $3,150 | $2.11 | 14d | 1 | 0.26mi |
| 1 Bedford Dr Palm Coast, FL | 3.0 | 2.0 | 2032 | $4,800 | $2.36 | 23d | 1 | 0.27mi |
| 27 Mala Compra Rd Unit 1261612P Palm Coast, FL | 3.0 | 2.0 | 1991 | $7,806 | $3.92 | 11d | 1 | 0.40mi |
| 37 Atlantic Dr Unit 1261604P Palm Coast, FL | 3.0 | 2.0 | 1991 | $8,011 | $4.02 | 23d | 1 | 0.52mi |
| 37 Atlantic Dr Palm Coast, FL | 3.0 | 2.0 | 1501 | $7,500 | $5.00 | 23d | 1 | 0.52mi |
| 20 Sabal Bnd Unit 1 Palm Coast, FL | 3.0 | 2.5 | 1466 | $2,100 | $1.43 | 21d | 1 | 1.23mi |
| 323 Ocean Crest Dr Palm Coast, FL | 3.0 | 3.0 | 2341 | $4,200 | $1.79 | 23d | 1 | 1.25mi |
| 35 Ocean Crest Way #1124 Palm Coast, FL | 2.0 | 2.0 | 1264 | $3,500 | $2.77 | 23d | 1 | 1.39mi |
| 200 Ocean Crest Dr #1111 Palm Coast, FL | 3.0 | 3.0 | 1818 | $7,000 | $3.85 | 23d | 1 | 1.41mi |
| 58 Comanche Ct Unit 1261614P Palm Coast, FL | 3.0 | 2.0 | 2195 | $5,998 | $2.73 | 11d | 1 | 1.43mi |
Listing history 17 events
-
2026-06-18days on market $243,900 Active 92 DOM
-
2026-06-17days on market $243,900 Active 91 DOM
-
2026-06-16days on market $243,900 Active 90 DOM
-
2026-06-15days on market $243,900 Active 89 DOM
-
2026-06-14days on market $243,900 Active 87 DOM
-
2026-06-13days on market $243,900 Active 86 DOM
-
2026-06-10days on market $243,900 Active 84 DOM
-
2026-06-09days on market $243,900 Active 83 DOM
-
2026-06-08days on market $243,900 Active 82 DOM
-
2026-06-07days on market $243,900 Active 81 DOM
-
2026-06-03days on market $243,900 Active 77 DOM
-
2026-06-02days on market $243,900 Active 76 DOM
-
2026-06-01days on market $243,900 Active 75 DOM
-
2026-05-31days on market $243,900 Active 74 DOM
-
2026-05-18price $296,100
-
2026-04-20price $312,550
-
2026-03-18$329,000 Active
ⓘ Source: listings_history table (triggers on properties + properties_extension) + one-shot
backfill from property_details.listing_events for pre-trigger history.
Tax reassessment forecast FL · Resets to sale price
- Current annual tax
- $1,084 · $90/mo
- Projected year-2 tax
- $2,024 · $169/mo
- Expected delta
- +$941/yr (+$78/mo · 86.8%)
ⓘ Screening estimate from a state-policy table — verify with the county assessor before closing.
Climate risk First Street
- Flood 9/10 Extreme FEMA zone AE · 98% chance over 30 yrs
- Wildfire 3/10 Moderate
- Heat 9/10 Extreme 7 d/yr ≥105°F today · 21 d/yr by 30 yrs out
- Wind 10/10 Extreme 99% chance of damaging wind over 30 yrs
- Air quality 2/10 Low 2 unhealthy d/yr today · 2 by 30 yrs out
Nearby sold comps map
Loading sold comps map…
Walkable amenities ~0.75 mi
Loading nearby amenities…
Taxation est. · year 1
- Rental income
- $60,006
- − Mortgage interest
- −$13,662
- − Property taxes
- −$1,084
- − Insurance
- −$6,338
- − Repairs & maintenance
- −$4,801
- − Management
- −$4,801
- − Depreciation
- −$7,095
- Taxable income
- $22,226
- Est. tax owed @ 24.0%
- −$5,334
- After-tax cash flow
- $19,301/yr
For passive investors: Depreciation is non-cash, so a rental often shows a tax loss while cash-flowing — sheltering income. Rental losses are passive: they offset passive income freely, and up to $25,000/yr can offset ordinary (W-2) income if you actively participate and your MAGI is under $100k (phasing out to $0 by $150k); unused losses carry forward. On sale, claimed depreciation is recaptured at up to 25%, and gains may owe capital-gains tax (a 1031 exchange can defer both). Figures are a year-1 estimate at your 24.0% rate — not tax advice; consult a CPA.
Schools (NCES district)
- District
- Flagler
- NCES district ID
- 1200540
- Math proficiency
- 53% ▼ -9.00%
- Reading proficiency
- 56% ▼ -4.00%
- Median HH income
- $48,354
- Composite
- 46.35/100
- National rank
- #2464
- State rank
- #20 of 73 in FL
Livability — Palm Coast
- Score
- 69/100
- State rank
- #478
- US rank
- #8721
Category grades
Schools grade is shown separately in the Schools card above.
Census & demographics
- County
- Flagler County · 113,412 people
- City population
- 105,049
- Metro
- Deltona-Daytona Beach-Ormond Beach, FL
- Population (ZIP)
- 48,391
- Household income
- $83,923
- Rent vs Own
- Severe rent burden
- 816.0
Population outlook (Flagler County) Hauer SSP2
- Today (2025)
- 123,474 people
- By 2030
- 131,864 · +6.8%
- By 2040
- 146,176 · +18.4%
- By 2050
- 157,398 · +27.5%
- By 2075
- 177,990 · +44.2%
- By 2100
- 183,381 · +48.5%
Race, ethnicity, and origin ACS 2023
- Neighborhood character
- Predominantly White (77%)
- Race & ethnicity
- White 77% Hispanic / Latino 10% Two or more races 8% Black 6% Asian 3%
- Hispanic origin (detail)
- Puerto Rican 4% Cuban 1%
- Common ancestry
- Romanian 4% Russian 2% Lithuanian 2%
- Foreign-born
- 13% · Canada, Jamaica
- Languages at home
- 85% English-only · Spanish 7% Other Indo-European 3% Russian/Polish/Slavic 2%
Political lean MEDSL · Flagler
- 2024 margin
- Strong R (+28.2) · D 35.6% · R 63.8%
- 2008→2024 swing
- -29.8pp toward R · 2008: 1.6pp · 2024: -28.2pp
- All cycles
- 2024: R+28.2 2020: R+20.8 2016: R+20.6 2012: R+7.4 2008: D+1.6
Not yet ingested
- Civics
- —
Market trends
- HPI YoY
- ▼ -153.27%
- Current HPI
- 290.4607
- Rent YoY
- ▲ 0.85%
- Metro
- Deltona-Daytona Beach-Ormond Beach, FL
- State GDP YoY
- ▲ 3.28%
- F500 in state
- 36
Industry mix (Fortune 500 HQ in FL)
| Industry | F500 HQs | Revenue |
|---|---|---|
| Industrial Technology | 2 | $29B |
|
||
| Insurance | 2 | $17B |
|
||
| Retail | 1 | $60B |
|
||
| Technology Distribution | 1 | $58B |
|
||
| Homebuilding | 1 | $35B |
|
||
| Technology Manufacturing | 1 | $35B |
|
||
Price history
-10.0% since first listed3 events — show timeline
- 2026-05-18 Price Changed $296,100 Stellar MLS as Distributed by MLS Grid
- 2026-04-20 Price Changed $312,550 Stellar MLS as Distributed by MLS Grid
- 2026-03-18 Listed $329,000 Stellar MLS as Distributed by MLS Grid
Property tax history
+1.4%/yrLatest (2025): $1,084 · +3.7% YoY. Source: county tax records.
Cash-flow waterfall
monthlySold comps — $/sqft
last 12 mo · ≤1 miLoading sold comps…