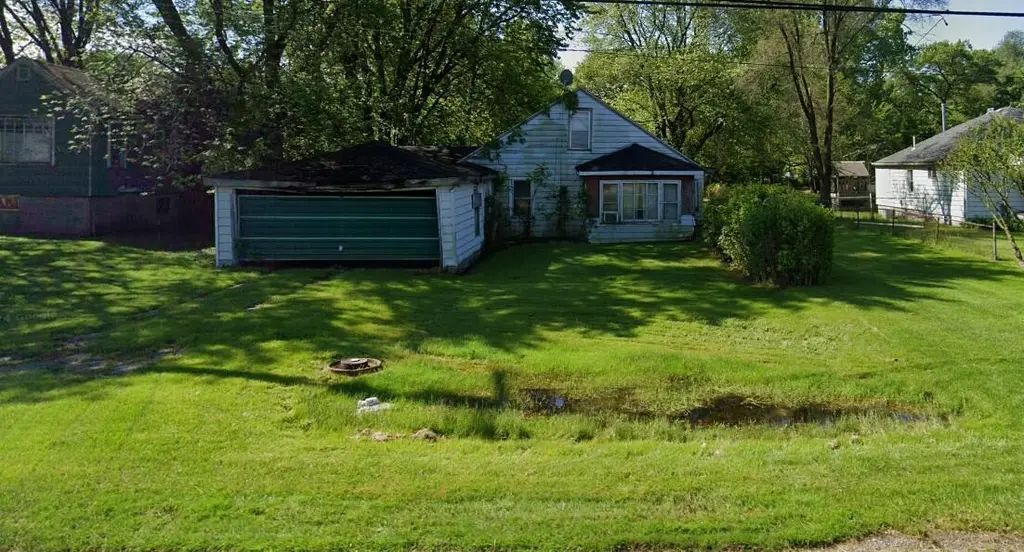
7069 W 21st Ave · Gary, IN
Flood risk 1/10 · Minimal
- FEMA flood zone
- X (unshaded)
- Chance of flooding over 30 yrs
- 0.0%
- Est. flood insurance / yr
- $507 – $1,088
Fire risk 1/10 · Minimal
- Est. fire insurance / yr
- $717 – $1,331
Heat risk 3/10 · Minor
- Hot days now (above 103°F)
- 7 days/yr
- Hot days in 30 yrs
- 15 days/yr
Wind risk 2/10 · Minimal
- Chance of severe wind over 30 yrs
- 1.0%
Air-quality risk 4/10 · Minor
- Unhealthy air days now
- 5 days/yr
- Unhealthy air days in 30 yrs
- 6 days/yr
Risk factors via First Street. Map © Google.
Why this score? — see what drove the B grade
The composite is a weighted blend of 9 inputs, each scored 0–100. Each bar is that input's sub-score; the figure is the points it added to the 100-point composite (weight × sub-score).
- Cash flow +30.0/30.0
- 1% rule +10.0/10.0
- DSCR +10.0/10.0
- ARV discount +7.5/15.0
- Appreciation +5.6/10.0
- Livability +3.7/5.0
- Rent growth +2.5/5.0
- Condition / age +2.5/5.0
- Schools +1.3/10.0
$53,000
🖨 Deal sheet 📄 Offer letter ✓ Due diligence
Listing remarks
Investor Special - Rehab Ready! Fully cleaned out and gutted to the studs, this property is ready for your vision and renovation plans. Flexible floor plan with ample space for reconfiguration, including the potential to divide the upper-level loft into two bedrooms and easily add a half bath. Located in a convenient very quiet Gary neighborhood on ~1/2 acre lot with quick access to major roadways, shopping, schools, and employment centers. Title commitment is ready, and a Warranty Deed can be provided for a smooth transaction. Bring your contractor and unlock this property's full potential!
Key facts
- Gutted to the studs
- Rehab ready
- 1/2 acre lot
Tags
Property features AI
Exterior
- Parking: Attached or detached garage with 2 parking spaces
- Utilities: Public water; Public sewer
- Home design: Single-story home; Built in 1948
- Construction: Asphalt roof; Construction materials: Other; Lot size source: Owner
- Exterior features: Other exterior features; Other view
Interior
- Kitchen: Kitchen (no appliances listed)
- Bedrooms: Primary bedroom, plus two additional bedrooms
- Flooring: Other flooring
- Bathrooms: 1 full bathroom
- Heating & cooling: Natural gas heating; No cooling system
- Interior features: Other interior features; 6 total rooms including a loft and living room
- Laundry & utility: No appliances listed
Neighborhood map
What this means for you Summary
Snapshot
- This is a 4-bed/1.0-bath single-family listed at $53k.
Deal economics
- At list price, monthly cash flow is $940 ($11k/yr) — positive.
- The deal already cash-flows at list — no discount required.
- Meets the 1% rule at list price ($2k rent vs $53k).
- Recommended offer: $52k (1.5% below list) — sets the bar for market timing.
- Cap rate 27.6% vs local median 9.1% in Gary — top-decile yield for the area; either an underpriced asset or a hidden risk that comps aren't pricing in. Stress-test before assuming the spread holds.
Location & tenants
- Location reads 73/100 on livability (#105 in IN) — a middle-class / working-renter tenant base. Strengths: commute A+, cost of living A+, housing A+; Watch: schools F, crime F, employment F.
- Lake Ridge New Tech Schools (suburban): math 11% / reading 20% proficiency, ranked #287 of 301 in IN (top 95%) — low school quality limits family demand, transient renter base, plan for 1-2y turnover; 79% free/reduced lunch — lower-income household profile, screen leases tightly.
- Market conditions: 54 active listings in the ZIP; 3 comparable units currently listed for rent nearby; rentals leasing fast (median 7d on market — plan ~1-2 weeks tenant-placement turnaround); 1,642 units permitted in Lake County in 2024 (14 in 5+ unit buildings).
Forward outlook
- In year one you build about $1k of equity ($366 loan paydown + $666 appreciation (1.3% local appreciation)).
- Lake County population projected to shrink 7% by 2050 — rents likely to lag national; underwrite the cash flow, not the appreciation.
- At projected returns (1.3% appreciation + 3.0% rent growth), your $15k cash investment doubles in ~2 years — after that, you're playing with house money.
Negotiation context
- It's been on market 17 days — a 2% lower offer ($52k) is reasonable based on typical stale-listing flexibility.
Risks & watch-outs
- Watch-outs: built in 1948 — expect roof / HVAC / electrical / plumbing capex.
Questions for the listing agent
- Built in 1948 — when were the roof, HVAC, electrical panel, plumbing, and water heater last replaced?
- Is there a deadline driving the sale (1031 exchange, divorce, estate, relocation)? That informs how much negotiation room exists.
- Schools are F-rated, which usually means shorter tenancies and higher turnover. Who's the typical renter profile here, and what's been the actual vacancy rate?
- Crime grade is F in this area — have there been break-ins, vandalism, or insurance claims at this property in the last 3 years? What carrier currently insures it and at what premium?
- What's the average days-on-market for RENTAL listings here right now (not sales)? A rising rental-DOM trend means longer vacancies and softer asking-rent achievability than the comps imply.
- What's the recent tenant-quality profile in this submarket — average credit score on applications, eviction rate, late-payment / NSF rate, and stable-employment percentage? A property-management company in the area should have these aggregated.
- How much new for-sale + rental construction is in the pipeline within 1–3 miles? Heavy new supply typically softens prices + rents 12–24 months out; constrained supply supports both.
Investment metrics
- 1% rule
- 2.99% ✓
- Cap rate
- 27.57%
- Cash-on-cash
- 75.98%
- DSCR
- 4.38
- GRM
- 2.8
CMA / ARV
- ARV (on-the-fly)
- $187,680
- Comps found
- 12
Show comp detail 12 sales within ~0.75 mi
| Address | Dist | Beds/Ba | Sqft | Sold | Price | $/sf | Match |
|---|---|---|---|---|---|---|---|
| 7269 W 23rd Ave | 0.34mi | 3/1.0 (-1) | 1,170 (-0%) | 14mo | $30,000 | $26 | 68 |
| 3718 173rd Ct | 0.64mi | 3/1.0 (-1) | 1,133 (-3%) | 5mo | $190,000 | $168 | 55 |
| 2392 Wheeler St | 0.72mi | 3/1.0 (-1) | 1,120 (-4%) | 1mo | $85,000 | $76 | 53 |
| 7201 W 24th Ave | 0.38mi | 3/1.0 (-1) | 1,032 (-12%) | 6mo | $154,900 | $150 | 52 |
| 7207 Tennessee Ave | 0.37mi | 3/1.0 (-1) | 1,013 (-14%) | 7mo | $162,000 | $160 | 49 |
| 7212 Rhode Island Ave | 0.44mi | 3/1.0 (-1) | 1,015 (-14%) | 4mo | $135,000 | $133 | 48 |
| 7218 Tennessee Ave | 0.39mi | 3/1.0 (-1) | 1,015 (-14%) | 8mo | $127,500 | $126 | 48 |
| 3846 Robinhood Ln | 0.44mi | 3/1.0 (-1) | 1,015 (-14%) | 7mo | $195,000 | $192 | 46 |
| 7208 Ohio Ave | 0.55mi | 3/1.0 (-1) | 1,015 (-14%) | 2mo | $183,900 | $181 | 45 |
| 3704 175th Pl | 0.73mi | 4/1.5 | 1,286 (+10%) | 8mo | $246,900 | $192 | 42 |
| 3907 177th St | 0.62mi | 3/2.0 (-1) | 1,288 (+10%) | 7mo | $205,000 | $159 | 40 |
| 3726 173rd St | 0.62mi | 3/1.0 (-1) | 1,013 (-14%) | 5mo | $165,000 | $163 | 39 |
Match score weights: distance 35% · size 25% · config 20% · recency 20%. Top-matched comps best support the ARV.
Projected returns pro-forma
1.26% appreciation · 3.0% rent growth · sell at horizon
- IRR
- 79.1%
- Equity multiple
- 5.14×
- Total profit
- $61,498
- Equity at exit
- $18,806
- IRR
- 79.9%
- Equity multiple
- 10.53×
- Total profit
- $141,361
- Equity at exit
- $25,552
Cash invested: $14,840 (down + closing). Projections, not guarantees.
Landlord ↔ Tenant lean methodology
- Overall (STATE)
- 90 Strongly Landlord-Friendly
- State Indiana
- 90 Strongly Landlord-Friendly · R+11
- County
- — inherits STATE
- City
- — inherits STATE
ZIP-level market 46406
- Home prices YoY
- 0.9%
- Active inventory
- 54
- Price-to-rent
- 2.8×
Monthly cashflow live
- Estimated rent
- $1,585 medium interval (Pro) →
- Mortgage (P&I)
- −$278
- Tax from tax record
- −$12 /mo · $146/yr
- Insurance
- −$22
- HOA
- −$0
- Vacancy / Maint / Mgmt
- −$333
- Net cashflow
- $940
Break-even live
UW: 25.0% down · 7.5% · 30yr · 1.5% tax · 5.0% vac · 8.0% maint · 8.0% mgmt
Financing live
Cash to close
- Down payment
- $13,250
- Closing costs
- $1,590
- Reserves months
- —
- Total cash needed
- —
Loan-product check · same deal, 3 products live
Conventional
25% down · 7.5% · 30yr
- Down + closing
- —
- Monthly P&I
- —
- Monthly cashflow
- —
- DSCR
- —
- Eligible?
- —
Personal DTI + credit; lowest rate.
DSCR
20% down · 8.5% · 30yr
- Down + closing
- —
- Monthly P&I
- —
- Monthly cashflow
- —
- DSCR
- —
- Eligible?
- —
No personal income docs; deal must DSCR.
Hard money
10% down · 12.0% · 12mo
- Down + closing
- —
- Monthly P&I
- —
- Monthly cashflow
- —
- DSCR
- —
- Eligible?
- —
Short-term bridge; refi at stabilization.
Rent comps 3 comps
| Address | Beds | Baths | Sqft | Rent | $/sqft | DOM | Units | Dist |
|---|---|---|---|---|---|---|---|---|
| 6610 Rhode Island Ave Hammond, IN | 3.0 | 1.0 | 1025 | $1,600 | $1.56 | 7d | 1 | 0.95mi |
| 7633 Kentucky Ave Hammond, IN | 3.0 | 1.0 | 888 | $1,595 | $1.80 | 10d | 1 | 1.12mi |
| 6320 Rhode Island Ave Hammond, IN | 3.0 | 1.0 | 916 | $1,550 | $1.69 | 2d | 1 | 1.27mi |
Listing history 11 events
-
2026-06-15days on market $53,000 Active 17 DOM
-
2026-06-13days on market $53,000 Active 15 DOM
-
2026-06-13days on market $53,000 Active 14 DOM
-
2026-06-09days on market $53,000 Active 11 DOM
-
2026-06-08days on market $53,000 Active 10 DOM
-
2026-06-07days on market $53,000 Active 9 DOM
-
2026-06-04days on market $53,000 Active 6 DOM
-
2026-06-03days on market $53,000 Active 5 DOM
-
2026-06-02days on market $53,000 Active 4 DOM
-
2026-06-01days on market $53,000 Active 3 DOM
-
2026-05-31days on market $53,000 Active 2 DOM
ⓘ Source: listings_history table (triggers on properties + properties_extension) + one-shot
backfill from property_details.listing_events for pre-trigger history.
Tax reassessment forecast IN · Partial reset (capped growth)
- Current annual tax
- $146 · $12/mo
- Projected year-2 tax
- $298 · $25/mo
- Expected delta
- +$152/yr (+$13/mo · 104.2%)
ⓘ Screening estimate from a state-policy table — verify with the county assessor before closing.
Climate risk First Street
- Flood 1/10 Low FEMA zone X (unshaded) · 0% chance over 30 yrs
- Wildfire 1/10 Low
- Heat 3/10 Moderate 7 d/yr ≥103°F today · 15 d/yr by 30 yrs out
- Wind 2/10 Low 100% chance of damaging wind over 30 yrs
- Air quality 4/10 Moderate 5 unhealthy d/yr today · 6 by 30 yrs out
Nearby sold comps map
Loading sold comps map…
Walkable amenities ~0.75 mi
Loading nearby amenities…
Taxation est. · year 1
- Rental income
- $19,015
- − Mortgage interest
- −$2,969
- − Property taxes
- −$146
- − Insurance
- −$265
- − Repairs & maintenance
- −$1,521
- − Management
- −$1,521
- − Depreciation
- −$1,542
- Taxable income
- $11,051
- Est. tax owed @ 24.0%
- −$2,652
- After-tax cash flow
- $8,623/yr
For passive investors: Depreciation is non-cash, so a rental often shows a tax loss while cash-flowing — sheltering income. Rental losses are passive: they offset passive income freely, and up to $25,000/yr can offset ordinary (W-2) income if you actively participate and your MAGI is under $100k (phasing out to $0 by $150k); unused losses carry forward. On sale, claimed depreciation is recaptured at up to 25%, and gains may owe capital-gains tax (a 1031 exchange can defer both). Figures are a year-1 estimate at your 24.0% rate — not tax advice; consult a CPA.
Schools (NCES district)
- District
- Lake Ridge New Tech Schools
- NCES district ID
- 1805460
- Math proficiency
- 11% ▼ -18.00%
- Reading proficiency
- 20% ▼ -9.00%
- Median HH income
- $34,568
- Composite
- 12.67/100
- National rank
- #9607
- State rank
- #287 of 301 in IN
Livability — Gary
- Score
- 73/100
- State rank
- #105
- US rank
- #5592
Category grades
Schools grade is shown separately in the Schools card above.
Census & demographics
- Census place
- Gary, IN
- City population
- 63,701
- Population (ZIP)
- 8,513
Population outlook (Lake County) Hauer SSP2
- Today (2025)
- 484,026 people
- By 2030
- 478,091 · -1.2%
- By 2040
- 462,974 · -4.3%
- By 2050
- 449,894 · -7.1%
- By 2075
- 436,169 · -9.9%
- By 2100
- 426,607 · -11.9%
Race, ethnicity, and origin ACS 2023
- Neighborhood character
- Majority Black (63%)
- Race & ethnicity
- Black 63% White 21% Hispanic / Latino 13% Two or more races 7%
- Hispanic origin (detail)
- Mexican 7% Puerto Rican 3%
- Common ancestry
- Slovak 2% Italian 1% Lithuanian 1%
- Foreign-born
- 4% · Canada
- Languages at home
- 91% English-only · Spanish 8%
Political lean MEDSL · Lake
- 2024 margin
- Lean D (+5.6) · D 52.1% · R 46.5% · Other 1.5%
- 2008→2024 swing
- -28.6pp toward R · 2008: 34.3pp · 2024: 5.6pp
- All cycles
- 2024: D+5.6 2020: D+15.1 2016: D+20.6 2012: D+31.0 2008: D+34.3
Not yet ingested
- Civics
- —
Market trends
- HPI YoY
- ▲ 1.26%
- Current HPI
- 147.0732
- Rent YoY
- —
- Metro
- —
- State GDP YoY
- ▲ 2.90%
- F500 in state
- 18
Industry mix (Fortune 500 HQ in IN)
| Industry | F500 HQs | Revenue |
|---|---|---|
| Industrial Machinery | 2 | $37B |
|
||
| Healthcare | 1 | $177B |
|
||
| Pharmaceuticals | 1 | $45B |
|
||
| Metals / Steel | 1 | $18B |
|
||
| Agriculture | 1 | $17B |
|
||
| Packaging | 1 | $12B |
|
||
Price history
1 event — show timeline
- 2026-05-29 Listed $53,000 NIRA MLS as Distributed by MLS Grid
Property tax history
+2.0%/yrLatest (2019): $146 · -1.0% YoY. Source: county tax records.
Cash-flow waterfall
monthlySold comps — $/sqft
last 12 mo · ≤1 miLoading sold comps…