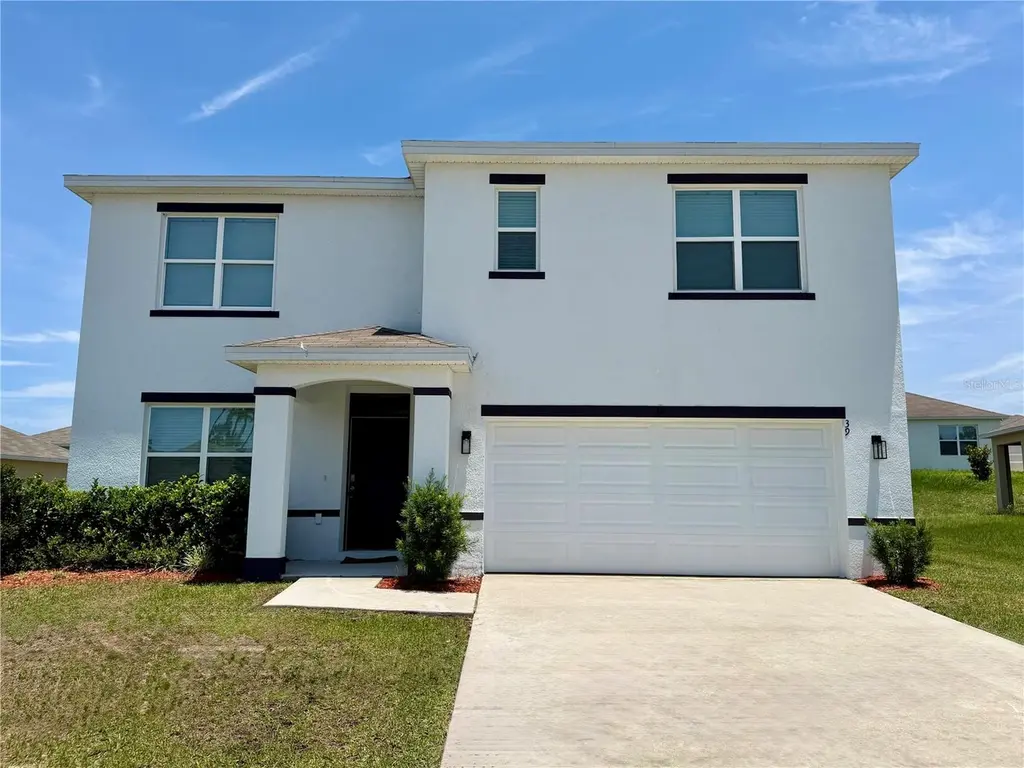
39 Hickory Course Way · Silver Springs Shores, FL
Flood risk 1/10 · Minimal
- FEMA flood zone
- X (unshaded)
- Chance of flooding over 30 yrs
- 0.0%
- Est. flood insurance / yr
- $507 – $1,088
Fire risk 4/10 · Minor
- Est. fire insurance / yr
- $947 – $1,759
Heat risk 8/10 · Major
- Hot days now (above 108°F)
- 7 days/yr
- Hot days in 30 yrs
- 22 days/yr
Wind risk 9/10 · Severe
- Chance of severe wind over 30 yrs
- 99.0%
Air-quality risk 3/10 · Minor
- Unhealthy air days now
- 3 days/yr
- Unhealthy air days in 30 yrs
- 4 days/yr
Risk factors via First Street. Map © Google.
Why this score? — see what drove the D+ grade
The composite is a weighted blend of 9 inputs, each scored 0–100. Each bar is that input's sub-score; the figure is the points it added to the 100-point composite (weight × sub-score).
- ARV discount +15.0/15.0
- Cash flow +8.5/30.0
- Appreciation +8.0/10.0
- Schools +3.6/10.0
- Livability +3.4/5.0
- 1% rule +3.0/10.0
- Rent growth +2.5/5.0
- Condition / age +2.5/5.0
- DSCR +2.3/10.0
$299,000
🖨 Deal sheet (PDF) 📄 Offer letter ✓ Due diligence
Listing remarks MLS
One or more photo(s) has been virtually staged. Under Construction. This two story, all concrete block constructed home has a large open-concept downstairs with a kitchen overlooking the living and dining room. The kitchen comes equipped with a refrigerator, electric range, microwave and built-in dishwasher. The first floor also features a flex room that provides an area for work or for play, a bedroom, full bathroom, and an outdoor patio. The second floor includes an expansive owner’s suite, three additional bedrooms that surround a second living area, a third full bathroom, and a laundry room equipped with a washer and dryer. Pictures, photographs, colors, features, and sizes are for illustration purposes only and will vary from the homes as built. Home and community information including pricing, included features, terms, availability and amenities are subject to change and prior sale at any time without notice or obligation. CBC039052
Key facts
- Large island
- Gated golf community
- Abundant storage
Tags
Property features AI
Finance
- Other: Property type: Residential — Single Family Residence; Zoning: PUD
- Financial info: Total monthly fees listed as $50; Total annual fees listed as $600
- HOA & community: HOA required — $50 monthly; Association covers grounds maintenance and recreational facilities; Community features: Clubhouse, golf, golf carts allowed; Pets allowed
Exterior
- Parking: Attached garage; 2-car garage
- Utilities: Public water; Private sewer; Electricity connected; Water connected
- Home design: Single-family residence (PUD); Two-story; Northeast facing; Entry level: Two levels
- Construction: Concrete and stucco construction; Shingle roof; Slab foundation; Built on 0.15 acre lot (approx. 65 x 100)
- Exterior features: Exterior lighting; Paved road access
Interior
- Kitchen: Range; Microwave; Dishwasher
- Bedrooms: 5 bedrooms
- Flooring: Carpet; Tile
- Bathrooms: 3 full bathrooms
- Heating & cooling: Central heating; Central air conditioning
- Interior features: Open floorplan; Split bedroom layout; Programmable thermostat; Walk-in closets
- Laundry & utility: Laundry room; Washer; Dryer
Neighborhood map
What this means for you Summary
Snapshot
- This is a 5-bed/3.0-bath single-family listed at $299k.
Deal economics
- At list price, monthly cash flow is $-263 ($-3k/yr) — negative.
- To cash-flow at today's rent, offer at most $252k (15.6% below list).
- To meet the 1% rule (rent ≥ 1% of price), the offer needs to be $240k (19.8% below list).
- Recommended offer: $240k (19.8% below list) — sets the bar for 1% rule.
Location & tenants
- Location reads 68/100 on livability (#527 in FL) — a middle-class / working-renter tenant base. Strengths: cost of living A+, housing A+, health & safety A-; Watch: crime C-, employment D, amenities F.
- Marion (rural): math 42% / reading 43% proficiency, ranked #61 of 73 in FL (top 84%) — families likely to look elsewhere, expect single-tenant / working-renter base with shorter leases; 61% free/reduced lunch — lower-income household profile, screen leases tightly.
- Zoned schools: Greenway Elementary School (math 33% / reading 35%, grade F, #1,744 of 2,144 statewide, top 82%, 736 students, 67% FRL); Lake Weir Middle School (math 37% / reading 33%, grade F, #416 of 571 statewide, top 74%, 1,207 students, 76% FRL); Lake Weir High School (math 23% / reading 34%, grade F, #458 of 667 statewide, top 69%, 1,483 students, 68% FRL).
- Market conditions: Rents flat; 683 active listings in the ZIP; 5 comparable units currently listed for rent nearby; rentals at typical pace (median 16d on market — plan ~3-4 weeks tenant-placement turnaround); 7,071 units permitted in Marion County in 2024 (534 in 5+ unit buildings).
- This rent runs 45% of the median local income ($64k/yr) — at the standard rent-burdened threshold; future hikes will face affordability resistance.
Forward outlook
- In year one you build about $20k of equity ($2k loan paydown + $18k appreciation (5.9% local appreciation)).
- Marion County population projected at +13% by 2050 — modest demand growth; plan on rents tracking national, not racing it.
- By year 2, paydown + projected appreciation supports a ~$32k cash-out refi (75% LTV) — recoverable capital for the next deal without selling this one.
Negotiation context
- It's been on market 17 days — a 2% lower offer ($295k) is reasonable based on typical stale-listing flexibility.
- 4 sale attempts since 4y ago; this cycle's ask has dropped $16k (5%) from the opening price — seller is motivated, your offer sets the floor, not the list.
Risks & watch-outs
- Climate carrying-cost: severe wind risk, 99% chance of damaging wind over 30y; extreme-heat days projected 7→22/yr by 2055 (HVAC capex compounding) — expect insurance premiums to compound above CPI over the hold.
Questions for the listing agent
- What do current leases actually rent for vs. the listed asking? Can we see a recent rent roll and the last 12 months of T-12 income?
- What does the HOA fee cover, when was the last increase, and are there any pending special assessments or reserve-fund shortfalls?
- Is there a deadline driving the sale (1031 exchange, divorce, estate, relocation)? That informs how much negotiation room exists.
- Schools are F-rated, which usually means shorter tenancies and higher turnover. Who's the typical renter profile here, and what's been the actual vacancy rate?
- The area grade is low — what's the realistic commute time and amenity access for the typical tenant pool here? Any planned neighborhood developments (good or bad) we should know about?
- What's the average days-on-market for RENTAL listings here right now (not sales)? A rising rental-DOM trend means longer vacancies and softer asking-rent achievability than the comps imply.
- What's the recent tenant-quality profile in this submarket — average credit score on applications, eviction rate, late-payment / NSF rate, and stable-employment percentage? A property-management company in the area should have these aggregated.
- How much new for-sale + rental construction is in the pipeline within 1–3 miles? Heavy new supply typically softens prices + rents 12–24 months out; constrained supply supports both.
Investment metrics
- 1% rule
- 0.80% ✗
- Cap rate
- 5.24%
- Cash-on-cash
- -3.77%
- DSCR
- 0.83
- GRM
- 10.4
CMA / ARV
- ARV (on-the-fly)
- $372,540
- Comps found
- 3
Show comp detail 3 sales within ~0.75 mi
| Address | Dist | Beds/Ba | Sqft | Sold | Price | $/sf | Match |
|---|---|---|---|---|---|---|---|
| 123 Hickory Course Trl | 0.17mi | 5/3.0 | 2,605 (-2%) | 21mo | $356,990 | $137 | 71 |
| 324 Hickory Course Radl | 0.14mi | 4/2.0 (-1) | 2,326 (-13%) | 22mo | $328,000 | $141 | 45 |
| 131 Hickory Course Trl | 0.17mi | 4/2.0 (-1) | 2,319 (-13%) | 22mo | $324,990 | $140 | 43 |
Match score weights: distance 35% · size 25% · config 20% · recency 20%. Top-matched comps best support the ARV.
Projected returns pro-forma
5.93% appreciation · 0.17% rent growth · sell at horizon
- IRR
- 11.1%
- Equity multiple
- 1.74×
- Total profit
- $61,814
- Equity at exit
- $186,691
- IRR
- 11.2%
- Equity multiple
- 3.19×
- Total profit
- $183,457
- Equity at exit
- $337,461
Cash invested: $83,720 (down + closing). Projections, not guarantees.
Landlord ↔ Tenant lean methodology
- Overall (STATE)
- 87 Strongly Landlord-Friendly
- State Florida
- 87 Strongly Landlord-Friendly · R+3
- County
- — inherits STATE
- City
- — inherits STATE
ZIP-level market 34472
- Home prices YoY
- 2.4%
- Rents YoY
- 0.2%
- Active inventory
- 683
- Price-to-rent
- 10.4×
Monthly cashflow live
- Estimated rent
- $2,397 high interval (Pro) →
- Mortgage (P&I)
- −$1,568
- Tax from tax record
- −$414 /mo · $4,971/yr
- Insurance
- −$125
- HOA
- −$50
- Vacancy / Maint / Mgmt
- −$503
- Net cashflow
- $-263
Break-even live
Sensitivity live
| Price | -10% $-94 | -5% $-179 | +0% $-263 | +5% $-348 | +10% $-433 |
|---|---|---|---|---|---|
| Rent | -10% $-453 | -5% $-358 | +0% $-263 | +5% $-169 | +10% $-74 |
| Rate | -1.0pp $-113 | -0.5pp $-187 | base $-263 | +0.5pp $-341 | +1.0pp $-420 |
UW: 25.0% down · 7.5% · 30yr · 1.5% tax · 5.0% vac · 8.0% maint · 8.0% mgmt
Financing live
Cash to close
- Down payment
- $74,750
- Closing costs
- $8,970
- Reserves months
- —
- Total cash needed
- —
Loan-product check · same deal, 3 products live
Conventional
25% down · 7.5% · 30yr
- Down + closing
- —
- Monthly P&I
- —
- Monthly cashflow
- —
- DSCR
- —
- Eligible?
- —
Personal DTI + credit; lowest rate.
DSCR
20% down · 8.5% · 30yr
- Down + closing
- —
- Monthly P&I
- —
- Monthly cashflow
- —
- DSCR
- —
- Eligible?
- —
No personal income docs; deal must DSCR.
Hard money
10% down · 12.0% · 12mo
- Down + closing
- —
- Monthly P&I
- —
- Monthly cashflow
- —
- DSCR
- —
- Eligible?
- —
Short-term bridge; refi at stabilization.
Rent comps 5 comps
| Address | Beds | Baths | Sqft | Rent | $/sqft | DOM | Units | Dist |
|---|---|---|---|---|---|---|---|---|
| 149 Hickory Course Cir Ocala, FL | 4.0 | 2.0 | 1827 | $2,100 | $1.15 | 15d | 1 | 0.24mi |
| 51 Hickory Course Trl Ocala, FL | 4.0 | 2.0 | 2319 | $2,300 | $0.99 | 15d | 1 | 0.39mi |
| 136 Hickory Course Loop Ocala, FL | 4.0 | 2.0 | 1828 | $1,990 | $1.09 | 15d | 1 | 0.46mi |
| 5 Hickory Course Loop Ocala, FL | 4.0 | 2.0 | 2319 | $2,650 | $1.14 | 15d | 1 | 0.46mi |
| 705 Lake Diamond Ave Ocala, FL | 4.0 | 2.0 | 2588 | $1,800 | $0.70 | 23d | 1 | 1.15mi |
HOA detail
- Monthly dues
- $50 · $600/yr
- Likely covers
- electric
Listing history 13 events
-
2026-06-21pricedays on market $299,000 Active 17 DOM
-
2026-06-18days on market $304,900 Active 14 DOM
-
2026-06-17days on market $304,900 Active 13 DOM
-
2026-06-16days on market $304,900 Active 12 DOM
-
2026-06-15price $304,900 Active 11 DOM
-
2026-06-15days on market $309,900 Active 11 DOM
-
2026-06-14days on market $309,900 Active 9 DOM
-
2026-06-13days on market $309,900 Active 8 DOM
-
2026-06-10days on market $309,900 Active 6 DOM
-
2026-06-09pricedays on market $309,900 Active 5 DOM
-
2026-06-08days on market $314,900 Active 4 DOM
-
2026-06-07remarks 693-char remark
-
2026-06-07$314,900 Active 3 DOM
ⓘ Source: listings_history table (triggers on properties + properties_extension) + one-shot
backfill from property_details.listing_events for pre-trigger history.
Tax reassessment forecast FL · Resets to sale price
- Current annual tax
- $4,971 · $414/mo
- Projected year-2 tax
- $4,971 · $414/mo
- Expected delta
- $0/yr ($0/mo · 0.0%)
ⓘ Screening estimate from a state-policy table — verify with the county assessor before closing.
Climate risk First Street
- Flood 1/10 Low FEMA zone X (unshaded) · 0% chance over 30 yrs
- Wildfire 4/10 Moderate
- Heat 8/10 Severe 7 d/yr ≥108°F today · 22 d/yr by 30 yrs out
- Wind 9/10 Extreme 99% chance of damaging wind over 30 yrs
- Air quality 3/10 Moderate 3 unhealthy d/yr today · 4 by 30 yrs out
Nearby sold comps map
Loading sold comps map…
Walkable amenities ~0.75 mi
Loading nearby amenities…
Taxation est. · year 1
- Rental income
- $28,762
- − Mortgage interest
- −$16,749
- − Property taxes
- −$4,971
- − Insurance
- −$1,495
- − Repairs & maintenance
- −$2,301
- − Management
- −$2,301
- − HOA
- −$600
- − Depreciation
- −$8,698
- Taxable loss
- −$8,353
- Est. tax savings @ 24.0%
- +$2,005
- After-tax cash flow
- $-1,155/yr
For passive investors: Depreciation is non-cash, so a rental often shows a tax loss while cash-flowing — sheltering income. Rental losses are passive: they offset passive income freely, and up to $25,000/yr can offset ordinary (W-2) income if you actively participate and your MAGI is under $100k (phasing out to $0 by $150k); unused losses carry forward. On sale, claimed depreciation is recaptured at up to 25%, and gains may owe capital-gains tax (a 1031 exchange can defer both). Figures are a year-1 estimate at your 24.0% rate — not tax advice; consult a CPA.
Schools (NCES district)
- District
- Marion
- NCES district ID
- 1201260
- Math proficiency
- 42% ▼ -7.00%
- Reading proficiency
- 43% ▼ -4.00%
- Median HH income
- $40,015
- Composite
- 35.61/100
- National rank
- #4890
- State rank
- #61 of 73 in FL
Livability — Silver Springs Shores
- Score
- 68/100
- State rank
- #527
- US rank
- #9854
Category grades
Schools grade is shown separately in the Schools card above.
Census & demographics
- Census place
- Silver Springs Shores, FL
- County
- Marion County · 315,796 people
- City population
- 34,665
- Metro
- Ocala, FL
- Population (ZIP)
- 35,851
- Household income
- $64,208
- Rent vs Own
- Severe rent burden
- 655.0
Population outlook (Marion County) Hauer SSP2
- Today (2025)
- 365,905 people
- By 2030
- 376,768 · +3.0%
- By 2040
- 396,555 · +8.4%
- By 2050
- 412,723 · +12.8%
- By 2075
- 446,090 · +21.9%
- By 2100
- 436,193 · +19.2%
Race, ethnicity, and origin ACS 2023
- Neighborhood character
- Diverse neighborhood (Simpson 0.65)
- Race & ethnicity
- White 50% Hispanic / Latino 25% Black 21% Two or more races 18% Asian 2%
- Hispanic origin (detail)
- Mexican 2% Puerto Rican 14% Cuban 3%
- Common ancestry
- Romanian 2% Iranian 1% Lithuanian 1%
- Foreign-born
- 11% · Canada, Jamaica, China
- Languages at home
- 78% English-only · Spanish 19% Other Indo-European 1%
Political lean MEDSL · Marion
- 2024 margin
- Solid R (+31.6) · D 33.8% · R 65.5%
- 2008→2024 swing
- -20.0pp toward R · 2008: -11.6pp · 2024: -31.6pp
- All cycles
- 2024: R+31.6 2020: R+25.9 2016: R+26.2 2012: R+16.2 2008: R+11.6
Not yet ingested
- Civics
- —
Market trends
- HPI YoY
- ▲ 5.93%
- Current HPI
- 255.0714
- Rent YoY
- ▲ 0.17%
- Metro
- Ocala, FL
- State GDP YoY
- ▲ 3.28%
- F500 in state
- 36
Industry mix (Fortune 500 HQ in FL)
| Industry | F500 HQs | Revenue |
|---|---|---|
| Industrial Technology | 2 | $29B |
|
||
| Insurance | 2 | $17B |
|
||
| Retail | 1 | $60B |
|
||
| Technology Distribution | 1 | $58B |
|
||
| Homebuilding | 1 | $35B |
|
||
| Technology Manufacturing | 1 | $35B |
|
||
Price history
-9.8% since first listed17 events — show timeline
- 2026-06-04 Listed $314,900 Stellar MLS as Distributed by MLS Grid
- 2025-06-10 Price Changed $317,400 Stellar MLS as Distributed by MLS Grid
- 2025-04-30 Price Changed $319,900 Stellar MLS as Distributed by MLS Grid
- 2025-04-19 Price Changed $324,900 Stellar MLS as Distributed by MLS Grid
- 2025-03-21 Listed $329,900 Stellar MLS as Distributed by MLS Grid
- 2024-01-27 Rental Removed $2,350 STELLARMLS
- 2023-11-22 Price Changed $2,350 STELLARMLS
- 2023-10-20 Price Changed $2,400 STELLARMLS
- 2023-09-22 Listed for Rent $2,600 STELLARMLS
- 2022-07-28 Sold (MLS) $365,990 Stellar MLS as Distributed by MLS Grid
- 2022-03-15 Pending — Stellar MLS as Distributed by MLS Grid
- 2022-03-07 Price Changed $365,990 Stellar MLS as Distributed by MLS Grid
- 2022-02-28 Price Changed $361,990 Stellar MLS as Distributed by MLS Grid
- 2022-02-14 Price Changed $359,990 Stellar MLS as Distributed by MLS Grid
- 2022-02-07 Price Changed $356,990 Stellar MLS as Distributed by MLS Grid
- 2022-01-31 Price Changed $351,990 Stellar MLS as Distributed by MLS Grid
- 2022-01-20 Listed $348,990 Stellar MLS as Distributed by MLS Grid
Property tax history
+73.5%/yrLatest (2025): $4,971 · -1.5% YoY. Source: county tax records.
Cash-flow waterfall
monthlySold comps — $/sqft
last 12 mo · ≤1 miLoading sold comps…