1314 Quiet Roost Pl · Green Cove Springs, FL
Flood risk No data
- FEMA flood zone
- —
- Chance of flooding over 30 yrs
- —
- Est. flood insurance / yr
- —
Fire risk No data
- Est. fire insurance / yr
- —
Heat risk No data
- Hot days now (above threshold)
- —
- Hot days in 30 yrs
- —
Wind risk No data
- Chance of severe wind over 30 yrs
- —
Air-quality risk No data
- Unhealthy air days now
- —
- Unhealthy air days in 30 yrs
- —
Risk factors via First Street. Map © Google.
Why this score? — see what drove the F grade
The composite is a weighted blend of 9 inputs, each scored 0–100. Each bar is that input's sub-score; the figure is the points it added to the 100-point composite (weight × sub-score).
- ARV discount +7.5/15.0
- Cash flow +7.2/30.0
- Schools +5.1/10.0
- Condition / age +4.8/5.0
- Livability +3.8/5.0
- Rent growth +2.6/5.0
- 1% rule +2.5/10.0
- DSCR +1.4/10.0
- Appreciation +0.0/10.0
$269,940
🖨 Deal sheet (PDF) 📄 Offer letter ✓ Due diligence
Listing remarks
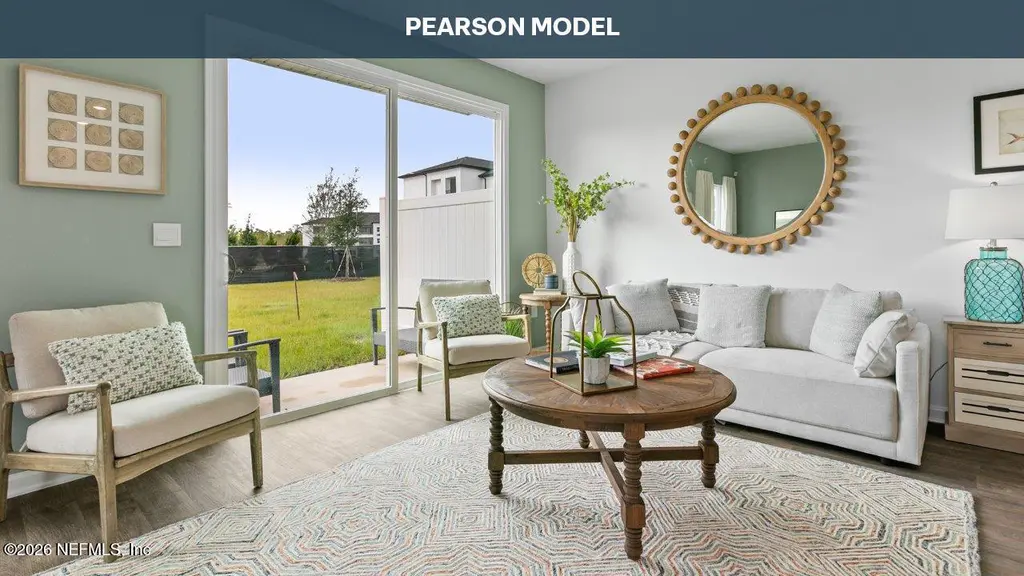
The Pearson townhome offers a smart and inviting design that makes the most of every square foot, delivering approximately 1,468 square feet of comfortable living space with three bedrooms and 2.5 bathrooms. This well-planned layout creates a sense of openness from the moment you enter, with the kitchen, dining area, and main living space flowing together to support both daily routines and special gatherings. The kitchen is designed as a true focal point, featuring an oversized bar that provides plenty of room for meal preparation, casual dining, and connecting with guests while you cook. Large sliding glass doors off the living area bring in an abundance of natural light, brightening the h
Key facts
- Walk-in closet
- Large vanity
- Natural light
Tags
Property features AI
Finance
- Financial info: CDD fee applicable
- HOA & community: Homeowners association with amenities including children's pool, dog park, fitness center, and playground; Quarterly association fee
Exterior
- Parking: Attached garage (1 car)
- Security: Smoke detector(s)
- Utilities: Public sewer; Electricity connected; Water connected; Sewer connected
- Home design: Townhouse; Two levels; Faces south; Residential use
- Construction: Fiber cement and frame construction; Other construction materials; Shingle roof
- Exterior features: Patio; Smoke detector(s); Community pool (not private)
Interior
- Kitchen: Dishwasher; Disposal; Electric range; Microwave; Electric water heater
- Bedrooms: 3 bedrooms
- Flooring: Carpet; Vinyl
- Bathrooms: 2 full bathrooms; 1 half bathroom
- Heating & cooling: Central heating; Central air (electric)
- Interior features: Kitchen island; Pantry; Smart home features; Walk-in closet(s)
- Laundry & utility: Washer hookup; Electric dryer hookup; Laundry on upper level
Neighborhood map
What this means for you Summary
Snapshot
- This is a 3-bed/2.5-bath land listed at $270k. Condition is rated excellent.
Deal economics
- At list price, monthly cash flow is $-369 ($-4k/yr) — negative.
- To cash-flow at today's rent, offer at most $217k (19.8% below list).
- To meet the 1% rule (rent ≥ 1% of price), the offer needs to be $204k (24.6% below list).
- Recommended offer: $204k (24.6% below list) — sets the bar for 1% rule.
Location & tenants
- Location reads 75/100 on livability (#245 in FL, #3,868 nationally) — a middle-class / working-renter tenant base. Strengths: cost of living A+, housing A+, health & safety A+; Watch: amenities F, commute F.
- Clay (suburban): math 58% / reading 59% proficiency, ranked #14 of 73 in FL (top 19%) — acceptable for families but not a draw, mixed tenant base, ~2y average lease.
- Zoned schools: Charles E. Bennett Elementary School (math 41% / reading 39%, grade F, #1,491 of 2,144 statewide, top 70%, 624 students, 100% FRL); Green Cove Springs Junior High School (math 63% / reading 60%, grade B+, #124 of 571 statewide, top 22%, 799 students, 38% FRL); Clay High School (math 37% / reading 53%, grade D-, #228 of 667 statewide, top 35%, 1,666 students, 43% FRL) — zoned schools average 60% FRL vs 35% district-wide (25 pts higher); higher-poverty schools than district average — tighter screening recommended.
- Market conditions: Rents flat; 891 active listings in the ZIP; 8 comparable units currently listed for rent nearby; rentals leasing fast (median 6d on market — plan ~1-2 weeks tenant-placement turnaround); solid renter incomes; 1,876 units permitted in Clay County in 2024 (14 in 5+ unit buildings).
Forward outlook
- Local home prices are declining (-3.0%/yr); year-one equity from $2k of loan paydown is wiped out by about $8k of value loss. Plan a longer hold.
- Clay County population projected at +19% by 2050 — long-run rental-demand tailwind backs the buy-and-hold thesis.
Negotiation context
- It's been on market 88 days — a 6% lower offer ($254k) is reasonable based on typical stale-listing flexibility.
Questions for the listing agent
- What do current leases actually rent for vs. the listed asking? Can we see a recent rent roll and the last 12 months of T-12 income?
- It's been on market 88 days. Have you received any prior offers? Is the seller open to a 25% concession, seller financing, or rate buy-down credit?
- What does the HOA fee cover, when was the last increase, and are there any pending special assessments or reserve-fund shortfalls?
- Why hasn't it sold? Are there any deal-killer items the seller is aware of (foundation, flood, title, zoning, code violations)?
- Is there a deadline driving the sale (1031 exchange, divorce, estate, relocation)? That informs how much negotiation room exists.
- The area grade is low — what's the realistic commute time and amenity access for the typical tenant pool here? Any planned neighborhood developments (good or bad) we should know about?
- What's the average days-on-market for RENTAL listings here right now (not sales)? A rising rental-DOM trend means longer vacancies and softer asking-rent achievability than the comps imply.
- What's the recent tenant-quality profile in this submarket — average credit score on applications, eviction rate, late-payment / NSF rate, and stable-employment percentage? A property-management company in the area should have these aggregated.
- How much new for-sale + rental construction is in the pipeline within 1–3 miles? Heavy new supply typically softens prices + rents 12–24 months out; constrained supply supports both.
Investment metrics
- 1% rule
- 0.75% ✗
- Cap rate
- 4.65%
- Cash-on-cash
- -5.85%
- DSCR
- 0.74
- GRM
- 11.1
CMA / ARV
No comps found within radius.
Projected returns pro-forma
-3.0% appreciation · 0.46% rent growth · sell at horizon
- IRR
- -29.4%
- Equity multiple
- 0.04×
- Total profit
- $-72,188
- Equity at exit
- $40,249
- IRR
- -45.8%
- Equity multiple
- -0.49×
- Total profit
- $-112,468
- Equity at exit
- $23,339
Cash invested: $75,583 (down + closing). Projections, not guarantees.
Landlord ↔ Tenant lean methodology
- Overall (STATE)
- 87 Strongly Landlord-Friendly
- State Florida
- 87 Strongly Landlord-Friendly · R+3
- County
- — inherits STATE
- City
- — inherits STATE
ZIP-level market 32043
- Home prices YoY
- -26.3%
- Rents YoY
- 0.5%
- Active inventory
- 891
- Price-to-rent
- 11.1×
Monthly cashflow live
- Estimated rent
- $2,035 high interval (Pro) →
- Mortgage (P&I)
- −$1,416
- Tax est. 1.5%
- −$337 /mo · $4,049/yr
- Insurance
- −$112
- HOA
- −$111
- Vacancy / Maint / Mgmt
- −$427
- Net cashflow
- $-369
Break-even live
Sensitivity live
| Price | -10% $-182 | -5% $-275 | +0% $-369 | +5% $-462 | +10% $-555 |
|---|---|---|---|---|---|
| Rent | -10% $-529 | -5% $-449 | +0% $-369 | +5% $-288 | +10% $-208 |
| Rate | -1.0pp $-233 | -0.5pp $-300 | base $-369 | +0.5pp $-438 | +1.0pp $-510 |
UW: 25.0% down · 7.5% · 30yr · 1.5% tax · 5.0% vac · 8.0% maint · 8.0% mgmt
Financing live
Cash to close
- Down payment
- $67,485
- Closing costs
- $8,098
- Reserves months
- —
- Total cash needed
- —
Loan-product check · same deal, 3 products live
Conventional
25% down · 7.5% · 30yr
- Down + closing
- —
- Monthly P&I
- —
- Monthly cashflow
- —
- DSCR
- —
- Eligible?
- —
Personal DTI + credit; lowest rate.
DSCR
20% down · 8.5% · 30yr
- Down + closing
- —
- Monthly P&I
- —
- Monthly cashflow
- —
- DSCR
- —
- Eligible?
- —
No personal income docs; deal must DSCR.
Hard money
10% down · 12.0% · 12mo
- Down + closing
- —
- Monthly P&I
- —
- Monthly cashflow
- —
- DSCR
- —
- Eligible?
- —
Short-term bridge; refi at stabilization.
Rent comps 8 comps
| Address | Beds | Baths | Sqft | Rent | $/sqft | DOM | Units | Dist |
|---|---|---|---|---|---|---|---|---|
| 4028 Pine Hill Pt Unit 4028 Green Cove Springs, FL | 3.0 | 2.5 | 1306 | $1,850 | $1.42 | 25d | 1 | 0.68mi |
| 4019 Pine Hill Pt Unit 4019 Green Cove Springs, FL | 3.0 | 2.5 | 1306 | $1,850 | $1.42 | 25d | 1 | 0.68mi |
| 4016 Pine Hill Pt Unit 4016 Green Cove Springs, FL | 3.0 | 2.5 | 1306 | $1,850 | $1.42 | 25d | 1 | 0.69mi |
| 1507 Julia St Green Cove Springs, FL | 3.0 | 2.0 | 1621 | $2,020 | $1.25 | 4d | 1 | 0.83mi |
| 806 Oak St Unit 14 Green Cove Springs, FL | 2.0 | 2.0 | 1200 | $1,600 | $1.33 | 6d | 1 | 1.26mi |
| 806 Oak St Unit 10 Green Cove Springs, FL | 2.0 | 1.0 | 1000 | $1,400 | $1.40 | 5d | 1 | 1.26mi |
| 806 Oak St Unit 10 Green Cove Springs, FL | 2.0 | 1.0 | 1000 | $1,400 | $1.40 | 6d | 1 | 1.26mi |
| 806 Oak St Unit 14 Green Cove Springs, FL | 2.0 | 2.0 | 1200 | $1,600 | $1.33 | 5d | 1 | 1.26mi |
HOA detail
- Monthly dues
- $111 · $1,332/yr
Listing history 15 events
-
2026-06-21days on market $269,940 Active 88 DOM
-
2026-06-18days on market $269,940 Active 85 DOM
-
2026-06-17days on market $269,940 Active 84 DOM
-
2026-06-16days on market $269,940 Active 83 DOM
-
2026-06-15days on market $269,940 Active 82 DOM
-
2026-06-13days on market $269,940 Active 80 DOM
-
2026-06-13days on market $269,940 Active 79 DOM
-
2026-06-09days on market $269,940 Active 76 DOM
-
2026-06-08days on market $269,940 Active 75 DOM
-
2026-06-07pricedays on market $269,940 Active 74 DOM
-
2026-06-03days on market $279,940 Active 70 DOM
-
2026-06-02days on market $279,940 Active 69 DOM
-
2026-06-01days on market $279,940 Active 68 DOM
-
2026-05-31days on market $279,940 Active 67 DOM
-
2026-03-25$287,940 Active
ⓘ Source: listings_history table (triggers on properties + properties_extension) + one-shot
backfill from property_details.listing_events for pre-trigger history.
Nearby sold comps map
Loading sold comps map…
Walkable amenities ~0.75 mi
Loading nearby amenities…
Taxation est. · year 1
- Rental income
- $24,425
- − Mortgage interest
- −$15,121
- − Property taxes
- −$4,049
- − Insurance
- −$1,350
- − Repairs & maintenance
- −$1,954
- − Management
- −$1,954
- − HOA
- −$1,332
- − Depreciation
- −$7,853
- Taxable loss
- −$9,188
- Est. tax savings @ 24.0%
- +$2,205
- After-tax cash flow
- $-2,217/yr
For passive investors: Depreciation is non-cash, so a rental often shows a tax loss while cash-flowing — sheltering income. Rental losses are passive: they offset passive income freely, and up to $25,000/yr can offset ordinary (W-2) income if you actively participate and your MAGI is under $100k (phasing out to $0 by $150k); unused losses carry forward. On sale, claimed depreciation is recaptured at up to 25%, and gains may owe capital-gains tax (a 1031 exchange can defer both). Figures are a year-1 estimate at your 24.0% rate — not tax advice; consult a CPA.
Condition & rehab AI · 13 photos
This Pearson townhome is in excellent condition with no visible repairs needed. It offers a smart and inviting design, making it an attractive option for both resale and rental markets. Consider updating the exterior paint, flooring, and adding smart home features to further enhance its value.
Value-add opportunities
- Both Painting the exterior and interior walls — Fresh paint can enhance curb appeal and interior aesthetics.
- Both Updating the flooring with a more modern material — New flooring can improve the overall look and feel of the home.
- Both Upgrading the kitchen appliances — Modern appliances can increase the home's appeal and functionality.
- Both Adding smart home features — Smart home technology can enhance convenience and safety, attracting tech-savvy buyers and renters.
- Both Landscaping improvements — Enhanced landscaping can increase curb appeal and attract more potential buyers and renters.
Renovation cost estimate screening
Value-add ROI direction
- Both Painting the exterior and interior walls — Fresh paint can enhance curb appeal and interior aesthetics. ↑
- Both Updating the flooring with a more modern material — New flooring can improve the overall look and feel of the home. ↑
- Both Upgrading the kitchen appliances — Modern appliances can increase the home's appeal and functionality. ↑
- Both Adding smart home features — Smart home technology can enhance convenience and safety, attracting tech-savvy buyers and renters. ↑
- Both Landscaping improvements — Enhanced landscaping can increase curb appeal and attract more potential buyers and renters. ↑
ⓘ Cost ranges are severity-bucket heuristics (US national rule-of-thumb). Get contractor quotes + a written scope before underwriting a rehab budget.
Schools (NCES district)
- District
- Clay
- NCES district ID
- 1200300
- Math proficiency
- 58% ▼ -8.00%
- Reading proficiency
- 59% ▼ -3.00%
- Median HH income
- $59,379
- Composite
- 50.73/100
- National rank
- #1815
- State rank
- #14 of 73 in FL
Livability — Green Cove Springs
- Score
- 75/100
- State rank
- #245
- US rank
- #3868
Category grades
Schools grade is shown separately in the Schools card above.
Census & demographics
- Census place
- Green Cove Springs, FL
- County
- Clay County · 208,450 people
- City population
- 34,562
- Metro
- Jacksonville, FL
- Population (ZIP)
- 34,562
- Household income
- $84,145
- Rent vs Own
- Severe rent burden
- 449.0
Population outlook (Clay County) Hauer SSP2
- Today (2025)
- 230,495 people
- By 2030
- 242,427 · +5.2%
- By 2040
- 262,244 · +13.8%
- By 2050
- 275,148 · +19.4%
- By 2075
- 295,397 · +28.2%
- By 2100
- 287,592 · +24.8%
Race, ethnicity, and origin ACS 2023
- Neighborhood character
- Predominantly White (77%)
- Race & ethnicity
- White 77% Black 10% Two or more races 7% Hispanic / Latino 6% Asian 2%
- Hispanic origin (detail)
- Mexican 2% Puerto Rican 1%
- Common ancestry
- Slovak 3% Romanian 2% Lithuanian 2%
- Foreign-born
- 5% · Canada
- Languages at home
- 92% English-only · Spanish 5% French/Haitian/Cajun 1% Other Indo-European 1%
Political lean MEDSL · Clay
- 2024 margin
- Solid R (+39.3) · D 29.9% · R 69.2%
- 2008→2024 swing
- +3.6pp toward D · 2008: -42.8pp · 2024: -39.3pp
- All cycles
- 2024: R+39.3 2020: R+37.1 2016: R+44.3 2012: R+45.8 2008: R+42.8
Not yet ingested
- Civics
- —
Market trends
- HPI YoY
- ▼ -107.34%
- Current HPI
- 301.3212
- Rent YoY
- ▲ 0.46%
- Metro
- Jacksonville, FL
- State GDP YoY
- ▲ 3.28%
- F500 in state
- 36
Industry mix (Fortune 500 HQ in FL)
| Industry | F500 HQs | Revenue |
|---|---|---|
| Industrial Technology | 2 | $29B |
|
||
| Insurance | 2 | $17B |
|
||
| Retail | 1 | $60B |
|
||
| Technology Distribution | 1 | $58B |
|
||
| Homebuilding | 1 | $35B |
|
||
| Technology Manufacturing | 1 | $35B |
|
||
Price history
1 event — show timeline
- 2026-03-25 Listed $287,940 realMLS
Cash-flow waterfall
monthlySold comps — $/sqft
last 12 mo · ≤1 miLoading sold comps…