81 High Street #9 · Amesbury, MA
Flood risk 1/10 · Minimal
- FEMA flood zone
- X (unshaded)
- Chance of flooding over 30 yrs
- 0.0%
- Est. flood insurance / yr
- $507 – $1,088
Fire risk 1/10 · Minimal
- Est. fire insurance / yr
- $915 – $1,699
Heat risk 4/10 · Minor
- Hot days now (above 94°F)
- 7 days/yr
- Hot days in 30 yrs
- 16 days/yr
Wind risk 6/10 · Moderate
- Chance of severe wind over 30 yrs
- 54.0%
Air-quality risk 3/10 · Minor
- Unhealthy air days now
- 2 days/yr
- Unhealthy air days in 30 yrs
- 3 days/yr
Risk factors via First Street. Map © Google.
Why this score? — see what drove the F grade
The composite is a weighted blend of 9 inputs, each scored 0–100. Each bar is that input's sub-score; the figure is the points it added to the 100-point composite (weight × sub-score).
- ARV discount +7.5/15.0
- Cash flow +7.4/30.0
- Rent growth +4.2/5.0
- Schools +3.9/10.0
- 1% rule +3.2/10.0
- Livability +2.5/5.0
- Condition / age +2.5/5.0
- DSCR +1.5/10.0
- Appreciation +0.0/10.0
$279,900
🖨 Deal sheet (PDF) 📄 Offer letter ✓ Due diligence
Listing remarks
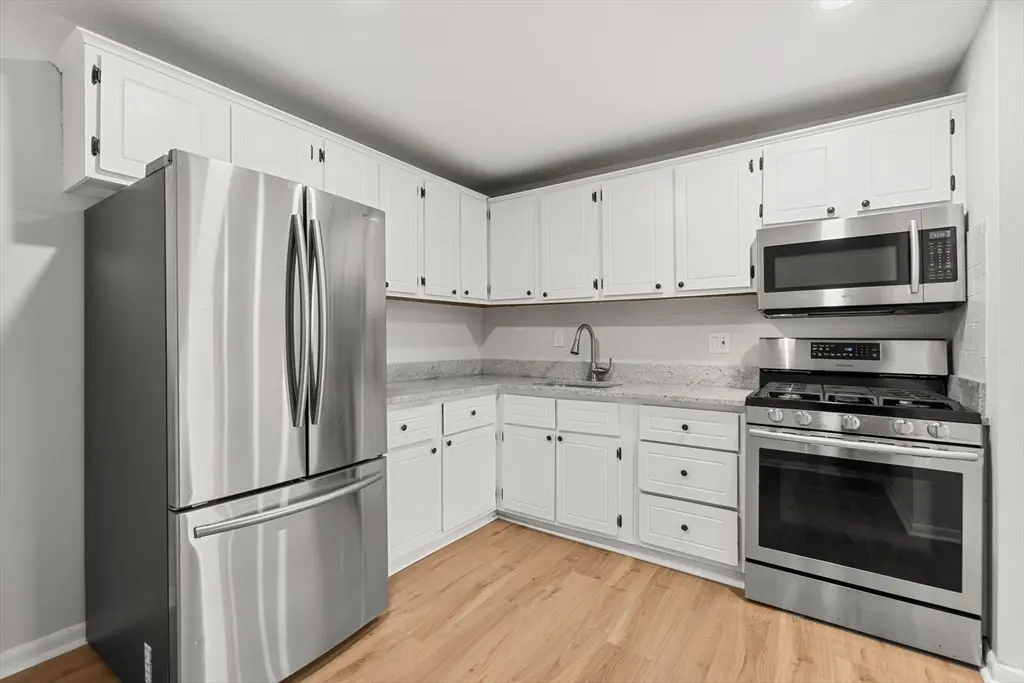
New Price! Stylish 2-bedroom condo with modern finishes near Lake Gardner Beach! This bright first-floor unit features an open-concept layout with recessed lighting and abundant natural light throughout. The updated kitchen offers stainless steel appliances, granite countertops, and ample cabinet space. Fresh paint and new flooring give the unit a clean, move-in-ready feel. Both bedrooms are generously sized with great closet space. The beautifully updated bathroom includes a tub/shower combination and convenient linen closet. Step outside to your private balcony off the living room. Heat and hot water are included in the condo fee and there are laundry facilities in the building. Located n
Key facts
- Laundry facilities
- Private balcony
- Modern finishes
Tags
Property features AI
Finance
- HOA & community: Monthly association fee; Association fee includes heat, insurance, building and grounds maintenance, snow removal, trash, and reserves; Association amenities include hot water and laundry; Pets not allowed; Community access to public transportation, shopping, parks, trails, golf, laundromat, conservation area, highway access, and places of worship
Exterior
- Parking: One open parking space
- Utilities: Public water; Public sewer; Electric with circuit breakers; Gas available for range
- Home design: Condominium garden-style unit; Single-story (entry level 1); No one below (common wall: no one below)
- Construction: Shingle roof; Garden-style structure; Year built from public records
- Exterior features: Deck; Balcony; Fenced yard; Fenced property; Near lake/pond and 0–1/10 mile to beach
Interior
- Kitchen: Stone/granite countertops; Stainless steel appliances; Gas stove; Laminate flooring
- Bedrooms: Primary bedroom on first floor with bay/bow/box window and laminate flooring; Second bedroom on first floor with bay/bow/box window and laminate flooring
- Flooring: Laminate flooring in main rooms; Stone/ceramic tile in bathroom
- Bathrooms: One full bathroom with tiled tub & shower, linen closet, and ceramic/stone tile flooring (remodeled)
- Heating & cooling: Baseboard heating; Wall unit(s) for cooling
- Interior features: Remodeled interior; Recessed lighting; Closets; Balcony / Deck
- Laundry & utility: Laundry in building; Disposal; Microwave; Refrigerator; Range
Neighborhood map
What this means for you Summary
Snapshot
- This is a 1-bed/1.0-bath condo listed at $280k.
Deal economics
- At list price, monthly cash flow is $-365 ($-4k/yr) — negative.
- To cash-flow at today's rent, offer at most $216k (23.0% below list).
- To meet the 1% rule (rent ≥ 1% of price), the offer needs to be $230k (17.9% below list).
- Recommended offer: $216k (23.0% below list) — sets the bar for cash-flow.
Location & tenants
- Location reads: area grade F — affects rentability + tenant quality, not the cash-flow math above.
- Amesbury (suburban): math 34% / reading 51% proficiency, ranked #173 of 302 in MA (top 57%) — families likely to look elsewhere, expect single-tenant / working-renter base with shorter leases.
- Zoned schools: Amesbury Elementary (math 37% / reading 52%, grade F, #421 of 938 statewide, top 48%, 328 students, 0% FRL); Amesbury Middle (math 30% / reading 46%, grade F, #154 of 305 statewide, top 51%, 584 students, 0% FRL); Amesbury High (math 57% / reading 77%, grade B, #97 of 343 statewide, top 30%, 453 students, 0% FRL) — zoned schools average 0% FRL vs 21% district-wide (21 pts lower); this property's tenant base skews higher-income than the district average.
- Market conditions: Rents rising fast (+7.0%/yr); 38 active listings in the ZIP; 7 comparable units currently listed for rent nearby; rentals leasing fast (median 0d on market — plan ~1-2 weeks tenant-placement turnaround); solid renter incomes; 1,032 units permitted in Essex County in 2024 (590 in 5+ unit buildings).
Forward outlook
- Local home prices are declining (-3.0%/yr); year-one equity from $2k of loan paydown is wiped out by about $8k of value loss. Plan a longer hold.
- Essex County population projected at +15% by 2050 — long-run rental-demand tailwind backs the buy-and-hold thesis.
Negotiation context
- It's been on market 29 days — a 2% lower offer ($276k) is reasonable based on typical stale-listing flexibility.
- Current owner paid $120k; list at $280k implies a 133% gain — meaningful room to come down on a strong offer.
Risks & watch-outs
- Climate carrying-cost: major wind risk, 54% chance of damaging wind over 30y — expect insurance premiums to compound above CPI over the hold.
Questions for the listing agent
- What do current leases actually rent for vs. the listed asking? Can we see a recent rent roll and the last 12 months of T-12 income?
- Built in 1970 — when were the roof, HVAC, electrical panel, plumbing, and water heater last replaced?
- What does the HOA fee cover, when was the last increase, and are there any pending special assessments or reserve-fund shortfalls?
- Any open or pending special assessments — roof, HVAC, plumbing, elevator, façade? What's the per-unit balance and payoff schedule, and is the seller paying it off at close or rolling it to the buyer?
- Is there a deadline driving the sale (1031 exchange, divorce, estate, relocation)? That informs how much negotiation room exists.
- The area grade is low — what's the realistic commute time and amenity access for the typical tenant pool here? Any planned neighborhood developments (good or bad) we should know about?
- What's the average days-on-market for RENTAL listings here right now (not sales)? A rising rental-DOM trend means longer vacancies and softer asking-rent achievability than the comps imply.
- What's the recent tenant-quality profile in this submarket — average credit score on applications, eviction rate, late-payment / NSF rate, and stable-employment percentage? A property-management company in the area should have these aggregated.
- How much new apartment / multifamily construction is in the pipeline within 1–3 miles? Heavy new supply (>2% of stock underway) typically softens rents 12–24 months out; light construction supports rent growth.
Investment metrics
- 1% rule
- 0.82% ✗
- Cap rate
- 4.73%
- Cash-on-cash
- -5.58%
- DSCR
- 0.75
- GRM
- 10.2
CMA / ARV
No comps found within radius.
Projected returns pro-forma
-3.0% appreciation · 7.0% rent growth · sell at horizon
- IRR
- -20.8%
- Equity multiple
- 0.25×
- Total profit
- $-58,772
- Equity at exit
- $41,734
- IRR
- -6.2%
- Equity multiple
- 0.52×
- Total profit
- $-37,466
- Equity at exit
- $24,201
Cash invested: $78,372 (down + closing). Projections, not guarantees.
Landlord ↔ Tenant lean methodology
- Overall (STATE)
- 20 Strongly Tenant-Friendly
- State Massachusetts
- 20 Strongly Tenant-Friendly · D+15
- County
- — inherits STATE
- City
- — inherits STATE
ZIP-level market 01913
- Home prices YoY
- -30.4%
- Rents YoY
- 7.0%
- Active inventory
- 38
- Price-to-rent
- 10.2×
Monthly cashflow live
- Estimated rent
- $2,297 high interval (Pro) →
- Mortgage (P&I)
- −$1,468
- Tax from tax record
- −$204 /mo · $2,446/yr
- Insurance
- −$117
- HOA
- −$391
- Vacancy / Maint / Mgmt
- −$482
- Net cashflow
- $-365
Break-even live
Sensitivity live
| Price | -10% $-206 | -5% $-285 | +0% $-365 | +5% $-444 | +10% $-523 |
|---|---|---|---|---|---|
| Rent | -10% $-546 | -5% $-455 | +0% $-365 | +5% $-274 | +10% $-183 |
| Rate | -1.0pp $-224 | -0.5pp $-293 | base $-365 | +0.5pp $-437 | +1.0pp $-511 |
UW: 25.0% down · 7.5% · 30yr · 1.5% tax · 5.0% vac · 8.0% maint · 8.0% mgmt
Financing live
Cash to close
- Down payment
- $69,975
- Closing costs
- $8,397
- Reserves months
- —
- Total cash needed
- —
Loan-product check · same deal, 3 products live
Conventional
25% down · 7.5% · 30yr
- Down + closing
- —
- Monthly P&I
- —
- Monthly cashflow
- —
- DSCR
- —
- Eligible?
- —
Personal DTI + credit; lowest rate.
DSCR
20% down · 8.5% · 30yr
- Down + closing
- —
- Monthly P&I
- —
- Monthly cashflow
- —
- DSCR
- —
- Eligible?
- —
No personal income docs; deal must DSCR.
Hard money
10% down · 12.0% · 12mo
- Down + closing
- —
- Monthly P&I
- —
- Monthly cashflow
- —
- DSCR
- —
- Eligible?
- —
Short-term bridge; refi at stabilization.
Rent comps 7 comps
| Address | Beds | Baths | Sqft | Rent | $/sqft | DOM | Units | Dist |
|---|---|---|---|---|---|---|---|---|
| 23 Chester St #1 Amesbury, MA | 1.0 | 1.5 | 903 | $2,900 | $3.21 | 0d | 1 | 0.19mi |
| 8 Carriage Hill Rd Unit CH8-23 Amesbury, MA | 2.0 | 1.0 | 700 | $2,250 | $3.21 | 0d | 1 | 0.41mi |
| 100-106 Whitehall Rd Amesbury, MA | 1.0–2.0 | 1.0 | 675 | $1,800 | $2.67 | 0d | 4 | 0.45mi |
| 10 Harrison Ave Fl 2 Amesbury, MA | 2.0 | 1.0 | 850 | $2,375 | $2.79 | 25d | 1 | 0.53mi |
| 10 Huntington Ave Amesbury, MA | 1.0 | 1.0 | 650 | $2,200 | $3.38 | 19d | 1 | 0.77mi |
| 164 Whitehall Rd Amesbury, MA | 1.0–2.0 | 1.0 | 784 | $2,050 | $2.61 | 0d | 7 | 1.18mi |
| 36 Haverhill Rd Amesbury, MA | 1.0–2.0 | 1.0–2.0 | 990 | $2,508 | $2.53 | 0d | 9 | 1.30mi |
HOA detail condo
- Monthly dues
- $391 · $4,692/yr
- Likely covers
- water
- Assessments
- None detected in remarks — confirm with the listing agent.
Listing history 12 events
-
2026-06-13days on market $279,900 Active 29 DOM
-
2026-06-09days on market $279,900 Active 26 DOM
-
2026-06-08days on market $279,900 Active 25 DOM
-
2026-06-07statusdays on market $279,900 Active 24 DOM
-
2026-06-04days on market $279,900 Price Changed 21 DOM
-
2026-06-03days on market $279,900 Price Changed 20 DOM
-
2026-06-02pricestatusdays on market $279,900 Price Changed 19 DOM
-
2026-06-01days on market $289,900 Active 18 DOM
-
2026-05-31days on market $289,900 Active 17 DOM
-
2026-05-14$289,900 New 986-char remark
-
2018-10-25soldstatus $120,000
-
1995-11-13soldstatus $17,500
ⓘ Source: listings_history table (triggers on properties + properties_extension) + one-shot
backfill from property_details.listing_events for pre-trigger history.
Tax reassessment forecast MA · Partial reset (capped growth)
- Current annual tax
- $2,446 · $204/mo
- Projected year-2 tax
- $2,944 · $245/mo
- Expected delta
- +$498/yr (+$42/mo · 20.4%)
ⓘ Screening estimate from a state-policy table — verify with the county assessor before closing.
Climate risk First Street
- Flood 1/10 Low FEMA zone X (unshaded) · 0% chance over 30 yrs
- Wildfire 1/10 Low
- Heat 4/10 Moderate 7 d/yr ≥94°F today · 16 d/yr by 30 yrs out
- Wind 6/10 Major 54% chance of damaging wind over 30 yrs
- Air quality 3/10 Moderate 2 unhealthy d/yr today · 3 by 30 yrs out
Nearby sold comps map
Loading sold comps map…
Walkable amenities ~0.75 mi
Loading nearby amenities…
Taxation est. · year 1
- Rental income
- $27,566
- − Mortgage interest
- −$15,679
- − Property taxes
- −$2,446
- − Insurance
- −$1,400
- − Repairs & maintenance
- −$2,205
- − Management
- −$2,205
- − HOA
- −$4,692
- − Depreciation
- −$8,143
- Taxable loss
- −$9,204
- Est. tax savings @ 24.0%
- +$2,209
- After-tax cash flow
- $-2,166/yr
For passive investors: Depreciation is non-cash, so a rental often shows a tax loss while cash-flowing — sheltering income. Rental losses are passive: they offset passive income freely, and up to $25,000/yr can offset ordinary (W-2) income if you actively participate and your MAGI is under $100k (phasing out to $0 by $150k); unused losses carry forward. On sale, claimed depreciation is recaptured at up to 25%, and gains may owe capital-gains tax (a 1031 exchange can defer both). Figures are a year-1 estimate at your 24.0% rate — not tax advice; consult a CPA.
Schools (NCES district)
- District
- Amesbury
- NCES district ID
- 2501860
- Math proficiency
- 34% ▼ -20.00%
- Reading proficiency
- 51% ▼ -8.00%
- Median HH income
- $75,584
- Composite
- 38.95/100
- National rank
- #4082
- State rank
- #173 of 302 in MA
Livability — Amesbury
No livability data for this city. (Only ~50 U.S. cities are tracked.)
Census & demographics
- Census place
- Amesbury Town, MA
- County
- Essex County · 632,995 people
- City population
- 17,403
- Metro
- Boston-Cambridge-Newton, MA-NH
- Population (ZIP)
- 17,403
- Household income
- $103,554
- Rent vs Own
- Severe rent burden
- 703.0
Population outlook (Essex County) Hauer SSP2
- Today (2025)
- 840,920 people
- By 2030
- 872,201 · +3.7%
- By 2040
- 927,918 · +10.3%
- By 2050
- 970,206 · +15.4%
- By 2075
- 1,077,993 · +28.2%
- By 2100
- 1,103,053 · +31.2%
Race, ethnicity, and origin ACS 2023
- Neighborhood character
- Predominantly White (86%)
- Race & ethnicity
- White 86% Two or more races 6% Hispanic / Latino 4% Black 3% Asian 1%
- Common ancestry
- Lithuanian 8% Romanian 5% Slovak 3%
- Foreign-born
- 9% · Canada
- Languages at home
- 92% English-only · Spanish 2% Other Indo-European 2% Arabic 1%
Political lean MEDSL · Essex
- 2024 margin
- Strong D (+20.3) · D 59.2% · R 38.9% · Other 1.9%
- 2008→2024 swing
- 0.0pp no change · 2008: 20.3pp · 2024: 20.3pp
- All cycles
- 2024: D+20.3 2020: D+29.1 2016: D+22.5 2012: D+16.2 2008: D+20.3
Not yet ingested
- Civics
- —
Market trends
- HPI YoY
- ▼ -132.68%
- Current HPI
- 303.1683
- Rent YoY
- ▲ 7.00%
- Metro
- Boston-Cambridge-Newton, MA-NH
- State GDP YoY
- ▲ 2.28%
- F500 in state
- 38
Industry mix (Fortune 500 HQ in MA)
| Industry | F500 HQs | Revenue |
|---|---|---|
| Technology | 3 | $17B |
|
||
| Insurance | 2 | $84B |
|
||
| Retail | 2 | $76B |
|
||
| Life Sciences | 1 | $43B |
|
||
| Energy Technology | 1 | $31B |
|
||
| Aerospace / Defense | 1 | $18B |
|
||
Price history
+585.7% since first listed2 events — show timeline
- 2018-10-25 Sold (Public Records) $120,000 Public Records
- 1995-11-13 Sold (Public Records) $17,500 Public Records
Property tax history
+2.6%/yrLatest (2023): $2,446 · +13.1% YoY. Source: county tax records.
Cash-flow waterfall
monthlySold comps — $/sqft
last 12 mo · ≤1 miLoading sold comps…