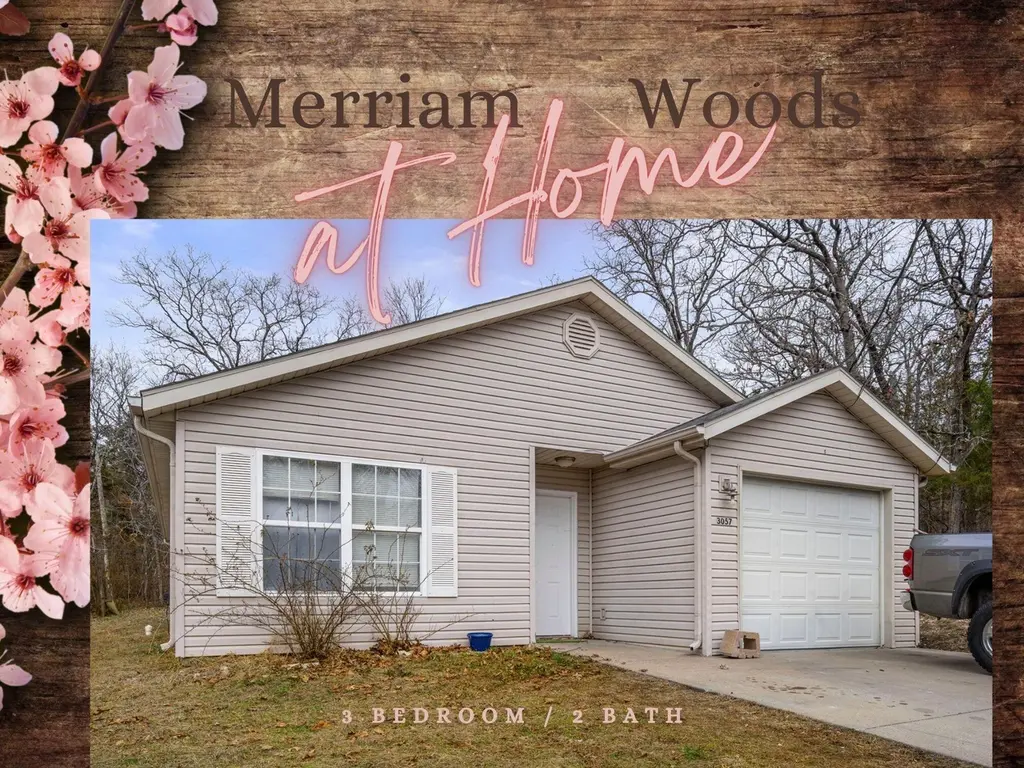
3057 Driftwood Rd · Merriam Woods, MO
Flood risk 1/10 · Minimal
- FEMA flood zone
- X (unshaded)
- Chance of flooding over 30 yrs
- 0.0%
- Est. flood insurance / yr
- $473 – $860
Fire risk 3/10 · Minor
- Est. fire insurance / yr
- $1,054 – $1,958
Heat risk 4/10 · Minor
- Hot days now (above 106°F)
- 7 days/yr
- Hot days in 30 yrs
- 20 days/yr
Wind risk 2/10 · Minimal
- Chance of severe wind over 30 yrs
- 1.0%
Air-quality risk 2/10 · Minimal
- Unhealthy air days now
- 0 days/yr
- Unhealthy air days in 30 yrs
- 1 days/yr
Risk factors via First Street. Map © Google.
Why this score? — see what drove the C grade
The composite is a weighted blend of 9 inputs, each scored 0–100. Each bar is that input's sub-score; the figure is the points it added to the 100-point composite (weight × sub-score).
- Cash flow +16.9/30.0
- Appreciation +10.0/10.0
- ARV discount +7.5/15.0
- DSCR +5.2/10.0
- Schools +4.2/10.0
- 1% rule +3.4/10.0
- Livability +3.1/5.0
- Rent growth +2.5/5.0
- Condition / age +2.5/5.0
$189,000
🖨 Deal sheet 📄 Offer letter ✓ Due diligence
Listing remarks
NEWLY PAINTED HOME & PAINTED GARAGE FLOOR & WALLS This well-priced, single-level home offers comfort, convenience, and excellent potential for both first-time buyers and investors. Featuring 3 bedrooms and 2 full bathrooms, the open-concept layout seamlessly connects the kitchen and living room, creating a warm and inviting space for everyday living. Enjoy relaxing mornings on the welcoming front porch and summer evenings on the rear deck, perfect for backyard BBQs. The home offers true one-level living, complete with a washer/dryer closet and a one-car garage that provides ample room for parking, storage, shelving, or organizing seasonal decor and lawn equipment. The kitchen
Key facts
- Double paned windows
- Front porch
- Rear deck
Tags
Neighborhood map
What this means for you Summary
Snapshot
- This is a 3-bed/1.0-bath other listed at $189k.
Deal economics
- At list price, monthly cash flow is $123 ($1k/yr) — positive.
- The deal already cash-flows at list — no discount required.
- To meet the 1% rule (rent ≥ 1% of price), the offer needs to be $158k (16.4% below list).
- Recommended offer: $158k (16.4% below list) — sets the bar for 1% rule.
Location & tenants
- Location reads 61/100 on livability (#444 in MO) — a middle-class / working-renter tenant base. Strengths: cost of living A+, housing A+, crime B; Watch: health & safety C-, amenities F, commute F.
- Branson R-IV (rural): math 48% / reading 52% proficiency, ranked #44 of 324 in MO (top 14%) — acceptable for families but not a draw, mixed tenant base, ~2y average lease.
- Zoned schools: Branson Jr. High (math 48% / reading 49%, grade C-, #81 of 391 statewide, top 21%, 724 students, 51% FRL); Branson High (math 42% / reading 56%, grade D, #145 of 521 statewide, top 28%, 1,423 students, 46% FRL) — zoned schools at 48% FRL track the district average.
- Market conditions: 99 active listings in the ZIP; 331 units permitted in Taney County in 2024 (50 in 5+ unit buildings).
Forward outlook
- In year one you build about $20k of equity ($1k loan paydown + $19k appreciation (10.0% local appreciation)).
- Taney County population projected at +17% by 2050 — long-run rental-demand tailwind backs the buy-and-hold thesis.
- At projected returns (10.0% appreciation + 3.0% rent growth), your $53k cash investment doubles in ~3 years — after that, you're playing with house money.
- By year 2, paydown + projected appreciation supports a ~$32k cash-out refi (75% LTV) — recoverable capital for the next deal without selling this one.
Negotiation context
- It's been on market 92 days — a 9% lower offer ($172k) is reasonable based on typical stale-listing flexibility.
- 2 sale attempts; this cycle's ask has dropped $21k (10%) from the opening price — seller is motivated, your offer sets the floor, not the list.
Questions for the listing agent
- It's been on market 92 days. Have you received any prior offers? Is the seller open to a 16% concession, seller financing, or rate buy-down credit?
- Why hasn't it sold? Are there any deal-killer items the seller is aware of (foundation, flood, title, zoning, code violations)?
- Is there a deadline driving the sale (1031 exchange, divorce, estate, relocation)? That informs how much negotiation room exists.
- Schools are F-rated, which usually means shorter tenancies and higher turnover. Who's the typical renter profile here, and what's been the actual vacancy rate?
- What's the average days-on-market for RENTAL listings here right now (not sales)? A rising rental-DOM trend means longer vacancies and softer asking-rent achievability than the comps imply.
- What's the recent tenant-quality profile in this submarket — average credit score on applications, eviction rate, late-payment / NSF rate, and stable-employment percentage? A property-management company in the area should have these aggregated.
- How much new for-sale + rental construction is in the pipeline within 1–3 miles? Heavy new supply typically softens prices + rents 12–24 months out; constrained supply supports both.
Investment metrics
- 1% rule
- 0.84% ✗
- Cap rate
- 7.07%
- Cash-on-cash
- 2.79%
- DSCR
- 1.12
- GRM
- 10.0
CMA / ARV
No comps found within radius.
Projected returns pro-forma
10.0% appreciation · 3.0% rent growth · sell at horizon
- IRR
- 26.3%
- Equity multiple
- 3.09×
- Total profit
- $110,674
- Equity at exit
- $170,266
- IRR
- 23.0%
- Equity multiple
- 7.04×
- Total profit
- $319,590
- Equity at exit
- $367,185
Cash invested: $52,920 (down + closing). Projections, not guarantees.
Landlord ↔ Tenant lean methodology
- Overall (STATE)
- 81 Strongly Landlord-Friendly
- State Missouri
- 81 Strongly Landlord-Friendly · R+10
- County
- — inherits STATE
- City
- — inherits STATE
ZIP-level market 65740
- Home prices YoY
- 11.6%
- Active inventory
- 99
- Price-to-rent
- 10.0×
Monthly cashflow live
- Estimated rent
- $1,581 medium interval (Pro) →
- Mortgage (P&I)
- −$991
- Tax from tax record
- −$56 /mo · $674/yr
- Insurance
- −$79
- HOA
- −$0
- Vacancy / Maint / Mgmt
- −$332
- Net cashflow
- $123
Break-even live
UW: 25.0% down · 7.5% · 30yr · 1.5% tax · 5.0% vac · 8.0% maint · 8.0% mgmt
Financing live
Cash to close
- Down payment
- $47,250
- Closing costs
- $5,670
- Reserves months
- —
- Total cash needed
- —
Loan-product check · same deal, 3 products live
Conventional
25% down · 7.5% · 30yr
- Down + closing
- —
- Monthly P&I
- —
- Monthly cashflow
- —
- DSCR
- —
- Eligible?
- —
Personal DTI + credit; lowest rate.
DSCR
20% down · 8.5% · 30yr
- Down + closing
- —
- Monthly P&I
- —
- Monthly cashflow
- —
- DSCR
- —
- Eligible?
- —
No personal income docs; deal must DSCR.
Hard money
10% down · 12.0% · 12mo
- Down + closing
- —
- Monthly P&I
- —
- Monthly cashflow
- —
- DSCR
- —
- Eligible?
- —
Short-term bridge; refi at stabilization.
Listing history 14 events
-
2026-04-27status Pending
-
2026-04-10price $189,000
-
2026-04-02price $199,900
-
2026-03-27price $203,400
-
2026-03-20price $204,900
-
2026-03-13price $206,400
-
2026-03-04price $207,900
-
2026-01-24$209,900 Active
-
2025-10-05historical $1,300
-
2025-09-04$1,300
-
2006-01-18soldstatus
-
2005-07-19soldstatus
-
2005-01-28soldstatus
-
1983-10-01soldstatus
ⓘ Source: listings_history table (triggers on properties + properties_extension) + one-shot
backfill from property_details.listing_events for pre-trigger history.
Tax reassessment forecast MO · Resets to sale price
- Current annual tax
- $674 · $56/mo
- Projected year-2 tax
- $1,833 · $153/mo
- Expected delta
- +$1,159/yr (+$97/mo · 171.9%)
ⓘ Screening estimate from a state-policy table — verify with the county assessor before closing.
Climate risk First Street
- Flood 1/10 Low FEMA zone X (unshaded) · 0% chance over 30 yrs
- Wildfire 3/10 Moderate
- Heat 4/10 Moderate 7 d/yr ≥106°F today · 20 d/yr by 30 yrs out
- Wind 2/10 Low 100% chance of damaging wind over 30 yrs
- Air quality 2/10 Low 0 unhealthy d/yr today · 1 by 30 yrs out
Nearby sold comps map
Loading sold comps map…
Walkable amenities ~0.75 mi
Loading nearby amenities…
Taxation est. · year 1
- Rental income
- $18,972
- − Mortgage interest
- −$10,587
- − Property taxes
- −$674
- − Insurance
- −$945
- − Repairs & maintenance
- −$1,518
- − Management
- −$1,518
- − Depreciation
- −$5,498
- Taxable loss
- −$1,768
- Est. tax savings @ 24.0%
- +$424
- After-tax cash flow
- $1,899/yr
For passive investors: Depreciation is non-cash, so a rental often shows a tax loss while cash-flowing — sheltering income. Rental losses are passive: they offset passive income freely, and up to $25,000/yr can offset ordinary (W-2) income if you actively participate and your MAGI is under $100k (phasing out to $0 by $150k); unused losses carry forward. On sale, claimed depreciation is recaptured at up to 25%, and gains may owe capital-gains tax (a 1031 exchange can defer both). Figures are a year-1 estimate at your 24.0% rate — not tax advice; consult a CPA.
Schools (NCES district)
- District
- Branson R-IV
- NCES district ID
- 2905760
- Math proficiency
- 48% ▼ -6.00%
- Reading proficiency
- 52% ▼ -3.00%
- Median HH income
- $41,473
- Composite
- 41.96/100
- National rank
- #3347
- State rank
- #44 of 324 in MO
Livability — Merriam Woods
- Score
- 61/100
- State rank
- #444
- US rank
- #18151
Category grades
Schools grade is shown separately in the Schools card above.
Census & demographics
- Census place
- Merriam Woods, MO
- City population
- 3,495
- Population (ZIP)
- 3,495
Population outlook (Taney County) Hauer SSP2
- Today (2025)
- 59,017 people
- By 2030
- 61,235 · +3.8%
- By 2040
- 65,225 · +10.5%
- By 2050
- 68,842 · +16.6%
- By 2075
- 77,705 · +31.7%
- By 2100
- 82,002 · +38.9%
Race, ethnicity, and origin ACS 2023
- Neighborhood character
- Predominantly White (85%)
- Race & ethnicity
- White 85% Hispanic / Latino 9% Two or more races 8% Black 2%
- Hispanic origin (detail)
- Mexican 6%
- Common ancestry
- Slovak 3% Iranian 3% Lithuanian 1%
- Foreign-born
- 1% · Canada
- Languages at home
- 93% English-only · Spanish 6% German/W. Germanic 1%
Political lean MEDSL · Taney
- 2024 margin
- Solid R (+59.3) · D 19.9% · R 79.2%
- 2008→2024 swing
- -22.2pp toward R · 2008: -37.2pp · 2024: -59.3pp
- All cycles
- 2024: R+59.3 2020: R+57.7 2016: R+59.3 2012: R+47.4 2008: R+37.2
Not yet ingested
- Civics
- —
Market trends
- HPI YoY
- ▲ 30.18%
- Current HPI
- 291.5553
- Rent YoY
- —
- Metro
- —
- State GDP YoY
- ▲ 1.84%
- F500 in state
- 20
Industry mix (Fortune 500 HQ in MO)
| Industry | F500 HQs | Revenue |
|---|---|---|
| Healthcare | 1 | $163B |
|
||
| Insurance | 1 | $21B |
|
||
| Industrial Technology | 1 | $17B |
|
||
| Retail | 1 | $16B |
|
||
| Industrial Distribution | 1 | $10B |
|
||
| Utilities | 1 | $9B |
|
||
Price history
+14438.5% since first listed14 events — show timeline
- 2026-04-27 Pending — SOMO
- 2026-04-10 Price Changed $189,000 SOMO
- 2026-04-02 Price Changed $199,900 SOMO
- 2026-03-27 Price Changed $203,400 SOMO
- 2026-03-20 Price Changed $204,900 SOMO
- 2026-03-13 Price Changed $206,400 SOMO
- 2026-03-04 Price Changed $207,900 SOMO
- 2026-01-24 Listed $209,900 SOMO
- 2025-10-05 Rental Removed $1,300 APPFOLIO
- 2025-09-04 Listed for Rent $1,300 APPFOLIO
- 2006-01-18 Sold (Public Records) — Public Records
- 2005-07-19 Sold (Public Records) — Public Records
- 2005-01-28 Sold (Public Records) — Public Records
- 1983-10-01 Sold (Public Records) — Public Records
Property tax history
+0.1%/yrLatest (2025): $674 · -21.5% YoY. Source: county tax records.
Cash-flow waterfall
monthlySold comps — $/sqft
last 12 mo · ≤1 miLoading sold comps…