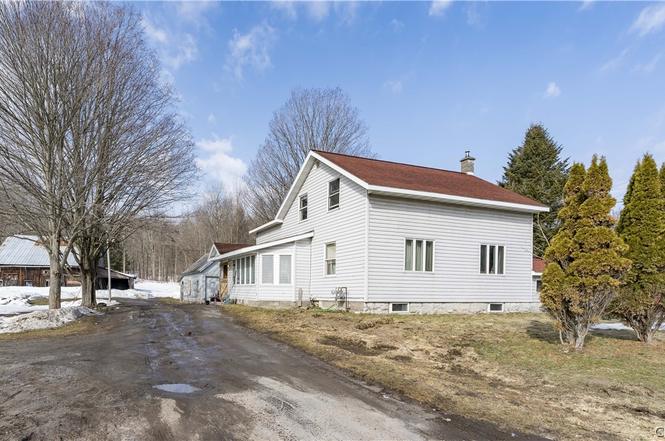
4263 State Route 12 · Lyons Falls, NY
Flood risk 1/10 · Minimal
- FEMA flood zone
- X
- Chance of flooding over 30 yrs
- 0.0%
- Est. flood insurance / yr
- $473 – $860
Fire risk 1/10 · Minimal
- Est. fire insurance / yr
- $691 – $1,283
Heat risk 1/10 · Minimal
- Hot days now (above 90°F)
- 7 days/yr
- Hot days in 30 yrs
- 17 days/yr
Wind risk 1/10 · Minimal
- Chance of severe wind over 30 yrs
- —
Air-quality risk 2/10 · Minimal
- Unhealthy air days now
- 0 days/yr
- Unhealthy air days in 30 yrs
- 1 days/yr
Risk factors via First Street. Map © Google.
Why this score? — see what drove the B- grade
The composite is a weighted blend of 9 inputs, each scored 0–100. Each bar is that input's sub-score; the figure is the points it added to the 100-point composite (weight × sub-score).
- Cash flow +25.9/30.0
- DSCR +8.7/10.0
- 1% rule +7.6/10.0
- ARV discount +7.5/15.0
- Appreciation +5.1/10.0
- Schools +3.9/10.0
- Livability +2.9/5.0
- Rent growth +2.5/5.0
- Condition / age +2.5/5.0
$99,900
🖨 Deal sheet 📄 Offer letter ✓ Due diligence
Listing remarks MLS
Charming 4 bedrooms home has many updates. First floor bedroom and 3 up give optimal usage of home large living room and dining room. First floor laundry and a large enclosed porch leads to 4.5 acres. Large Barn needs some improvements but the 1 stall garage is great for storage needs.
Key facts
- Enclosed side porch
- Formal dining room
- Laundry area
Tags
Neighborhood map
What this means for you Summary
Snapshot
- This is a 3-bed/1.0-bath single-family listed at $100k.
Deal economics
- At list price, monthly cash flow is $247 ($3k/yr) — positive.
- The deal already cash-flows at list — no discount required.
- Meets the 1% rule at list price ($1k rent vs $100k).
- Cap rate 9.3% vs local median 1.8% in Lyons Falls — top-decile yield for the area; either an underpriced asset or a hidden risk that comps aren't pricing in. Stress-test before assuming the spread holds.
Location & tenants
- Location reads 57/100 on livability (#1,075 in NY) — a working-class tenant base; expect higher turnover. Strengths: cost of living A+, housing A-; Watch: health & safety C-, employment D, schools F.
- South Lewis Central School District (rural): math 43% / reading 50% proficiency, ranked #450 of 590 in NY (top 76%) — families likely to look elsewhere, expect single-tenant / working-renter base with shorter leases.
- Market conditions: 11 active listings in the ZIP; 110 units permitted in Lewis County in 2024 (0 in 5+ unit buildings).
Forward outlook
- In year one you build about $892 of equity ($691 loan paydown + $201 appreciation (0.2% local appreciation)).
- Lewis County population projected at -20% by 2050 — secular population decline; favor cash flow + early exit over multi-decade hold.
- At projected returns (0.2% appreciation + 3.0% rent growth), your $28k cash investment doubles in ~6 years — after that, you're playing with house money.
Negotiation context
- Only 6 days on market — expect competitive offers; lowballing is unlikely to land.
- 2 sale attempts since 14y ago with the ask held roughly flat each time — persistent listings suggest the price (not the market) is what's stuck; bring a comps-based counter.
- Current owner paid $70k; 43% above their basis — modest negotiation headroom, anchor on the comps not their cost.
Risks & watch-outs
- Watch-outs: built in 1920 — expect roof / HVAC / electrical / plumbing capex.
Questions for the listing agent
- Built in 1920 — when were the roof, HVAC, electrical panel, plumbing, and water heater last replaced?
- Is there a deadline driving the sale (1031 exchange, divorce, estate, relocation)? That informs how much negotiation room exists.
- Schools are F-rated, which usually means shorter tenancies and higher turnover. Who's the typical renter profile here, and what's been the actual vacancy rate?
- Crime grade is F in this area — have there been break-ins, vandalism, or insurance claims at this property in the last 3 years? What carrier currently insures it and at what premium?
- What's the average days-on-market for RENTAL listings here right now (not sales)? A rising rental-DOM trend means longer vacancies and softer asking-rent achievability than the comps imply.
- What's the recent tenant-quality profile in this submarket — average credit score on applications, eviction rate, late-payment / NSF rate, and stable-employment percentage? A property-management company in the area should have these aggregated.
- How much new for-sale + rental construction is in the pipeline within 1–3 miles? Heavy new supply typically softens prices + rents 12–24 months out; constrained supply supports both.
Investment metrics
- 1% rule
- 1.26% ✓
- Cap rate
- 9.26%
- Cash-on-cash
- 10.58%
- DSCR
- 1.47
- GRM
- 6.6
CMA / ARV
No comps found within radius.
Projected returns pro-forma
0.2% appreciation · 3.0% rent growth · sell at horizon
- IRR
- 10.2%
- Equity multiple
- 1.49×
- Total profit
- $13,790
- Equity at exit
- $30,017
- IRR
- 14.9%
- Equity multiple
- 2.67×
- Total profit
- $46,638
- Equity at exit
- $36,897
Cash invested: $27,972 (down + closing). Projections, not guarantees.
Landlord ↔ Tenant lean methodology
- Overall (STATE)
- 15 Strongly Tenant-Friendly
- State New York
- 15 Strongly Tenant-Friendly · D+10
- County
- — inherits STATE
- City
- — inherits STATE
ZIP-level market 13368
- Home prices YoY
- 0.1%
- Active inventory
- 11
- Price-to-rent
- 6.6×
Monthly cashflow live
- Estimated rent
- $1,255 medium interval (Pro) →
- Mortgage (P&I)
- −$524
- Tax from tax record
- −$179 /mo · $2,151/yr
- Insurance
- −$42
- HOA
- −$0
- Vacancy / Maint / Mgmt
- −$264
- Net cashflow
- $247
Break-even live
UW: 25.0% down · 7.5% · 30yr · 1.5% tax · 5.0% vac · 8.0% maint · 8.0% mgmt
Financing live
Cash to close
- Down payment
- $24,975
- Closing costs
- $2,997
- Reserves months
- —
- Total cash needed
- —
Loan-product check · same deal, 3 products live
Conventional
25% down · 7.5% · 30yr
- Down + closing
- —
- Monthly P&I
- —
- Monthly cashflow
- —
- DSCR
- —
- Eligible?
- —
Personal DTI + credit; lowest rate.
DSCR
20% down · 8.5% · 30yr
- Down + closing
- —
- Monthly P&I
- —
- Monthly cashflow
- —
- DSCR
- —
- Eligible?
- —
No personal income docs; deal must DSCR.
Hard money
10% down · 12.0% · 12mo
- Down + closing
- —
- Monthly P&I
- —
- Monthly cashflow
- —
- DSCR
- —
- Eligible?
- —
Short-term bridge; refi at stabilization.
Listing history 4 events
-
2026-03-16status Pending
-
2026-03-10$99,900 Active
-
2012-09-28soldstatus $70,000 286-char remark
Show marketing remark (286 chars)
Charming 4 bedrooms home has many updates. First floor bedroom and 3 up give optimal usage of home large living room and dining room. First floor laundry and a large enclosed porch leads to 4.5 acres. Large Barn needs some improvements but the 1 stall garage is great for storage needs.
-
2012-06-12$67,500 286-char remark
Show marketing remark (286 chars)
Charming 4 bedrooms home has many updates. First floor bedroom and 3 up give optimal usage of home large living room and dining room. First floor laundry and a large enclosed porch leads to 4.5 acres. Large Barn needs some improvements but the 1 stall garage is great for storage needs.
ⓘ Source: listings_history table (triggers on properties + properties_extension) + one-shot
backfill from property_details.listing_events for pre-trigger history.
Tax reassessment forecast NY · Partial reset (capped growth)
- Current annual tax
- $2,151 · $179/mo
- Projected year-2 tax
- $2,151 · $179/mo
- Expected delta
- $0/yr ($0/mo · 0.0%)
ⓘ Screening estimate from a state-policy table — verify with the county assessor before closing.
Climate risk First Street
- Flood 1/10 Low FEMA zone X · 0% chance over 30 yrs
- Wildfire 1/10 Low
- Heat 1/10 Low 7 d/yr ≥90°F today · 17 d/yr by 30 yrs out
- Wind 1/10 Low
- Air quality 2/10 Low 0 unhealthy d/yr today · 1 by 30 yrs out
Nearby sold comps map
Loading sold comps map…
Walkable amenities ~0.75 mi
Loading nearby amenities…
Taxation est. · year 1
- Rental income
- $15,060
- − Mortgage interest
- −$5,596
- − Property taxes
- −$2,151
- − Insurance
- −$500
- − Repairs & maintenance
- −$1,205
- − Management
- −$1,205
- − Depreciation
- −$2,906
- Taxable income
- $1,498
- Est. tax owed @ 24.0%
- −$359
- After-tax cash flow
- $2,601/yr
For passive investors: Depreciation is non-cash, so a rental often shows a tax loss while cash-flowing — sheltering income. Rental losses are passive: they offset passive income freely, and up to $25,000/yr can offset ordinary (W-2) income if you actively participate and your MAGI is under $100k (phasing out to $0 by $150k); unused losses carry forward. On sale, claimed depreciation is recaptured at up to 25%, and gains may owe capital-gains tax (a 1031 exchange can defer both). Figures are a year-1 estimate at your 24.0% rate — not tax advice; consult a CPA.
Schools (NCES district)
- District
- South Lewis Central School District
- NCES district ID
- 3627360
- Math proficiency
- 43% ▼ -9.00%
- Reading proficiency
- 50% ▲ 3.00%
- Median HH income
- $44,641
- Composite
- 39.35/100
- National rank
- #3980
- State rank
- #450 of 590 in NY
Livability — Lyons Falls
- Score
- 57/100
- State rank
- #1075
- US rank
- #21579
Category grades
Schools grade is shown separately in the Schools card above.
Census & demographics
- Population (ZIP)
- 1,025
Population outlook (Lewis County) Hauer SSP2
- Today (2025)
- 26,126 people
- By 2030
- 25,354 · -3.0%
- By 2040
- 23,359 · -10.6%
- By 2050
- 20,927 · -19.9%
- By 2075
- 15,533 · -40.5%
- By 2100
- 10,215 · -60.9%
Race, ethnicity, and origin ACS 2023
- Neighborhood character
- Predominantly White (98%)
- Race & ethnicity
- White 98% Two or more races 2%
- Common ancestry
- Romanian 6% Lithuanian 4% Slovak 3%
- Languages at home
- 99% English-only · Spanish 1%
Political lean MEDSL · Lewis
- 2024 margin
- Solid R (+44.4) · D 27.8% · R 72.2%
- 2008→2024 swing
- -35.6pp toward R · 2008: -8.8pp · 2024: -44.4pp
- All cycles
- 2024: R+44.4 2020: R+39.2 2016: R+39.6 2012: R+8.7 2008: R+8.8
Not yet ingested
- Civics
- —
Market trends
- HPI YoY
- ▲ 0.20%
- Current HPI
- 394.7802
- Rent YoY
- —
- Metro
- —
- State GDP YoY
- ▲ 2.60%
- F500 in state
- 92
Industry mix (Fortune 500 HQ in NY)
| Industry | F500 HQs | Revenue |
|---|---|---|
| Financial Services | 10 | $950B |
|
||
| Consumer Goods | 9 | $162B |
|
||
| Insurance | 4 | $225B |
|
||
| Telecommunications | 2 | $144B |
|
||
| Pharmaceuticals | 2 | $112B |
|
||
| Media / Entertainment | 2 | $69B |
|
||
Price history
+48.0% since first listed4 events — show timeline
- 2026-03-16 Pending — CNYIS
- 2026-03-10 Listed $99,900 CNYIS
- 2012-09-28 Sold (MLS) $70,000 CNYIS
- 2012-06-12 Listed $67,500 CNYIS
Property tax history
+4.1%/yrLatest (2025): $2,151 · +6.0% YoY. Source: county tax records.
Cash-flow waterfall
monthlySold comps — $/sqft
last 12 mo · ≤1 miLoading sold comps…