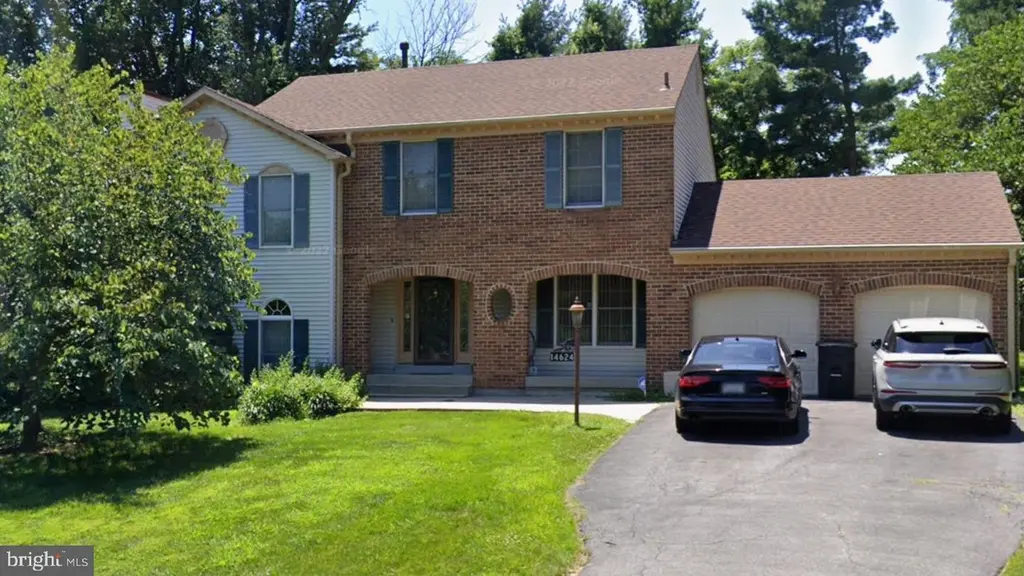
14624 Jaystone Dr · Cloverly, MD
Flood risk 1/10 · Minimal
- FEMA flood zone
- X (unshaded)
- Chance of flooding over 30 yrs
- 0.0%
- Est. flood insurance / yr
- $473 – $860
Fire risk 2/10 · Minimal
- Est. fire insurance / yr
- $755 – $1,403
Heat risk 6/10 · Moderate
- Hot days now (above 103°F)
- 7 days/yr
- Hot days in 30 yrs
- 15 days/yr
Wind risk 4/10 · Minor
- Chance of severe wind over 30 yrs
- 19.0%
Air-quality risk 4/10 · Minor
- Unhealthy air days now
- 4 days/yr
- Unhealthy air days in 30 yrs
- 5 days/yr
Risk factors via First Street. Map © Google.
Why this score? — see what drove the F grade
The composite is a weighted blend of 9 inputs, each scored 0–100. Each bar is that input's sub-score; the figure is the points it added to the 100-point composite (weight × sub-score).
- ARV discount +15.0/15.0
- Cash flow +6.6/30.0
- Schools +3.6/10.0
- Livability +3.2/5.0
- Rent growth +2.5/5.0
- Condition / age +2.5/5.0
- 1% rule +0.8/10.0
- DSCR +0.8/10.0
- Appreciation +0.0/10.0
$630,000
🖨 Deal sheet 📄 Offer letter ✓ Due diligence
Listing remarks
14624 Jaystone Drive, Silver Spring, MD - Rare Find Under $650K From the moment you pull up, the grand brick front exterior, oversized driveway, and commanding presence of this 4 level home immediately stand out. A spacious 4 level home in one of Silver Spring’s most desirable areas priced under $650K with room to add your own touches and build serious sweat equity over time. Buyers know opportunities like this in Montgomery County are becoming harder and harder to find. If you’ve been trying to break into a strong Silver Spring community without paying fully renovated prices, this is your moment. Why this location stands out: Minutes to Glenmont Metro Station Quick access to IC
Key facts
- Brick front exterior
- Grocery stores
- Shopping
Tags
Property features AI
Finance
- Other: Ownership is fee simple
- HOA & community: HOA fee of $350 annually
Exterior
- Parking: Attached front-entry garage with 2 garage spaces
- Utilities: Public water; Public sewer; Electric cooling; Natural gas for heating and hot water
- Home design: Detached property; Year built: assessed by county (source: Assessor)
- Construction: Brick construction; Brick/mortar foundation
- Exterior features: No tidal water on the lot; Above-grade and below-grade structures
Interior
- Kitchen: Eat-in kitchen (appliances not specified)
- Bedrooms: Four bedrooms on the main upper level; One bedroom on the lower level
- Flooring: Wood floors
- Bathrooms: Three full bathrooms; One half bathroom
- Heating & cooling: 90% efficient forced-air heating (natural gas); Central air conditioning (electric)
- Interior features: Eat-in kitchen; Master bathroom; Skylights; Wood floors; Built-in cabinetry; One wood-burning fireplace; Fully finished basement
- Laundry & utility: Hot water heated by natural gas
Neighborhood map
What this means for you Summary
Snapshot
- This is a 5-bed/2.5-bath single-family listed at $630k.
Deal economics
- At list price, monthly cash flow is $-1k ($-13k/yr) — negative.
- To cash-flow at today's rent, offer at most $446k (29.3% below list).
- To meet the 1% rule (rent ≥ 1% of price), the offer needs to be $363k (42.4% below list).
- Recommended offer: $363k (42.4% below list) — sets the bar for 1% rule.
- Cap rate 4.3% vs local median 2.8% in Cloverly — top-decile yield for the area; either an underpriced asset or a hidden risk that comps aren't pricing in. Stress-test before assuming the spread holds.
Location & tenants
- Location reads 64/100 on livability (#273 in MD) — a middle-class / working-renter tenant base. Strengths: employment A+, housing A+, crime A-; Watch: amenities F, commute F, cost of living F.
- Montgomery County Public Schools (suburban): math 27% / reading 45% proficiency, ranked #3 of 24 in MD (top 12%) — families likely to look elsewhere, expect single-tenant / working-renter base with shorter leases.
- Market conditions: 41 active listings in the ZIP; 5 comparable units currently listed for rent nearby; rentals lingering (median 44d on market — plan ~5-8 weeks vacancy on turnover, expect pricing pressure); 60% of comp listings sitting > 30 days — soft ceiling on asking rent; high-income renter base; 3,880 units permitted in Montgomery County in 2024 (2,054 in 5+ unit buildings).
Forward outlook
- Local home prices are declining (-3.0%/yr); year-one equity from $4k of loan paydown is wiped out by about $19k of value loss. Plan a longer hold.
- Montgomery County population projected at +27% by 2050 — long-run rental-demand tailwind backs the buy-and-hold thesis.
Negotiation context
- Only 4 days on market — expect competitive offers; lowballing is unlikely to land.
Risks & watch-outs
- Climate carrying-cost: extreme-heat days projected 7→15/yr by 2055 (HVAC capex compounding) — expect insurance premiums to compound above CPI over the hold.
Questions for the listing agent
- What do current leases actually rent for vs. the listed asking? Can we see a recent rent roll and the last 12 months of T-12 income?
- Is there a deadline driving the sale (1031 exchange, divorce, estate, relocation)? That informs how much negotiation room exists.
- The area grade is low — what's the realistic commute time and amenity access for the typical tenant pool here? Any planned neighborhood developments (good or bad) we should know about?
- What's the average days-on-market for RENTAL listings here right now (not sales)? A rising rental-DOM trend means longer vacancies and softer asking-rent achievability than the comps imply.
- What's the recent tenant-quality profile in this submarket — average credit score on applications, eviction rate, late-payment / NSF rate, and stable-employment percentage? A property-management company in the area should have these aggregated.
- How much new for-sale + rental construction is in the pipeline within 1–3 miles? Heavy new supply typically softens prices + rents 12–24 months out; constrained supply supports both.
Investment metrics
- 1% rule
- 0.58% ✗
- Cap rate
- 4.31%
- Cash-on-cash
- -7.10%
- DSCR
- 0.68
- GRM
- 14.5
CMA / ARV
- ARV (median comp)
- $886,368
- List price
- $630,000
- Delta
- -28.92%
- Verdict
- UNDERPRICED
- Comps
- 20 within 1.0 mi
Show comp detail 12 sales within ~0.75 mi
| Address | Dist | Beds/Ba | Sqft | Sold | Price | $/sf | Match |
|---|---|---|---|---|---|---|---|
| 14816 Stonegate Ter | 0.53mi | 5/2.0 | 2,577 (-2%) | 1mo | $633,000 | $246 | 69 |
| 14820 Cobblestone Dr | 0.19mi | 4/2.5 (-1) | 2,868 (+9%) | 7mo | $650,000 | $227 | 66 |
| 14801 Flintstone Ln | 0.33mi | 5/3.0 | 2,868 (+9%) | 9mo | $635,000 | $221 | 60 |
| 14417 Jaystone Dr | 0.41mi | 5/3.0 | 2,837 (+8%) | 9mo | $680,000 | $240 | 58 |
| 15200 Winstead Ln | 0.58mi | 4/2.5 (-1) | 2,754 (+5%) | 3mo | $747,000 | $271 | 58 |
| 15108 Centergate Dr | 0.56mi | 5/3.0 | 2,904 (+10%) | 1mo | $789,000 | $272 | 54 |
| 15108 Watergate Rd | 0.60mi | 4/2.5 (-1) | 2,775 (+5%) | 8mo | $716,000 | $258 | 51 |
| 15213 Redgate Dr | 0.47mi | 5/3.5 | 2,917 (+11%) | 10mo | $750,000 | $257 | 48 |
| 14513 Notley Rd | 0.64mi | 4/2.5 (-1) | 2,382 (-10%) | 3mo | $685,000 | $288 | 46 |
| 14604 Notley Rd | 0.54mi | 4/3.0 (-1) | 2,277 (-14%) | 0mo | $670,000 | $294 | 45 |
| 15012 Redgate Dr | 0.48mi | 4/3.5 (-1) | 3,016 (+14%) | 2mo | $735,000 | $244 | 43 |
| 15205 Rockport Dr | 0.51mi | 4/2.5 (-1) | 3,002 (+14%) | 7mo | $802,000 | $267 | 42 |
Match score weights: distance 35% · size 25% · config 20% · recency 20%. Top-matched comps best support the ARV.
Projected returns pro-forma
-3.0% appreciation · 3.0% rent growth · sell at horizon
- IRR
- -28.7%
- Equity multiple
- 0.04×
- Total profit
- $-168,775
- Equity at exit
- $93,935
- IRR
- -28.6%
- Equity multiple
- -0.32×
- Total profit
- $-233,443
- Equity at exit
- $54,471
Cash invested: $176,400 (down + closing). Projections, not guarantees.
Landlord ↔ Tenant lean methodology
- Overall (STATE)
- 27 Tenant-Leaning
- State Maryland
- 27 Tenant-Leaning · D+14
- County
- — inherits STATE
- City
- — inherits STATE
ZIP-level market 20905
- Active inventory
- 41
- Price-to-rent
- 14.5×
Monthly cashflow live
- Estimated rent
- $3,628 high interval (Pro) →
- Mortgage (P&I)
- −$3,304
- Tax from tax record
- −$343 /mo · $4,118/yr
- Insurance
- −$262
- HOA
- −$0
- Vacancy / Maint / Mgmt
- −$762
- Net cashflow
- $-1,044
Break-even live
UW: 25.0% down · 7.5% · 30yr · 1.5% tax · 5.0% vac · 8.0% maint · 8.0% mgmt
Financing live
Cash to close
- Down payment
- $157,500
- Closing costs
- $18,900
- Reserves months
- —
- Total cash needed
- —
Loan-product check · same deal, 3 products live
Conventional
25% down · 7.5% · 30yr
- Down + closing
- —
- Monthly P&I
- —
- Monthly cashflow
- —
- DSCR
- —
- Eligible?
- —
Personal DTI + credit; lowest rate.
DSCR
20% down · 8.5% · 30yr
- Down + closing
- —
- Monthly P&I
- —
- Monthly cashflow
- —
- DSCR
- —
- Eligible?
- —
No personal income docs; deal must DSCR.
Hard money
10% down · 12.0% · 12mo
- Down + closing
- —
- Monthly P&I
- —
- Monthly cashflow
- —
- DSCR
- —
- Eligible?
- —
Short-term bridge; refi at stabilization.
Rent comps 5 comps
| Address | Beds | Baths | Sqft | Rent | $/sqft | DOM | Units | Dist |
|---|---|---|---|---|---|---|---|---|
| 14216 Catamount Ct Silver Spring, MD | 4.0 | 3.5 | 2376 | $3,300 | $1.39 | 3d | 1 | 1.23mi |
| 13904 Mills Ave Silver Spring, MD | 5.0 | 2.0 | 2205 | $3,480 | $1.58 | 43d | 1 | 1.29mi |
| 14004 Zeigler Way Silver Spring, MD | 4.0 | 3.0 | 2114 | $1,850 | $0.88 | 43d | 1 | 1.46mi |
| 1700 Chester Mill Rd Silver Spring, MD | 5.0 | 3.5 | 2758 | $4,500 | $1.63 | 43d | 1 | 1.46mi |
| 15715 Tierra Dr Silver Spring, MD | 5.0 | 3.0 | 2500 | $4,000 | $1.60 | 24d | 1 | 1.48mi |
Listing history 3 events
-
2026-05-18historical
-
2026-05-14$630,000 Active
-
1987-09-16soldstatus $220,605
ⓘ Source: listings_history table (triggers on properties + properties_extension) + one-shot
backfill from property_details.listing_events for pre-trigger history.
Tax reassessment forecast MD · Partial reset (capped growth)
- Current annual tax
- $4,118 · $343/mo
- Projected year-2 tax
- $5,492 · $458/mo
- Expected delta
- +$1,375/yr (+$115/mo · 33.4%)
ⓘ Screening estimate from a state-policy table — verify with the county assessor before closing.
Climate risk First Street
- Flood 1/10 Low FEMA zone X (unshaded) · 0% chance over 30 yrs
- Wildfire 2/10 Low
- Heat 6/10 Major 7 d/yr ≥103°F today · 15 d/yr by 30 yrs out
- Wind 4/10 Moderate 19% chance of damaging wind over 30 yrs
- Air quality 4/10 Moderate 4 unhealthy d/yr today · 5 by 30 yrs out
Nearby sold comps map
Loading sold comps map…
Walkable amenities ~0.75 mi
Loading nearby amenities…
Taxation est. · year 1
- Rental income
- $43,531
- − Mortgage interest
- −$35,290
- − Property taxes
- −$4,118
- − Insurance
- −$3,150
- − Repairs & maintenance
- −$3,482
- − Management
- −$3,482
- − Depreciation
- −$18,327
- Taxable loss
- −$24,319
- Est. tax savings @ 24.0%
- +$5,836
- After-tax cash flow
- $-6,687/yr
For passive investors: Depreciation is non-cash, so a rental often shows a tax loss while cash-flowing — sheltering income. Rental losses are passive: they offset passive income freely, and up to $25,000/yr can offset ordinary (W-2) income if you actively participate and your MAGI is under $100k (phasing out to $0 by $150k); unused losses carry forward. On sale, claimed depreciation is recaptured at up to 25%, and gains may owe capital-gains tax (a 1031 exchange can defer both). Figures are a year-1 estimate at your 24.0% rate — not tax advice; consult a CPA.
Schools (NCES district)
- District
- Montgomery County Public Schools
- NCES district ID
- 2400480
- Math proficiency
- 27% ▼ -21.00%
- Reading proficiency
- 45% ▼ -10.00%
- Median HH income
- $97,191
- Composite
- 35.62/100
- National rank
- #4889
- State rank
- #3 of 24 in MD
Livability — Cloverly
- Score
- 64/100
- State rank
- #273
- US rank
- #13827
Category grades
Schools grade is shown separately in the Schools card above.
Census & demographics
- Census place
- Cloverly, MD
- County
- Montgomery County · 961,106 people
- Metro
- Washington-Arlington-Alexandria, DC-VA-MD-WV
- Population (ZIP)
- 19,004
- Household income
- $159,740
- Rent vs Own
- Severe rent burden
- 241.0
Population outlook (Montgomery County) Hauer SSP2
- Today (2025)
- 1,173,231 people
- By 2030
- 1,237,402 · +5.5%
- By 2040
- 1,365,115 · +16.4%
- By 2050
- 1,491,592 · +27.1%
- By 2075
- 1,803,893 · +53.8%
- By 2100
- 2,035,619 · +73.5%
Race, ethnicity, and origin ACS 2023
- Neighborhood character
- Highly diverse neighborhood (Simpson 0.76)
- Race & ethnicity
- White 35% Black 25% Hispanic / Latino 17% Asian 15% Two or more races 11%
- Hispanic origin (detail)
- Puerto Rican 1%
- Common ancestry
- Romanian 3% Scotch-Irish 2% Lithuanian 2%
- Foreign-born
- 31% · Canada, Vietnam, China
- Languages at home
- 60% English-only · Spanish 13% Other Indo-European 7% Russian/Polish/Slavic 3%
Political lean MEDSL · Montgomery
- 2024 margin
- Solid D (+53.3) · D 75.2% · R 21.9% · Other 2.9%
- 2008→2024 swing
- +8.7pp toward D · 2008: 44.6pp · 2024: 53.3pp
- All cycles
- 2024: D+53.3 2020: D+59.6 2016: D+55.5 2012: D+43.4 2008: D+44.6
Not yet ingested
- Civics
- —
Market trends
- HPI YoY
- ▼ -342.94%
- Current HPI
- 243.4758
- Rent YoY
- —
- Metro
- Washington-Arlington-Alexandria, DC-VA-MD-WV
- State GDP YoY
- ▲ 2.97%
- F500 in state
- 12
Industry mix (Fortune 500 HQ in MD)
| Industry | F500 HQs | Revenue |
|---|---|---|
| Aerospace / Defense | 1 | $71B |
|
||
| Utilities | 1 | $25B |
|
||
| Hotels | 1 | $24B |
|
||
| Consumer Goods | 1 | $7B |
|
||
| Real Estate | 1 | $6B |
|
||
| Chemicals | 1 | $2B |
|
||
Price history
+219.6% since first listed5 events — show timeline
- 2026-06-08 Sold (MLS) $705,000 BRIGHT MLS
- 2026-05-22 Pending — BRIGHT MLS
- 2026-05-18 Listing Removed — BRIGHT MLS
- 2026-05-14 Listed $630,000 BRIGHT MLS
- 1987-09-16 Sold (Public Records) $220,605 Public Records
Property tax history
+0.0%/yrLatest (2025): $4,118 · +20.6% YoY. Source: county tax records.
Cash-flow waterfall
monthlySold comps — $/sqft
last 12 mo · ≤1 miLoading sold comps…