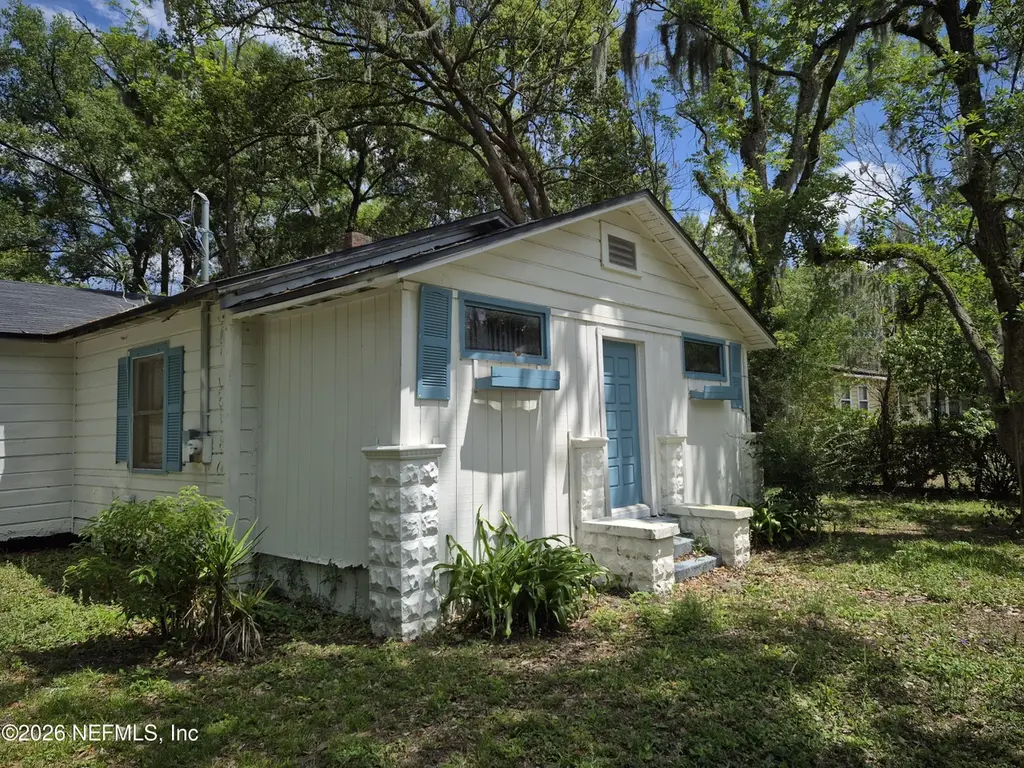
9147 Gibson Ave · Jacksonville, FL
Flood risk 1/10 · Minimal
- FEMA flood zone
- X (unshaded)
- Chance of flooding over 30 yrs
- 0.0%
- Est. flood insurance / yr
- $507 – $1,088
Fire risk 3/10 · Minor
- Est. fire insurance / yr
- $947 – $1,759
Heat risk 9/10 · Severe
- Hot days now (above 107°F)
- 7 days/yr
- Hot days in 30 yrs
- 18 days/yr
Wind risk 9/10 · Severe
- Chance of severe wind over 30 yrs
- 99.0%
Air-quality risk 4/10 · Minor
- Unhealthy air days now
- 6 days/yr
- Unhealthy air days in 30 yrs
- 6 days/yr
Risk factors via First Street. Map © Google.
Why this score? — see what drove the B grade
The composite is a weighted blend of 9 inputs, each scored 0–100. Each bar is that input's sub-score; the figure is the points it added to the 100-point composite (weight × sub-score).
- Cash flow +26.6/30.0
- ARV discount +15.0/15.0
- DSCR +9.1/10.0
- 1% rule +7.2/10.0
- Livability +4.2/5.0
- Schools +3.9/10.0
- Condition / age +2.5/5.0
- Rent growth +2.2/5.0
- Appreciation +0.0/10.0
$119,900
🖨 Deal sheet 📄 Offer letter ✓ Due diligence
Listing remarks
INVESTOR SPECIAL!!! This is a solid Fixer Upper with a New Roof. Metal Shed 12x12 remains. No value in wooden garage. Home has lap siding with T111 on enclosed front porch, original winows and off-grade. Home is on Well and Septic, but City water hook-up is available. Large Eat-in Kitchen has Laundry Nook inside. There is a paved driveway. Home has great possibilities for a Full Rehab! DO NOT MAKE OFFER WITHOUT VIEWING PROPERTY. CASH ONLY.
Key facts
- Metal shed
- Lap siding
- Paved driveway
Tags
Property features AI
Finance
- HOA & community: Not a senior community
Exterior
- Parking: Off-street parking
- Utilities: Septic tank; Cable available; Electricity connected
- Home design: Single family residence; One story; Entry level is 1; Faces west
- Construction: Wood siding; Shingle roof
- Exterior features: Many trees on the lot; City street frontage; Asphalt road surface
Interior
- Kitchen: Electric oven
- Bedrooms: 3 bedrooms (entry level: 1)
- Flooring: Vinyl flooring; Wood flooring
- Bathrooms: 1 full bathroom
- Heating & cooling: Central heating (electric); Central air conditioning (electric)
- Interior features: Eat-in kitchen; Primary bathroom with shower (no tub); Split bedroom layout
- Laundry & utility: In-unit laundry with washer hookup and electric dryer hookup
Neighborhood map
What this means for you Summary
Snapshot
- This is a 3-bed/1.0-bath single-family listed at $120k.
Deal economics
- At list price, monthly cash flow is $322 ($4k/yr) — positive.
- The deal already cash-flows at list — no discount required.
- Meets the 1% rule at list price ($1k rent vs $120k).
- Recommended offer: $116k (3.0% below list) — sets the bar for market timing.
- Cap rate 9.5% vs local median 4.0% in Jacksonville — top-decile yield for the area; either an underpriced asset or a hidden risk that comps aren't pricing in. Stress-test before assuming the spread holds.
Location & tenants
- Location reads 83/100 on livability (#50 in FL, #911 nationally) — a professional / high-income tenant draw. Strengths: amenities A+, commute A+, housing A+.
- Duval (urban): math 46% / reading 45% proficiency, ranked #48 of 73 in FL (top 66%) — families likely to look elsewhere, expect single-tenant / working-renter base with shorter leases.
- Market conditions: Rents soft (-1.4%/yr); 291 active listings in the ZIP; 38 comparable units currently listed for rent nearby; rentals at typical pace (median 21d on market — plan ~3-4 weeks tenant-placement turnaround); lower-income renter base — watch delinquency; 6,503 units permitted in Duval County in 2024 (1,131 in 5+ unit buildings).
- This rent runs 43% of the median local income ($41k/yr) — at the standard rent-burdened threshold; future hikes will face affordability resistance.
Forward outlook
- Local home prices are declining (-3.0%/yr); year-one equity from $829 of loan paydown is wiped out by about $4k of value loss. Plan a longer hold.
- Duval County population projected at +19% by 2050 — long-run rental-demand tailwind backs the buy-and-hold thesis.
Negotiation context
- It's been on market 42 days — a 3% lower offer ($116k) is reasonable based on typical stale-listing flexibility.
- Current owner paid $19k; list at $120k implies a 534% gain — meaningful room to come down on a strong offer.
Risks & watch-outs
- Watch-outs: built in 1940 — expect roof / HVAC / electrical / plumbing capex.
- Climate carrying-cost: severe wind risk, 99% chance of damaging wind over 30y; extreme-heat days projected 7→18/yr by 2055 (HVAC capex compounding) — expect insurance premiums to compound above CPI over the hold.
Questions for the listing agent
- It's been on market 42 days. Have you received any prior offers? Is the seller open to a 3% concession, seller financing, or rate buy-down credit?
- Built in 1940 — when were the roof, HVAC, electrical panel, plumbing, and water heater last replaced?
- Is there a deadline driving the sale (1031 exchange, divorce, estate, relocation)? That informs how much negotiation room exists.
- Schools are B-rated — typically a magnet for longer-tenancy family renters. What's the average tenant stay here, and is there a school-zone premium baked into asking?
- What's the average days-on-market for RENTAL listings here right now (not sales)? A rising rental-DOM trend means longer vacancies and softer asking-rent achievability than the comps imply.
- What's the recent tenant-quality profile in this submarket — average credit score on applications, eviction rate, late-payment / NSF rate, and stable-employment percentage? A property-management company in the area should have these aggregated.
- How much new for-sale + rental construction is in the pipeline within 1–3 miles? Heavy new supply typically softens prices + rents 12–24 months out; constrained supply supports both.
Investment metrics
- 1% rule
- 1.22% ✓
- Cap rate
- 9.51%
- Cash-on-cash
- 11.49%
- DSCR
- 1.51
- GRM
- 6.8
CMA / ARV
- ARV (on-the-fly)
- $171,456
- Comps found
- 12
Show comp detail 12 sales within ~0.75 mi
| Address | Dist | Beds/Ba | Sqft | Sold | Price | $/sf | Match |
|---|---|---|---|---|---|---|---|
| 9129 Tamworth Rd | 0.18mi | 2/1.0 (-1) | 1,192 (-2%) | 0mo | $77,500 | $65 | 83 |
| 4368 Bedivere Rd | 0.43mi | 3/2.0 | 1,274 (+5%) | 2mo | $162,500 | $128 | 66 |
| 9264 Norfolk Blvd | 0.55mi | 3/1.0 | 1,255 (+3%) | 4mo | $134,000 | $107 | 66 |
| 9724 Waynesboro Ave | 0.61mi | 3/2.0 | 1,196 (-2%) | 3mo | $170,000 | $142 | 62 |
| 9621 Ronnie St | 0.49mi | 4/2.0 (+1) | 1,163 (-4%) | 2mo | $210,000 | $181 | 60 |
| 4419 Crossbow Rd | 0.57mi | 3/2.0 | 1,274 (+5%) | 5mo | $179,000 | $141 | 57 |
| 8603 Nassau Rd | 0.60mi | 3/1.0 | 1,115 (-8%) | 2mo | $135,000 | $121 | 57 |
| 4400 Bedivere Rd | 0.44mi | 3/2.0 | 1,308 (+8%) | 7mo | $220,000 | $168 | 57 |
| 3360 Lansdell Dr | 0.58mi | 3/2.0 | 1,124 (-8%) | 3mo | $215,000 | $191 | 54 |
| 4824 Portsmouth Ave | 0.65mi | 4/2.0 (+1) | 1,248 (+3%) | 6mo | $125,000 | $100 | 52 |
| 4903 Fredericksburg Ave | 0.69mi | 3/1.0 | 1,312 (+8%) | 8mo | $108,600 | $83 | 49 |
| 3430 Hickorynut St | 0.60mi | 4/2.0 (+1) | 1,368 (+12%) | 1mo | $224,900 | $164 | 41 |
Match score weights: distance 35% · size 25% · config 20% · recency 20%. Top-matched comps best support the ARV.
Projected returns pro-forma
-3.0% appreciation · 0.0% rent growth · sell at horizon
- IRR
- -2.6%
- Equity multiple
- 0.90×
- Total profit
- $-3,221
- Equity at exit
- $17,877
- IRR
- 3.4%
- Equity multiple
- 1.21×
- Total profit
- $7,060
- Equity at exit
- $10,367
Cash invested: $33,572 (down + closing). Projections, not guarantees.
Landlord ↔ Tenant lean methodology
- Overall (STATE)
- 87 Strongly Landlord-Friendly
- State Florida
- 87 Strongly Landlord-Friendly · R+3
- County
- — inherits STATE
- City
- — inherits STATE
ZIP-level market 32208
- Home prices YoY
- -33.6%
- Rents YoY
- -1.4%
- Active inventory
- 291
- Price-to-rent
- 6.8×
Monthly cashflow live
- Estimated rent
- $1,468 high interval (Pro) →
- Mortgage (P&I)
- −$629
- Tax from tax record
- −$159 /mo · $1,909/yr
- Insurance
- −$50
- HOA
- −$0
- Vacancy / Maint / Mgmt
- −$308
- Net cashflow
- $322
Break-even live
UW: 25.0% down · 7.5% · 30yr · 1.5% tax · 5.0% vac · 8.0% maint · 8.0% mgmt
Financing live
Cash to close
- Down payment
- $29,975
- Closing costs
- $3,597
- Reserves months
- —
- Total cash needed
- —
Loan-product check · same deal, 3 products live
Conventional
25% down · 7.5% · 30yr
- Down + closing
- —
- Monthly P&I
- —
- Monthly cashflow
- —
- DSCR
- —
- Eligible?
- —
Personal DTI + credit; lowest rate.
DSCR
20% down · 8.5% · 30yr
- Down + closing
- —
- Monthly P&I
- —
- Monthly cashflow
- —
- DSCR
- —
- Eligible?
- —
No personal income docs; deal must DSCR.
Hard money
10% down · 12.0% · 12mo
- Down + closing
- —
- Monthly P&I
- —
- Monthly cashflow
- —
- DSCR
- —
- Eligible?
- —
Short-term bridge; refi at stabilization.
Rent comps 38 comps
| Address | Beds | Baths | Sqft | Rent | $/sqft | DOM | Units | Dist |
|---|---|---|---|---|---|---|---|---|
| 3848 Soutel Dr Jacksonville, FL | 3.0 | 2.0 | 1230 | $1,541 | $1.25 | 7d | 1 | 0.32mi |
| 9658 Gibson Ave Jacksonville, FL | 3.0 | 1.5 | 977 | $1,225 | $1.25 | 23d | 1 | 0.38mi |
| 4643 Williamsburg Ave Jacksonville, FL | 3.0 | 2.0 | 1209 | $1,496 | $1.24 | 3d | 1 | 0.41mi |
| 4662 Roanoke Blvd Jacksonville, FL | 3.0 | 2.0 | 1104 | $1,195 | $1.08 | 14d | 1 | 0.51mi |
| 9348 Culpeper Ave Jacksonville, FL | 3.0 | 1.0 | 882 | $1,195 | $1.35 | 23d | 1 | 0.52mi |
| 4737 Portsmouth Ave Jacksonville, FL | 4.0 | 2.0 | 1396 | $1,148 | $0.82 | 23d | 1 | 0.60mi |
| 3344 Soutel Dr Jacksonville, FL | 3.0 | 1.0 | 1142 | $1,325 | $1.16 | 23d | 1 | 0.63mi |
| 8516 Bermuda Rd Jacksonville, FL | 3.0 | 2.0 | 1492 | $1,625 | $1.09 | 20d | 1 | 0.68mi |
| 9561 Norfolk Blvd Jacksonville, FL | 3.0 | 1.5 | 934 | $1,350 | $1.45 | 1d | 1 | 0.70mi |
| 8534 Addison Rd Jacksonville, FL | 4.0 | 2.0 | 1410 | $1,995 | $1.41 | 23d | 1 | 0.75mi |
| 8509 Addison Rd Jacksonville, FL | 4.0 | 2.0 | 1494 | $1,675 | $1.12 | 23d | 1 | 0.76mi |
| 3250 Soutel Dr Jacksonville, FL | 3.0 | 2.0 | 1352 | $1,525 | $1.13 | 23d | 1 | 0.77mi |
| 4935 Portsmouth Ave Jacksonville, FL | 3.0 | 1.0 | 894 | $1,163 | $1.30 | 10d | 1 | 0.78mi |
| 4895 Churchill Dr Jacksonville, FL | 3.0 | 2.0 | 1303 | $1,900 | $1.46 | 23d | 1 | 0.84mi |
| 4819 Arrowsmith Rd Unit 1 Jacksonville, FL | 3.0 | 2.0 | 1285 | $1,500 | $1.17 | 14d | 1 | 0.85mi |
| 8645 Samona Dr W Jacksonville, FL | 4.0 | 1.0 | 1196 | $1,250 | $1.05 | 23d | 1 | 0.88mi |
| 3015 Lansdell Dr Jacksonville, FL | 3.0 | 1.0 | 1150 | $1,350 | $1.17 | 23d | 1 | 0.91mi |
| 9436 Gisborne Dr Jacksonville, FL | 3.0 | 1.5 | 950 | $1,440 | $1.52 | 20d | 1 | 0.92mi |
| 2389 Hilly Rd Jacksonville, FL | 3.0 | 1.0 | 908 | $1,650 | $1.82 | 23d | 1 | 1.00mi |
| 9148 13th Ave Jacksonville, FL | 3.0 | 1.0 | 1126 | $1,136 | $1.01 | 4d | 1 | 1.01mi |
| 9346 10th Ave Jacksonville, FL | 3.0 | 1.0 | 985 | $1,825 | $1.85 | 23d | 1 | 1.02mi |
| 9206 Greenleaf Rd Jacksonville, FL | 3.0 | 1.5 | 888 | $1,400 | $1.58 | 17d | 1 | 1.05mi |
| 9141 12th Ave Jacksonville, FL | 3.0 | 2.0 | 1209 | $1,598 | $1.32 | 20d | 1 | 1.08mi |
| 4440 Ken Knight Dr N Jacksonville, FL | 2.0 | 1.0 | 716 | $650 | $0.91 | 14d | 1 | 1.09mi |
| 9340 Sibbald Rd Jacksonville, FL | 4.0 | 2.0 | 1228 | $1,606 | $1.31 | 4d | 1 | 1.12mi |
| 8367 Tubman Ct Jacksonville, FL | 4.0 | 1.5 | 1398 | $1,790 | $1.28 | 17d | 1 | 1.24mi |
| 9279 6th Ave Jacksonville, FL | 3.0 | 2.0 | 1150 | $1,245 | $1.08 | 4d | 1 | 1.25mi |
| 4177 Lorenzo Ct Unit 4 Jacksonville, FL | 2.0 | 1.0 | 840 | $945 | $1.12 | 1d | 1 | 1.26mi |
| 4543 Moncrief Rd W Jacksonville, FL | 2.0 | 1.0 | 950 | $1,075 | $1.13 | 7d | 1 | 1.27mi |
| 9032 8th Ave Jacksonville, FL | 3.0 | 2.0 | 1300 | $1,500 | $1.15 | 23d | 1 | 1.29mi |
| 9050 7th Ave Jacksonville, FL | 3.0 | 1.0 | 896 | $1,485 | $1.66 | 23d | 1 | 1.31mi |
| 4253 Moncrief Rd W Unit 2 Jacksonville, FL | 2.0 | 1.0 | 840 | $975 | $1.16 | 23d | 1 | 1.32mi |
| 4211 Moncrief Rd W Unit 2 Jacksonville, FL | 2.0 | 1.0 | 840 | $995 | $1.18 | 23d | 1 | 1.36mi |
| 3997 Leonnie Rd Unit 1 Jacksonville, FL | 2.0 | 1.0 | 840 | $950 | $1.13 | 7d | 1 | 1.37mi |
| 9037 6th Ave Jacksonville, FL | 3.0 | 2.0 | 1156 | $1,400 | $1.21 | 23d | 1 | 1.37mi |
| 9131 4th Ave Jacksonville, FL | 3.0 | 2.0 | 1209 | $1,496 | $1.24 | 21d | 1 | 1.40mi |
| 9017 6th Ave Jacksonville, FL | 2.0 | 1.0 | 1038 | $1,098 | $1.06 | 23d | 1 | 1.40mi |
| 4236 Homer Rd N Jacksonville, FL | 3.0 | 1.0 | 888 | $1,250 | $1.41 | 11d | 1 | 1.48mi |
Listing history 15 events
-
2026-06-18days on market $119,900 Active 42 DOM
-
2026-06-17days on market $119,900 Active 41 DOM
-
2026-06-16days on market $119,900 Active 40 DOM
-
2026-06-15days on market $119,900 Active 39 DOM
-
2026-06-13days on market $119,900 Active 36 DOM
-
2026-06-10days on market $119,900 Active 33 DOM
-
2026-06-08days on market $119,900 Active 32 DOM
-
2026-06-07days on market $119,900 Active 31 DOM
-
2026-06-05days on market $119,900 Active 28 DOM
-
2026-06-03days on market $119,900 Active 27 DOM
-
2026-06-02days on market $119,900 Active 26 DOM
-
2026-06-01days on market $119,900 Active 25 DOM
-
2026-05-31days on market $119,900 Active 24 DOM
-
2026-05-07$119,900 Active
-
1977-10-06soldstatus $18,900
ⓘ Source: listings_history table (triggers on properties + properties_extension) + one-shot
backfill from property_details.listing_events for pre-trigger history.
Tax reassessment forecast FL · Resets to sale price
- Current annual tax
- $1,909 · $159/mo
- Projected year-2 tax
- $1,909 · $159/mo
- Expected delta
- $0/yr ($0/mo · 0.0%)
ⓘ Screening estimate from a state-policy table — verify with the county assessor before closing.
Climate risk First Street
- Flood 1/10 Low FEMA zone X (unshaded) · 0% chance over 30 yrs
- Wildfire 3/10 Moderate
- Heat 9/10 Extreme 7 d/yr ≥107°F today · 18 d/yr by 30 yrs out
- Wind 9/10 Extreme 99% chance of damaging wind over 30 yrs
- Air quality 4/10 Moderate 6 unhealthy d/yr today · 6 by 30 yrs out
Nearby sold comps map
Loading sold comps map…
Walkable amenities ~0.75 mi
Loading nearby amenities…
Taxation est. · year 1
- Rental income
- $17,611
- − Mortgage interest
- −$6,716
- − Property taxes
- −$1,909
- − Insurance
- −$600
- − Repairs & maintenance
- −$1,409
- − Management
- −$1,409
- − Depreciation
- −$3,488
- Taxable income
- $2,080
- Est. tax owed @ 24.0%
- −$499
- After-tax cash flow
- $3,360/yr
For passive investors: Depreciation is non-cash, so a rental often shows a tax loss while cash-flowing — sheltering income. Rental losses are passive: they offset passive income freely, and up to $25,000/yr can offset ordinary (W-2) income if you actively participate and your MAGI is under $100k (phasing out to $0 by $150k); unused losses carry forward. On sale, claimed depreciation is recaptured at up to 25%, and gains may owe capital-gains tax (a 1031 exchange can defer both). Figures are a year-1 estimate at your 24.0% rate — not tax advice; consult a CPA.
Schools (NCES district)
- District
- Duval
- NCES district ID
- 1200480
- Math proficiency
- 46% ▼ -11.00%
- Reading proficiency
- 45% ▼ -4.00%
- Median HH income
- $48,987
- Composite
- 38.97/100
- National rank
- #4076
- State rank
- #48 of 73 in FL
Livability — Jacksonville
- Score
- 83/100
- State rank
- #50
- US rank
- #911
Category grades
Schools grade is shown separately in the Schools card above.
Census & demographics
- Census place
- Jacksonville, FL
- County
- Duval County · 1,015,274 people
- City population
- 979,034
- Metro
- Jacksonville, FL
- Population (ZIP)
- 32,699
- Household income
- $41,324
- Rent vs Own
- Severe rent burden
- 1765.0
Population outlook (Duval County) Hauer SSP2
- Today (2025)
- 1,013,010 people
- By 2030
- 1,059,228 · +4.6%
- By 2040
- 1,141,439 · +12.7%
- By 2050
- 1,205,258 · +19.0%
- By 2075
- 1,324,282 · +30.7%
- By 2100
- 1,319,620 · +30.3%
Race, ethnicity, and origin ACS 2023
- Neighborhood character
- Predominantly Black (77%)
- Race & ethnicity
- Black 77% White 16% Two or more races 4% Hispanic / Latino 3%
- Common ancestry
- Italian 1%
- Foreign-born
- 2% · Canada
- Languages at home
- 97% English-only · Spanish 2%
Political lean MEDSL · Duval
- 2024 margin
- Toss-up / Even · D 48.7% · R 50.1% · Other 1.2%
- 2008→2024 swing
- +0.4pp no change · 2008: -1.9pp · 2024: -1.5pp
- All cycles
- 2024: R+1.5 2020: D+3.8 2016: R+1.5 2012: R+3.6 2008: R+1.9
Not yet ingested
- Civics
- —
Market trends
- HPI YoY
- ▼ -110.56%
- Current HPI
- 217.9706
- Rent YoY
- ▼ -1.36%
- Metro
- Jacksonville, FL
- State GDP YoY
- ▲ 3.28%
- F500 in state
- 36
Industry mix (Fortune 500 HQ in FL)
| Industry | F500 HQs | Revenue |
|---|---|---|
| Industrial Technology | 2 | $29B |
|
||
| Insurance | 2 | $17B |
|
||
| Retail | 1 | $60B |
|
||
| Technology Distribution | 1 | $58B |
|
||
| Homebuilding | 1 | $35B |
|
||
| Technology Manufacturing | 1 | $35B |
|
||
Price history
+534.4% since first listed2 events — show timeline
- 2026-05-07 Listed $119,900 realMLS
- 1977-10-06 Sold (Public Records) $18,900 Public Records
Property tax history
+5.8%/yrLatest (2025): $1,909 · +19.6% YoY. Source: county tax records.
Cash-flow waterfall
monthlySold comps — $/sqft
last 12 mo · ≤1 miLoading sold comps…