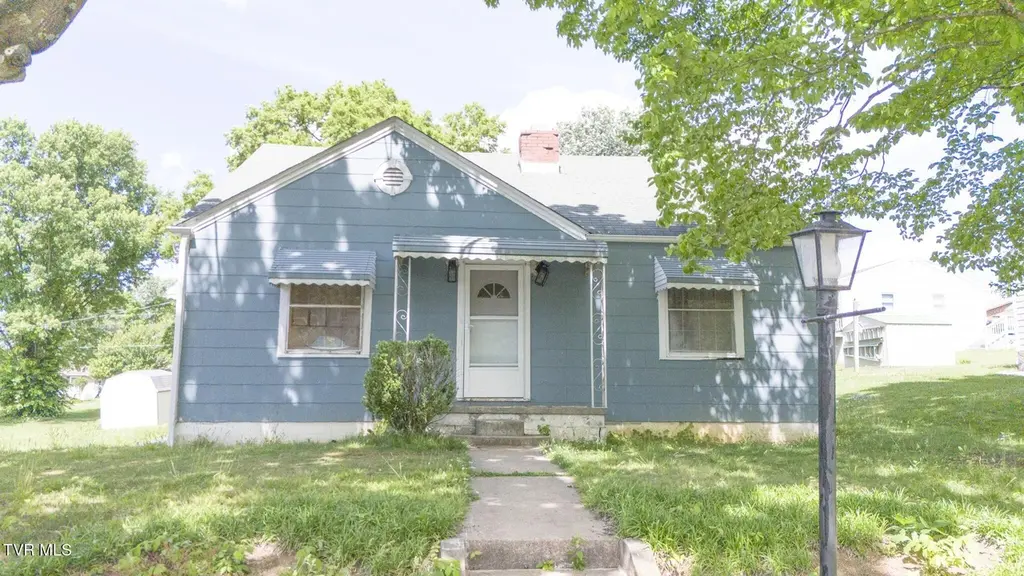
113 Ell St · Greeneville, TN
Flood risk 1/10 · Minimal
- FEMA flood zone
- X (unshaded)
- Chance of flooding over 30 yrs
- 0.0%
- Est. flood insurance / yr
- $473 – $860
Fire risk 3/10 · Minor
- Est. fire insurance / yr
- $949 – $1,763
Heat risk 4/10 · Minor
- Hot days now (above 101°F)
- 7 days/yr
- Hot days in 30 yrs
- 20 days/yr
Wind risk 2/10 · Minimal
- Chance of severe wind over 30 yrs
- —
Air-quality risk 3/10 · Minor
- Unhealthy air days now
- 2 days/yr
- Unhealthy air days in 30 yrs
- 3 days/yr
Risk factors via First Street. Map © Google.
Why this score? — see what drove the D grade
The composite is a weighted blend of 9 inputs, each scored 0–100. Each bar is that input's sub-score; the figure is the points it added to the 100-point composite (weight × sub-score).
- Cash flow +15.7/30.0
- ARV discount +7.5/15.0
- DSCR +4.8/10.0
- 1% rule +3.5/10.0
- Livability +3.3/5.0
- Schools +2.7/10.0
- Rent growth +2.5/5.0
- Condition / age +2.5/5.0
- Appreciation +0.0/10.0
$159,000
🖨 Deal sheet (PDF) 📄 Offer letter ✓ Due diligence
Listing remarks MLS
BACK ON THE MARKET, BUYERS FINANCING FELL THROUGH! Adorable cape cod in the city with 4 bedrooms, two baths, large back yard and unfinished basement! This home has the original hardwood floors and other features you will love! The main level consists of a large living room, two full baths, two bedrooms, dining and kitchen. Upstairs are two smaller bedrooms or office and playroom. The unfinished basement offers one car garage and storage space for plenty other items. Roof and heat pump less than ten years old and new main water line to the home.
Key facts
- 0.29 acre lot
- Built 1950
- Listed 8 days
Property features AI
Exterior
- Parking: Driveway
- Utilities: Public water; Public sewer
- Home design: Single family residence; Residential house; Property listed as fixer; Topography: part wooded, sloped; Subdivision: Davenport; Facing/directions: From Andrew Johnson Hwy in Greeneville, take N Main St then left to Hwy 107, left on Ell St, house on left.
- Construction: Wood siding; Block foundation; Shingle roof; House structure
- Exterior features: Back yard fencing; Shed(s)
Interior
- Kitchen: Range; Refrigerator
- Bedrooms: Total rooms: 9
- Flooring: Hardwood
- Bathrooms: 2 full bathrooms
- Heating & cooling: Heat pump; Window unit(s) for cooling
- Interior features: Eat-in kitchen; Unfinished basement
- Laundry & utility: Washer hookup; Electric dryer hookup
Neighborhood map
What this means for you Summary
Snapshot
- This is a 4-bed/2.5-bath single-family listed at $159k.
Deal economics
- At list price, monthly cash flow is $70 ($846/yr) — positive.
- The deal already cash-flows at list — no discount required.
- To meet the 1% rule (rent ≥ 1% of price), the offer needs to be $135k (15.1% below list).
- Recommended offer: $135k (15.1% below list) — sets the bar for 1% rule.
- Cap rate 6.8% vs local median 2.6% in Greeneville — top-decile yield for the area; either an underpriced asset or a hidden risk that comps aren't pricing in. Stress-test before assuming the spread holds.
Location & tenants
- Location reads 66/100 on livability (#125 in TN) — a middle-class / working-renter tenant base. Strengths: cost of living A+, housing A+, health & safety A+; Watch: amenities F, commute F, employment F.
- Greeneville (town): math 31% / reading 34% proficiency, ranked #45 of 139 in TN (top 32%) — families likely to look elsewhere, expect single-tenant / working-renter base with shorter leases.
- Zoned schools: C Hal Henard Elementary (math 27% / reading 37%, grade F, #369 of 952 statewide, top 42%, 437 students, 0% FRL); Greeneville Middle School (math 28% / reading 26%, grade F, #128 of 333 statewide, top 40%, 571 students, 0% FRL); Greeneville High School (math 42% / reading 55%, grade D, #13 of 332 statewide, top 4%, 958 students, 0% FRL) — zoned schools average 0% FRL vs 42% district-wide (42 pts lower); this property's tenant base skews higher-income than the district average.
- Market conditions: 253 active listings in the ZIP; 333 units permitted in Greene County in 2024 (72 in 5+ unit buildings).
Forward outlook
- Local home prices are declining (-3.0%/yr); year-one equity from $1k of loan paydown is wiped out by about $5k of value loss. Plan a longer hold.
- Greene County population projected to shrink 8% by 2050 — rents likely to lag national; underwrite the cash flow, not the appreciation.
Negotiation context
- Only 8 days on market — expect competitive offers; lowballing is unlikely to land.
- 2 sale attempts since 4y ago with the ask held roughly flat each time — persistent listings suggest the price (not the market) is what's stuck; bring a comps-based counter.
Risks & watch-outs
- Watch-outs: built in 1950 — expect roof / HVAC / electrical / plumbing capex.
Questions for the listing agent
- Built in 1950 — when were the roof, HVAC, electrical panel, plumbing, and water heater last replaced?
- Is there a deadline driving the sale (1031 exchange, divorce, estate, relocation)? That informs how much negotiation room exists.
- Schools are D-rated, which usually means shorter tenancies and higher turnover. Who's the typical renter profile here, and what's been the actual vacancy rate?
- The area grade is low — what's the realistic commute time and amenity access for the typical tenant pool here? Any planned neighborhood developments (good or bad) we should know about?
- What's the average days-on-market for RENTAL listings here right now (not sales)? A rising rental-DOM trend means longer vacancies and softer asking-rent achievability than the comps imply.
- What's the recent tenant-quality profile in this submarket — average credit score on applications, eviction rate, late-payment / NSF rate, and stable-employment percentage? A property-management company in the area should have these aggregated.
- How much new for-sale + rental construction is in the pipeline within 1–3 miles? Heavy new supply typically softens prices + rents 12–24 months out; constrained supply supports both.
Investment metrics
- 1% rule
- 0.85% ✗
- Cap rate
- 6.82%
- Cash-on-cash
- 1.90%
- DSCR
- 1.08
- GRM
- 9.8
CMA / ARV
- ARV (on-the-fly)
- $453,120
- Comps found
- 12
Show comp detail 12 sales within ~0.75 mi
| Address | Dist | Beds/Ba | Sqft | Sold | Price | $/sf | Match |
|---|---|---|---|---|---|---|---|
| 208 Hogan Ave | 0.28mi | 3/1.5 (-1) | 1,787 (-7%) | 0mo | $275,000 | $154 | 66 |
| 410 Royce St | 0.17mi | 3/2.0 (-1) | 1,970 (+3%) | 18mo | $389,500 | $198 | 66 |
| 203 Sunrise Dr | 0.18mi | 4/2.0 | 1,644 (-14%) | 7mo | $245,000 | $149 | 59 |
| 105 Idletime Dr | 0.38mi | 3/2.0 (-1) | 2,133 (+11%) | 2mo | $326,500 | $153 | 55 |
| 113 Magnolia Dr | 0.48mi | 3/2.0 (-1) | 2,000 (+4%) | 10mo | $472,900 | $236 | 55 |
| 514 Deborahs Way | 0.34mi | 3/2.5 (-1) | 2,184 (+14%) | 2mo | $515,000 | $236 | 54 |
| 1240 Whirlwind Rd | 0.38mi | 4/2.0 | 1,652 (-14%) | 10mo | $264,330 | $160 | 48 |
| 214 Marie Street St | 0.60mi | 3/2.0 (-1) | 2,040 (+6%) | 9mo | $285,000 | $140 | 47 |
| 225 Red Tail Rdg | 0.39mi | 3/2.5 (-1) | 1,642 (-14%) | 7mo | $425,000 | $259 | 47 |
| Lot 15 Deborahs Way | 0.35mi | 3/2.0 (-1) | 1,642 (-14%) | 9mo | $394,200 | $240 | 46 |
| 518 Deborahs Way | 0.35mi | 3/2.0 (-1) | 1,642 (-14%) | 9mo | $394,200 | $240 | 45 |
| 510 Deborahs Way | 0.35mi | 3/2.0 (-1) | 1,642 (-14%) | 16mo | $399,900 | $244 | 40 |
Match score weights: distance 35% · size 25% · config 20% · recency 20%. Top-matched comps best support the ARV.
Projected returns pro-forma
-3.0% appreciation · 3.0% rent growth · sell at horizon
- IRR
- -13.3%
- Equity multiple
- 0.52×
- Total profit
- $-21,319
- Equity at exit
- $23,707
- IRR
- -4.4%
- Equity multiple
- 0.71×
- Total profit
- $-12,959
- Equity at exit
- $13,747
Cash invested: $44,520 (down + closing). Projections, not guarantees.
Landlord ↔ Tenant lean methodology
- Overall (STATE)
- 87 Strongly Landlord-Friendly
- State Tennessee
- 87 Strongly Landlord-Friendly · R+13
- County
- — inherits STATE
- City
- — inherits STATE
ZIP-level market 37743
- Home prices YoY
- -8.5%
- Active inventory
- 253
- Price-to-rent
- 9.8×
Monthly cashflow live
- Estimated rent
- $1,350 medium interval (Pro) →
- Mortgage (P&I)
- −$834
- Tax from tax record
- −$96 /mo · $1,147/yr
- Insurance
- −$66
- HOA
- −$0
- Vacancy / Maint / Mgmt
- −$283
- Net cashflow
- $70
Break-even live
Sensitivity live
| Price | -10% $160 | -5% $115 | +0% $70 | +5% $25 | +10% $-20 |
|---|---|---|---|---|---|
| Rent | -10% $-36 | -5% $17 | +0% $70 | +5% $124 | +10% $177 |
| Rate | -1.0pp $151 | -0.5pp $111 | base $70 | +0.5pp $29 | +1.0pp $-13 |
UW: 25.0% down · 7.5% · 30yr · 1.5% tax · 5.0% vac · 8.0% maint · 8.0% mgmt
Financing live
Cash to close
- Down payment
- $39,750
- Closing costs
- $4,770
- Reserves months
- —
- Total cash needed
- —
Loan-product check · same deal, 3 products live
Conventional
25% down · 7.5% · 30yr
- Down + closing
- —
- Monthly P&I
- —
- Monthly cashflow
- —
- DSCR
- —
- Eligible?
- —
Personal DTI + credit; lowest rate.
DSCR
20% down · 8.5% · 30yr
- Down + closing
- —
- Monthly P&I
- —
- Monthly cashflow
- —
- DSCR
- —
- Eligible?
- —
No personal income docs; deal must DSCR.
Hard money
10% down · 12.0% · 12mo
- Down + closing
- —
- Monthly P&I
- —
- Monthly cashflow
- —
- DSCR
- —
- Eligible?
- —
Short-term bridge; refi at stabilization.
Listing history 6 events
-
2026-05-11status Pending
-
2026-05-01$159,000 Active
-
2022-09-01soldstatus $150,000
-
2022-08-31soldstatus $160,000 550-char remark
Show marketing remark (550 chars)
BACK ON THE MARKET, BUYERS FINANCING FELL THROUGH! Adorable cape cod in the city with 4 bedrooms, two baths, large back yard and unfinished basement! This home has the original hardwood floors and other features you will love! The main level consists of a large living room, two full baths, two bedrooms, dining and kitchen. Upstairs are two smaller bedrooms or office and playroom. The unfinished basement offers one car garage and storage space for plenty other items. Roof and heat pump less than ten years old and new main water line to the home.
-
2022-06-09$162,000 550-char remark
Show marketing remark (550 chars)
BACK ON THE MARKET, BUYERS FINANCING FELL THROUGH! Adorable cape cod in the city with 4 bedrooms, two baths, large back yard and unfinished basement! This home has the original hardwood floors and other features you will love! The main level consists of a large living room, two full baths, two bedrooms, dining and kitchen. Upstairs are two smaller bedrooms or office and playroom. The unfinished basement offers one car garage and storage space for plenty other items. Roof and heat pump less than ten years old and new main water line to the home.
-
2011-11-04soldstatus $55,900
ⓘ Source: listings_history table (triggers on properties + properties_extension) + one-shot
backfill from property_details.listing_events for pre-trigger history.
Tax reassessment forecast TN · Resets to sale price
- Current annual tax
- $1,147 · $96/mo
- Projected year-2 tax
- $1,147 · $96/mo
- Expected delta
- $0/yr ($0/mo · 0.0%)
ⓘ Screening estimate from a state-policy table — verify with the county assessor before closing.
Climate risk First Street
- Flood 1/10 Low FEMA zone X (unshaded) · 0% chance over 30 yrs
- Wildfire 3/10 Moderate
- Heat 4/10 Moderate 7 d/yr ≥101°F today · 20 d/yr by 30 yrs out
- Wind 2/10 Low
- Air quality 3/10 Moderate 2 unhealthy d/yr today · 3 by 30 yrs out
Nearby sold comps map
Loading sold comps map…
Walkable amenities ~0.75 mi
Loading nearby amenities…
Taxation est. · year 1
- Rental income
- $16,194
- − Mortgage interest
- −$8,906
- − Property taxes
- −$1,147
- − Insurance
- −$795
- − Repairs & maintenance
- −$1,296
- − Management
- −$1,296
- − Depreciation
- −$4,625
- Taxable loss
- −$1,871
- Est. tax savings @ 24.0%
- +$449
- After-tax cash flow
- $1,295/yr
For passive investors: Depreciation is non-cash, so a rental often shows a tax loss while cash-flowing — sheltering income. Rental losses are passive: they offset passive income freely, and up to $25,000/yr can offset ordinary (W-2) income if you actively participate and your MAGI is under $100k (phasing out to $0 by $150k); unused losses carry forward. On sale, claimed depreciation is recaptured at up to 25%, and gains may owe capital-gains tax (a 1031 exchange can defer both). Figures are a year-1 estimate at your 24.0% rate — not tax advice; consult a CPA.
Schools (NCES district)
- District
- Greeneville
- NCES district ID
- 4701500
- Math proficiency
- 31% ▼ -15.00%
- Reading proficiency
- 34% ▼ -7.00%
- Median HH income
- $32,683
- Composite
- 26.62/100
- National rank
- #7176
- State rank
- #45 of 139 in TN
Livability — Greeneville
- Score
- 66/100
- State rank
- #125
- US rank
- #11825
Category grades
Schools grade is shown separately in the Schools card above.
Census & demographics
- Census place
- Greeneville, TN
- County
- Greene County · 45,638 people
- City population
- 45,638
- Metro
- Greeneville, TN
- Population (ZIP)
- 24,548
- Household income
- $54,566
- Rent vs Own
- Severe rent burden
- 390.0
Population outlook (Greene County) Hauer SSP2
- Today (2025)
- 68,624 people
- By 2030
- 68,114 · -0.7%
- By 2040
- 66,167 · -3.6%
- By 2050
- 63,038 · -8.1%
- By 2075
- 55,274 · -19.5%
- By 2100
- 45,527 · -33.7%
Race, ethnicity, and origin ACS 2023
- Neighborhood character
- Predominantly White (91%)
- Race & ethnicity
- White 91% Two or more races 5% Hispanic / Latino 2% Black 2%
- Common ancestry
- Serbian 3% Italian 2% Romanian 2%
- Foreign-born
- 2% · Canada
- Languages at home
- 97% English-only · Spanish 2%
Political lean MEDSL · Greene
- 2024 margin
- Solid R (+65.7) · D 16.6% · R 82.3% · Other 1.2%
- 2008→2024 swing
- -25.0pp toward R · 2008: -40.7pp · 2024: -65.7pp
- All cycles
- 2024: R+65.7 2020: R+60.7 2016: R+61.0 2012: R+46.0 2008: R+40.7
Not yet ingested
- Civics
- —
Market trends
- HPI YoY
- ▼ -28.08%
- Current HPI
- 303.4589
- Rent YoY
- —
- Metro
- Greeneville, TN
- State GDP YoY
- ▲ 2.78%
- F500 in state
- 22
Industry mix (Fortune 500 HQ in TN)
| Industry | F500 HQs | Revenue |
|---|---|---|
| Healthcare | 3 | $91B |
|
||
| Retail | 3 | $72B |
|
||
| Transportation / Logistics | 1 | $88B |
|
||
| Paper / Packaging | 1 | $19B |
|
||
| Insurance | 1 | $13B |
|
||
| Energy | 1 | $12B |
|
||
Price history
+184.4% since first listed6 events — show timeline
- 2026-05-11 Pending — TVRMLS
- 2026-05-01 Listed $159,000 TVRMLS
- 2022-09-01 Sold (Public Records) $150,000 Public Records
- 2022-08-31 Sold (MLS) $160,000 TVRMLS
- 2022-06-09 Listed $162,000 TVRMLS
- 2011-11-04 Sold (Public Records) $55,900 Public Records
Property tax history
+7.5%/yrLatest (2025): $1,147 · +0.0% YoY. Source: county tax records.
Cash-flow waterfall
monthlySold comps — $/sqft
last 12 mo · ≤1 miLoading sold comps…