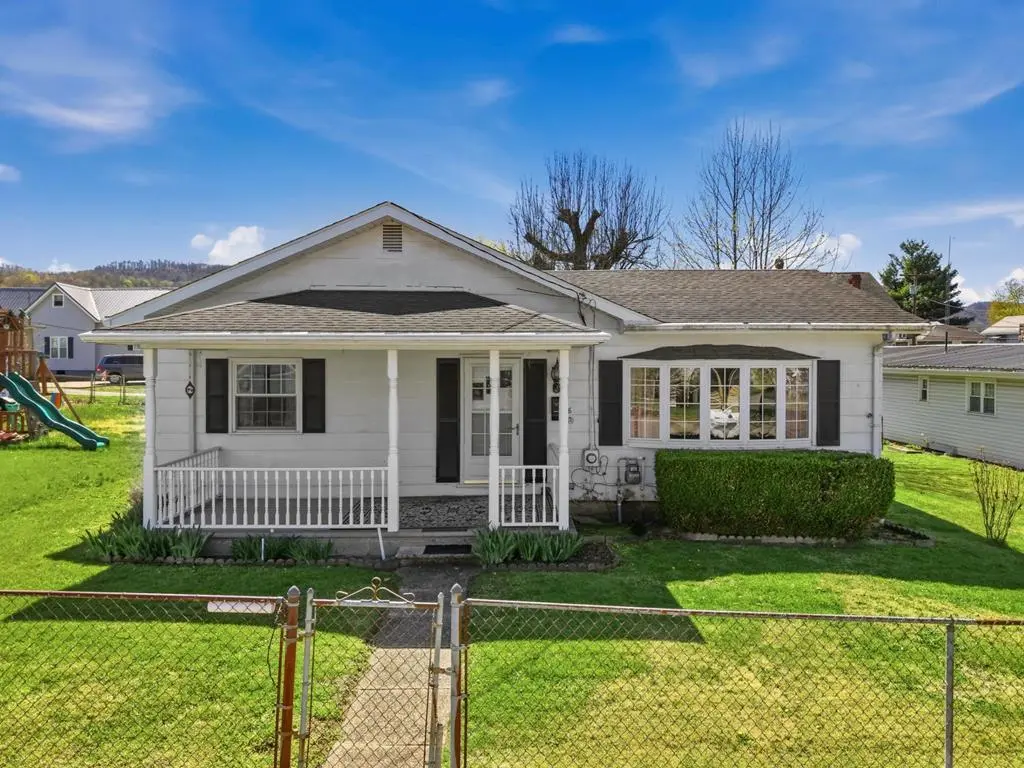
208 Stephens St · Paden City, WV
Flood risk 6/10 · Moderate
- FEMA flood zone
- X (unshaded)
- Chance of flooding over 30 yrs
- 0.64%
- Est. flood insurance / yr
- $473 – $860
Fire risk 1/10 · Minimal
- Est. fire insurance / yr
- $787 – $1,461
Heat risk 4/10 · Minor
- Hot days now (above 97°F)
- 8 days/yr
- Hot days in 30 yrs
- 20 days/yr
Wind risk 1/10 · Minimal
- Chance of severe wind over 30 yrs
- 0.0%
Air-quality risk 2/10 · Minimal
- Unhealthy air days now
- 0 days/yr
- Unhealthy air days in 30 yrs
- 1 days/yr
Risk factors via First Street. Map © Google.
Why this score? — see what drove the C- grade
The composite is a weighted blend of 9 inputs, each scored 0–100. Each bar is that input's sub-score; the figure is the points it added to the 100-point composite (weight × sub-score).
- Cash flow +13.5/30.0
- ARV discount +10.9/15.0
- Appreciation +9.7/10.0
- DSCR +4.1/10.0
- Livability +3.2/5.0
- 1% rule +2.6/10.0
- Rent growth +2.5/5.0
- Condition / age +2.5/5.0
- Schools +2.4/10.0
$124,900
🖨 Deal sheet 📄 Offer letter ✓ Due diligence
Listing remarks
Charming 3-bedroom, 1.5-bath ranch-style home located in Paden City! This spacious home features higher ceilings and offers convenient first-floor living, with washer and dryer hookups located on the main level. Enjoy a full, partially finished basement providing additional living or storage space. Step outside to a level, partially fenced-in yard—perfect for relaxing, or entertaining. The home also offers a welcoming front porch for sitting and a nice patio out back, along with an outbuilding for extra storage. With plenty of potential to make it your own! (All measurements approximate)
Key facts
- Level yard
- Front porch
- First floor living
Tags
Property features AI
Exterior
- Utilities: Public water; Public sewer
- Home design: Single-family ranch residence; Single-story
- Construction: Shingle roof
- Exterior features: Porch; Fenced yard; Outbuilding
Interior
- Kitchen: Dishwasher; Range; Refrigerator
- Bedrooms: Total of 6 rooms (includes bedrooms and living spaces)
- Flooring: Carpet flooring
- Bathrooms: 1 full bathroom; 1 half bathroom
- Heating & cooling: Central air; Ceiling fans; Forced air heating; Natural gas heating
- Interior features: Finished full basement; Gas water heater
Neighborhood map
What this means for you Summary
Snapshot
- This is a 2-bed/1.5-bath single-family listed at $125k.
Deal economics
- At list price, monthly cash flow is $5 ($65/yr) — positive.
- The deal already cash-flows at list — no discount required.
- To meet the 1% rule (rent ≥ 1% of price), the offer needs to be $95k (24.3% below list).
- Recommended offer: $95k (24.3% below list) — sets the bar for 1% rule.
Location & tenants
- Location reads 64/100 on livability (#133 in WV) — a middle-class / working-renter tenant base. Strengths: crime A+, cost of living A+, housing A; Watch: schools D, employment D, amenities F.
- Wetzel County Schools (town): math 25% / reading 33% proficiency, ranked #36 of 55 in WV (top 66%) — low school quality limits family demand, transient renter base, plan for 1-2y turnover.
- Market conditions: 12 active listings in the ZIP.
Forward outlook
- In year one you build about $13k of equity ($864 loan paydown + $12k appreciation (9.4% local appreciation)).
- Wetzel County population projected at -28% by 2050 — secular population decline; favor cash flow + early exit over multi-decade hold.
- At projected returns (9.4% appreciation + 3.0% rent growth), your $35k cash investment doubles in ~3 years — after that, you're playing with house money.
- By year 3, paydown + projected appreciation supports a ~$32k cash-out refi (75% LTV) — recoverable capital for the next deal without selling this one.
Negotiation context
- It's been on market 46 days — a 3% lower offer ($121k) is reasonable based on typical stale-listing flexibility.
- 2 sale attempts with the ask held roughly flat each time — persistent listings suggest the price (not the market) is what's stuck; bring a comps-based counter.
Risks & watch-outs
- Climate carrying-cost: major flood risk — expect insurance premiums to compound above CPI over the hold.
Questions for the listing agent
- It's been on market 46 days. Have you received any prior offers? Is the seller open to a 24% concession, seller financing, or rate buy-down credit?
- Built in 1968 — when were the roof, HVAC, electrical panel, plumbing, and water heater last replaced?
- Is there a deadline driving the sale (1031 exchange, divorce, estate, relocation)? That informs how much negotiation room exists.
- Schools are D-rated, which usually means shorter tenancies and higher turnover. Who's the typical renter profile here, and what's been the actual vacancy rate?
- What's the average days-on-market for RENTAL listings here right now (not sales)? A rising rental-DOM trend means longer vacancies and softer asking-rent achievability than the comps imply.
- What's the recent tenant-quality profile in this submarket — average credit score on applications, eviction rate, late-payment / NSF rate, and stable-employment percentage? A property-management company in the area should have these aggregated.
- How much new for-sale + rental construction is in the pipeline within 1–3 miles? Heavy new supply typically softens prices + rents 12–24 months out; constrained supply supports both.
Investment metrics
- 1% rule
- 0.76% ✗
- Cap rate
- 6.35%
- Cash-on-cash
- 0.19%
- DSCR
- 1.01
- GRM
- 11.0
CMA / ARV
- ARV (on-the-fly)
- $135,090
- Comps found
- 12
Show comp detail 12 sales within ~0.75 mi
| Address | Dist | Beds/Ba | Sqft | Sold | Price | $/sf | Match |
|---|---|---|---|---|---|---|---|
| 311 E Main St | 0.26mi | 3/3.0 (+1) | 1,560 (+4%) | 3mo | $185,000 | $119 | 68 |
| 709 North 7th Ave | 0.49mi | 3/2.0 (+1) | 1,536 (+2%) | 1mo | $165,000 | $107 | 65 |
| 521 S 4th Ave | 0.46mi | 2/1.0 | 1,386 (-8%) | 3mo | $103,000 | $74 | 61 |
| 216 North 2nd Ave | 0.08mi | 3/1.0 (+1) | 1,318 (-12%) | 12mo | $141,500 | $107 | 59 |
| 713 N 8th Ave | 0.53mi | 2/1.0 | 1,392 (-7%) | 6mo | $35,000 | $25 | 56 |
| 705 South 4th Ave | 0.46mi | 3/1.0 (+1) | 1,363 (-9%) | 2mo | $140,000 | $103 | 55 |
| 412 N 2nd Ave | 0.33mi | 3/1.5 (+1) | 1,276 (-15%) | 1mo | $91,000 | $71 | 54 |
| 501 9th. Ave | 0.38mi | 3/1.0 (+1) | 1,412 (-6%) | 19mo | $24,000 | $17 | 50 |
| 111 Adams St | 0.58mi | 3/1.0 (+1) | 1,336 (-11%) | 5mo | $120,000 | $90 | 44 |
| 914 Meadow Hts | 0.69mi | 3/2.0 (+1) | 1,400 (-7%) | 7mo | $90,000 | $64 | 43 |
| 726 N 4th Ave | 0.49mi | 3/1.0 (+1) | 1,294 (-14%) | 5mo | $38,500 | $30 | 43 |
| 215 Helen St | 0.44mi | 3/1.0 (+1) | 1,350 (-10%) | 16mo | $140,000 | $104 | 42 |
Match score weights: distance 35% · size 25% · config 20% · recency 20%. Top-matched comps best support the ARV.
Projected returns pro-forma
9.37% appreciation · 3.0% rent growth · sell at horizon
- IRR
- 23.1%
- Equity multiple
- 2.80×
- Total profit
- $62,936
- Equity at exit
- $106,803
- IRR
- 20.7%
- Equity multiple
- 6.25×
- Total profit
- $183,706
- Equity at exit
- $224,500
Cash invested: $34,972 (down + closing). Projections, not guarantees.
Landlord ↔ Tenant lean methodology
- Overall (STATE)
- 83 Strongly Landlord-Friendly
- State West Virginia
- 83 Strongly Landlord-Friendly · R+22
- County
- — inherits STATE
- City
- — inherits STATE
ZIP-level market 26159
- Home prices YoY
- 5.5%
- Active inventory
- 12
- Price-to-rent
- 11.0×
Monthly cashflow live
- Estimated rent
- $946 medium interval (Pro) →
- Mortgage (P&I)
- −$655
- Tax from tax record
- −$35 /mo · $417/yr
- Insurance
- −$52
- HOA
- −$0
- Vacancy / Maint / Mgmt
- −$199
- Net cashflow
- $5
Break-even live
UW: 25.0% down · 7.5% · 30yr · 1.5% tax · 5.0% vac · 8.0% maint · 8.0% mgmt
Financing live
Cash to close
- Down payment
- $31,225
- Closing costs
- $3,747
- Reserves months
- —
- Total cash needed
- —
Loan-product check · same deal, 3 products live
Conventional
25% down · 7.5% · 30yr
- Down + closing
- —
- Monthly P&I
- —
- Monthly cashflow
- —
- DSCR
- —
- Eligible?
- —
Personal DTI + credit; lowest rate.
DSCR
20% down · 8.5% · 30yr
- Down + closing
- —
- Monthly P&I
- —
- Monthly cashflow
- —
- DSCR
- —
- Eligible?
- —
No personal income docs; deal must DSCR.
Hard money
10% down · 12.0% · 12mo
- Down + closing
- —
- Monthly P&I
- —
- Monthly cashflow
- —
- DSCR
- —
- Eligible?
- —
Short-term bridge; refi at stabilization.
Listing history 19 events
-
2026-06-18days on market $124,900 Active 46 DOM
-
2026-06-17days on market $124,900 Active 45 DOM
-
2026-06-16days on market $124,900 Active 44 DOM
-
2026-06-15days on market $124,900 Active 43 DOM
-
2026-06-15days on market $124,900 Active 42 DOM
-
2026-06-13days on market $124,900 Active 41 DOM
-
2026-06-12days on market $124,900 Active 40 DOM
-
2026-06-09days on market $124,900 Active 37 DOM
-
2026-06-08days on market $124,900 Active 36 DOM
-
2026-06-08days on market $124,900 Active 35 DOM
-
2026-06-07days on market $124,900 Active 34 DOM
-
2026-06-04days on market $124,900 Active 32 DOM
-
2026-06-03days on market $124,900 Active 31 DOM
-
2026-06-02days on market $124,900 Active 30 DOM
-
2026-06-01days on market $124,900 Active 29 DOM
-
2026-05-31days on market $124,900 Active 28 DOM
-
2026-05-13status Active
-
2026-04-19status Pending
-
2026-04-09$124,900 Active
ⓘ Source: listings_history table (triggers on properties + properties_extension) + one-shot
backfill from property_details.listing_events for pre-trigger history.
Tax reassessment forecast WV · Resets to sale price
- Current annual tax
- $417 · $35/mo
- Projected year-2 tax
- $737 · $61/mo
- Expected delta
- +$320/yr (+$27/mo · 76.6%)
ⓘ Screening estimate from a state-policy table — verify with the county assessor before closing.
Climate risk First Street
- Flood 6/10 Major FEMA zone X (unshaded) · 64% chance over 30 yrs
- Wildfire 1/10 Low
- Heat 4/10 Moderate 8 d/yr ≥97°F today · 20 d/yr by 30 yrs out
- Wind 1/10 Low 0% chance of damaging wind over 30 yrs
- Air quality 2/10 Low 0 unhealthy d/yr today · 1 by 30 yrs out
Nearby sold comps map
Loading sold comps map…
Walkable amenities ~0.75 mi
Loading nearby amenities…
Taxation est. · year 1
- Rental income
- $11,350
- − Mortgage interest
- −$6,996
- − Property taxes
- −$417
- − Insurance
- −$624
- − Repairs & maintenance
- −$908
- − Management
- −$908
- − Depreciation
- −$3,633
- Taxable loss
- −$2,137
- Est. tax savings @ 24.0%
- +$513
- After-tax cash flow
- $578/yr
For passive investors: Depreciation is non-cash, so a rental often shows a tax loss while cash-flowing — sheltering income. Rental losses are passive: they offset passive income freely, and up to $25,000/yr can offset ordinary (W-2) income if you actively participate and your MAGI is under $100k (phasing out to $0 by $150k); unused losses carry forward. On sale, claimed depreciation is recaptured at up to 25%, and gains may owe capital-gains tax (a 1031 exchange can defer both). Figures are a year-1 estimate at your 24.0% rate — not tax advice; consult a CPA.
Schools (NCES district)
- District
- Wetzel County Schools
- NCES district ID
- 5401560
- Math proficiency
- 25% ▼ -11.00%
- Reading proficiency
- 33% ▼ -8.00%
- Median HH income
- $38,296
- Composite
- 24.22/100
- National rank
- #7726
- State rank
- #36 of 55 in WV
Livability — Paden City
- Score
- 64/100
- State rank
- #133
- US rank
- #13654
Category grades
Schools grade is shown separately in the Schools card above.
Census & demographics
- Census place
- Paden City, WV
- City population
- 2,523
- Population (ZIP)
- 2,523
Population outlook (Wetzel County) Hauer SSP2
- Today (2025)
- 14,127 people
- By 2030
- 13,248 · -6.2%
- By 2040
- 11,611 · -17.8%
- By 2050
- 10,193 · -27.8%
- By 2075
- 7,753 · -45.1%
- By 2100
- 5,922 · -58.1%
Race, ethnicity, and origin ACS 2023
- Neighborhood character
- Predominantly White (98%)
- Race & ethnicity
- White 98% Two or more races 2%
- Common ancestry
- Slovak 1% Serbian 1% Italian 1%
- Foreign-born
- 0%
- Languages at home
- 99% English-only · German/W. Germanic 1%
Political lean MEDSL · Wetzel
- 2024 margin
- Solid R (+55.5) · D 21.0% · R 76.5% · Other 2.5%
- 2008→2024 swing
- -49.3pp toward R · 2008: -6.2pp · 2024: -55.5pp
- All cycles
- 2024: R+55.5 2020: R+51.8 2016: R+50.3 2012: R+21.6 2008: R+6.2
Not yet ingested
- Civics
- —
Market trends
- HPI YoY
- ▲ 9.37%
- Current HPI
- 179.1787
- Rent YoY
- —
- Metro
- —
- State GDP YoY
- —
- F500 in state
- 0
Price history
3 events — show timeline
- 2026-05-13 Relisted — WBOR
- 2026-04-19 Pending — WBOR
- 2026-04-09 Listed $124,900 WBOR
Property tax history
+8.0%/yrLatest (2025): $417 · +14.1% YoY. Source: county tax records.
Cash-flow waterfall
monthlySold comps — $/sqft
last 12 mo · ≤1 miLoading sold comps…