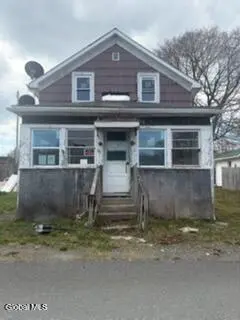
26 Water St · Hoosick Falls, NY
Flood risk 1/10 · Minimal
- FEMA flood zone
- X (unshaded)
- Chance of flooding over 30 yrs
- 0.0%
- Est. flood insurance / yr
- $473 – $860
Fire risk 4/10 · Minor
- Est. fire insurance / yr
- $691 – $1,283
Heat risk 3/10 · Minor
- Hot days now (above 94°F)
- 7 days/yr
- Hot days in 30 yrs
- 16 days/yr
Wind risk 3/10 · Minor
- Chance of severe wind over 30 yrs
- 6.0%
Air-quality risk 2/10 · Minimal
- Unhealthy air days now
- 1 days/yr
- Unhealthy air days in 30 yrs
- 1 days/yr
Risk factors via First Street. Map © Google.
Why this score? — see what drove the B+ grade
The composite is a weighted blend of 9 inputs, each scored 0–100. Each bar is that input's sub-score; the figure is the points it added to the 100-point composite (weight × sub-score).
- Cash flow +30.0/30.0
- 1% rule +10.0/10.0
- DSCR +10.0/10.0
- ARV discount +7.5/15.0
- Appreciation +5.5/10.0
- Schools +4.4/10.0
- Livability +3.6/5.0
- Rent growth +2.5/5.0
- Condition / age +2.5/5.0
$50,000
🖨 Deal sheet 📄 Offer letter ✓ Due diligence
Listing remarks MLS
Opportunity awaits in Hoosick Falls! This property overlooks the Hoosic River. It has been fully gutted and is ready for your vision. Seller has already completed all interior demolition, offering a blank slate to design and finish to your specifications. Newer windows and doors have been installed in some of the property. Potential layout includes 3 bedrooms and 2 full bathrooms. Ideal for investors, flippers, or contractors looking for their next project. Cash only sale. Bring your plans and transform this property into like-new condition!
Key facts
- Fully gutted
- 4,791 sq ft lot
- 2 parking spots
Tags
Neighborhood map
What this means for you Summary
Snapshot
- This is a 3-bed/1.0-bath single-family listed at $50k.
Deal economics
- At list price, monthly cash flow is $854 ($10k/yr) — positive.
- The deal already cash-flows at list — no discount required.
- Meets the 1% rule at list price ($2k rent vs $50k).
- Recommended offer: $47k (6.0% below list) — sets the bar for market timing.
- Cap rate 26.8% vs local median 4.7% in Hoosick Falls — top-decile yield for the area; either an underpriced asset or a hidden risk that comps aren't pricing in. Stress-test before assuming the spread holds.
Location & tenants
- Location reads 72/100 on livability (#371 in NY) — a middle-class / working-renter tenant base. Strengths: housing A+, health & safety A+, cost of living A; Watch: amenities F, commute F.
- Hoosick Falls Central School District (rural): math 52% / reading 46% proficiency, ranked #469 of 755 in NY (top 62%) — families likely to look elsewhere, expect single-tenant / working-renter base with shorter leases.
- Market conditions: 49 active listings in the ZIP; 405 units permitted in Rensselaer County in 2024 (224 in 5+ unit buildings).
Forward outlook
- In year one you build about $856 of equity ($346 loan paydown + $510 appreciation (1.0% local appreciation)).
- Rensselaer County population projected to shrink 6% by 2050 — rents likely to lag national; underwrite the cash flow, not the appreciation.
- At projected returns (1.0% appreciation + 3.0% rent growth), your $14k cash investment doubles in ~2 years — after that, you're playing with house money.
Negotiation context
- It's been on market 65 days — a 6% lower offer ($47k) is reasonable based on typical stale-listing flexibility.
- 3 sale attempts since 23y ago with the ask held roughly flat each time — persistent listings suggest the price (not the market) is what's stuck; bring a comps-based counter.
Risks & watch-outs
- Watch-outs: built in 1940 — expect roof / HVAC / electrical / plumbing capex.
Questions for the listing agent
- It's been on market 65 days. Have you received any prior offers? Is the seller open to a 6% concession, seller financing, or rate buy-down credit?
- Built in 1940 — when were the roof, HVAC, electrical panel, plumbing, and water heater last replaced?
- Why hasn't it sold? Are there any deal-killer items the seller is aware of (foundation, flood, title, zoning, code violations)?
- Is there a deadline driving the sale (1031 exchange, divorce, estate, relocation)? That informs how much negotiation room exists.
- What's the average days-on-market for RENTAL listings here right now (not sales)? A rising rental-DOM trend means longer vacancies and softer asking-rent achievability than the comps imply.
- What's the recent tenant-quality profile in this submarket — average credit score on applications, eviction rate, late-payment / NSF rate, and stable-employment percentage? A property-management company in the area should have these aggregated.
- How much new for-sale + rental construction is in the pipeline within 1–3 miles? Heavy new supply typically softens prices + rents 12–24 months out; constrained supply supports both.
Investment metrics
- 1% rule
- 3.04% ✓
- Cap rate
- 26.78%
- Cash-on-cash
- 73.19%
- DSCR
- 4.26
- GRM
- 2.7
CMA / ARV
- ARV (median comp)
- $182,545
- List price
- $50,000
- Delta
- -72.61%
- Verdict
- UNDERPRICED
- Comps
- 20 within 1.0 mi
Show comp detail 12 sales within ~0.75 mi
| Address | Dist | Beds/Ba | Sqft | Sold | Price | $/sf | Match |
|---|---|---|---|---|---|---|---|
| 36 3rd St | 0.32mi | 3/1.0 | 1,344 (+3%) | 3mo | $32,500 | $24 | 77 |
| 31 High St | 0.28mi | 2/1.0 (-1) | 1,318 (+1%) | 11mo | $235,000 | $178 | 70 |
| 39 Abbott St | 0.37mi | 3/1.0 | 1,254 (-4%) | 9mo | $235,000 | $187 | 70 |
| 31 Carey Ave | 0.53mi | 3/1.5 | 1,337 (+3%) | 2mo | $134,900 | $101 | 67 |
| 22 Scott St | 0.43mi | 3/2.0 | 1,248 (-4%) | 6mo | $287,000 | $230 | 64 |
| 21 Hovey Ave | 0.51mi | 3/1.5 | 1,221 (-6%) | 4mo | $245,000 | $201 | 61 |
| 115 Railroad Ave | 0.58mi | 3/1.0 | 1,338 (+3%) | 10mo | $149,460 | $112 | 60 |
| 5 Carey Ave | 0.48mi | 3/2.0 | 1,184 (-9%) | 4mo | $125,000 | $106 | 56 |
| 166 Church St | 0.47mi | 3/1.0 | 1,440 (+11%) | 8mo | $240,000 | $167 | 53 |
| 16 Snow St | 0.47mi | 2/1.0 (-1) | 1,200 (-8%) | 11mo | $105,000 | $88 | 51 |
| 20 Carey Ave | 0.51mi | 3/1.0 | 1,493 (+15%) | 8mo | $160,000 | $107 | 45 |
| 84 Richmond Ave | 0.64mi | 2/1.5 (-1) | 1,447 (+11%) | 9mo | $155,000 | $107 | 37 |
Match score weights: distance 35% · size 25% · config 20% · recency 20%. Top-matched comps best support the ARV.
Projected returns pro-forma
1.02% appreciation · 3.0% rent growth · sell at horizon
- IRR
- 76.1%
- Equity multiple
- 4.96×
- Total profit
- $55,389
- Equity at exit
- $17,122
- IRR
- 77.1%
- Equity multiple
- 10.13×
- Total profit
- $127,799
- Equity at exit
- $22,795
Cash invested: $14,000 (down + closing). Projections, not guarantees.
Landlord ↔ Tenant lean methodology
- Overall (STATE)
- 15 Strongly Tenant-Friendly
- State New York
- 15 Strongly Tenant-Friendly · D+10
- County
- — inherits STATE
- City
- — inherits STATE
ZIP-level market 12090
- Home prices YoY
- 0.5%
- Active inventory
- 49
- Price-to-rent
- 2.7×
Monthly cashflow live
- Estimated rent
- $1,518 medium interval (Pro) →
- Mortgage (P&I)
- −$262
- Tax est. 1.5%
- −$62 /mo · $750/yr
- Insurance
- −$21
- HOA
- −$0
- Vacancy / Maint / Mgmt
- −$319
- Net cashflow
- $854
Break-even live
UW: 25.0% down · 7.5% · 30yr · 1.5% tax · 5.0% vac · 8.0% maint · 8.0% mgmt
Financing live
Cash to close
- Down payment
- $12,500
- Closing costs
- $1,500
- Reserves months
- —
- Total cash needed
- —
Loan-product check · same deal, 3 products live
Conventional
25% down · 7.5% · 30yr
- Down + closing
- —
- Monthly P&I
- —
- Monthly cashflow
- —
- DSCR
- —
- Eligible?
- —
Personal DTI + credit; lowest rate.
DSCR
20% down · 8.5% · 30yr
- Down + closing
- —
- Monthly P&I
- —
- Monthly cashflow
- —
- DSCR
- —
- Eligible?
- —
No personal income docs; deal must DSCR.
Hard money
10% down · 12.0% · 12mo
- Down + closing
- —
- Monthly P&I
- —
- Monthly cashflow
- —
- DSCR
- —
- Eligible?
- —
Short-term bridge; refi at stabilization.
Listing history 21 events
-
2026-06-19days on market $50,000 Active 65 DOM
-
2026-06-18days on market $50,000 Active 64 DOM
-
2026-06-17days on market $50,000 Active 63 DOM
-
2026-06-16days on market $50,000 Active 62 DOM
-
2026-06-15days on market $50,000 Active 61 DOM
-
2026-06-14days on market $50,000 Active 59 DOM
-
2026-06-12days on market $50,000 Active 58 DOM
-
2026-06-09days on market $50,000 Active 55 DOM
-
2026-06-08days on market $50,000 Active 54 DOM
-
2026-06-07days on market $50,000 Active 53 DOM
-
2026-06-04days on market $50,000 Active 49 DOM
-
2026-06-02days on market $50,000 Active 48 DOM
-
2026-06-01days on market $50,000 Active 47 DOM
-
2026-05-31days on market $50,000 Active 46 DOM
-
2026-05-31days on market $50,000 Active 45 DOM
-
2026-04-14$50,000 Active 551-char remark
Show marketing remark (551 chars)
Opportunity awaits in Hoosick Falls! This property overlooks the Hoosic River. It has been fully gutted and is ready for your vision. Seller has already completed all interior demolition, offering a blank slate to design and finish to your specifications. Newer windows and doors have been installed in some of the property. Potential layout includes 3 bedrooms and 2 full bathrooms. Ideal for investors, flippers, or contractors looking for their next project. Cash only sale. Bring your plans and transform this property into like-new condition!
-
2022-08-01historical
-
2022-03-05$39,900 Active
-
2004-10-08soldstatus $66,900
-
2004-08-01historical
-
2003-11-20$66,500
ⓘ Source: listings_history table (triggers on properties + properties_extension) + one-shot
backfill from property_details.listing_events for pre-trigger history.
Climate risk First Street
- Flood 1/10 Low FEMA zone X (unshaded) · 0% chance over 30 yrs
- Wildfire 4/10 Moderate
- Heat 3/10 Moderate 7 d/yr ≥94°F today · 16 d/yr by 30 yrs out
- Wind 3/10 Moderate 6% chance of damaging wind over 30 yrs
- Air quality 2/10 Low 1 unhealthy d/yr today · 1 by 30 yrs out
Nearby sold comps map
Loading sold comps map…
Walkable amenities ~0.75 mi
Loading nearby amenities…
Taxation est. · year 1
- Rental income
- $18,218
- − Mortgage interest
- −$2,801
- − Property taxes
- −$750
- − Insurance
- −$250
- − Repairs & maintenance
- −$1,457
- − Management
- −$1,457
- − Depreciation
- −$1,455
- Taxable income
- $10,048
- Est. tax owed @ 24.0%
- −$2,412
- After-tax cash flow
- $7,834/yr
For passive investors: Depreciation is non-cash, so a rental often shows a tax loss while cash-flowing — sheltering income. Rental losses are passive: they offset passive income freely, and up to $25,000/yr can offset ordinary (W-2) income if you actively participate and your MAGI is under $100k (phasing out to $0 by $150k); unused losses carry forward. On sale, claimed depreciation is recaptured at up to 25%, and gains may owe capital-gains tax (a 1031 exchange can defer both). Figures are a year-1 estimate at your 24.0% rate — not tax advice; consult a CPA.
Schools (NCES district)
- District
- Hoosick Falls Central School District
- NCES district ID
- 3614760
- Math proficiency
- 52% ▲ 5.00%
- Reading proficiency
- 46% ▬ 0.00%
- Median HH income
- $54,349
- Composite
- 44.44/100
- National rank
- #6093
- State rank
- #469 of 755 in NY
Livability — Hoosick Falls
- Score
- 72/100
- State rank
- #371
- US rank
- #6412
Category grades
Schools grade is shown separately in the Schools card above.
Census & demographics
- Census place
- Hoosick Falls, NY
- Population (ZIP)
- 5,874
Population outlook (Rensselaer County) Hauer SSP2
- Today (2025)
- 162,400 people
- By 2030
- 161,746 · -0.4%
- By 2040
- 158,095 · -2.7%
- By 2050
- 152,966 · -5.8%
- By 2075
- 140,767 · -13.3%
- By 2100
- 124,727 · -23.2%
Race, ethnicity, and origin ACS 2023
- Neighborhood character
- Predominantly White (93%)
- Race & ethnicity
- White 93% Hispanic / Latino 5% Two or more races 2%
- Common ancestry
- Romanian 6% Lithuanian 5% Iranian 3%
- Foreign-born
- 2% · Canada
- Languages at home
- 94% English-only · Spanish 2% German/W. Germanic 1% Russian/Polish/Slavic 1%
Political lean MEDSL · Rensselaer
- 2024 margin
- Toss-up / Even · D 50.7% · R 49.3%
- 2008→2024 swing
- -8.0pp toward R · 2008: 9.3pp · 2024: 1.4pp
- All cycles
- 2024: D+1.4 2020: D+5.6 2016: R+2.9 2012: D+11.8 2008: D+9.3
Not yet ingested
- Civics
- —
Market trends
- HPI YoY
- ▲ 1.02%
- Current HPI
- 218.9096
- Rent YoY
- —
- Metro
- —
- State GDP YoY
- ▲ 2.60%
- F500 in state
- 92
Industry mix (Fortune 500 HQ in NY)
| Industry | F500 HQs | Revenue |
|---|---|---|
| Financial Services | 10 | $950B |
|
||
| Consumer Goods | 9 | $162B |
|
||
| Insurance | 4 | $225B |
|
||
| Telecommunications | 2 | $144B |
|
||
| Pharmaceuticals | 2 | $112B |
|
||
| Media / Entertainment | 2 | $69B |
|
||
Price history
-24.8% since first listed6 events — show timeline
- 2026-04-14 Listed $50,000 Global MLS
- 2022-08-01 Listing Removed — Global MLS
- 2022-03-05 Listed $39,900 Global MLS
- 2004-10-08 Sold (MLS) $66,900 Global MLS
- 2004-08-01 Listing Removed — Global MLS
- 2003-11-20 Listed $66,500 Global MLS
Property tax history
+9.8%/yrLatest (2025): $5,240 · +15.3% YoY. Source: county tax records.
Cash-flow waterfall
monthlySold comps — $/sqft
last 12 mo · ≤1 miLoading sold comps…