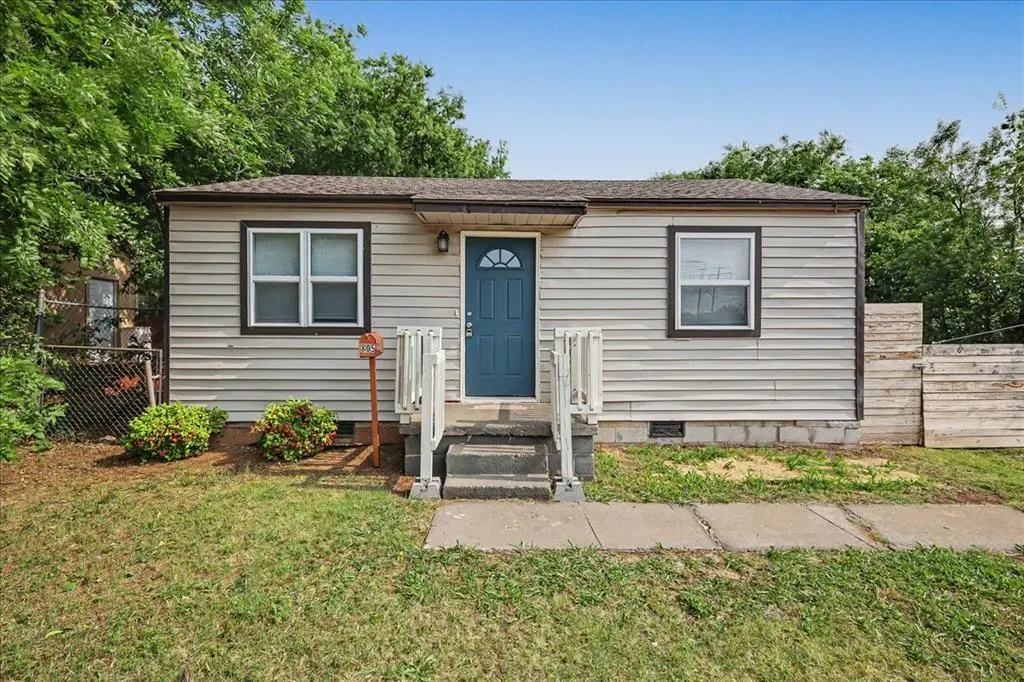
805 NW 91st St · Oklahoma City, OK
Flood risk 1/10 · Minimal
- FEMA flood zone
- X (unshaded)
- Chance of flooding over 30 yrs
- 0.0%
- Est. flood insurance / yr
- $507 – $1,088
Fire risk 3/10 · Minor
- Est. fire insurance / yr
- $2,463 – $4,575
Heat risk 6/10 · Moderate
- Hot days now (above 107°F)
- 7 days/yr
- Hot days in 30 yrs
- 19 days/yr
Wind risk 2/10 · Minimal
- Chance of severe wind over 30 yrs
- 2.0%
Air-quality risk 2/10 · Minimal
- Unhealthy air days now
- 2 days/yr
- Unhealthy air days in 30 yrs
- 2 days/yr
Risk factors via First Street. Map © Google.
Why this score? — see what drove the C grade
The composite is a weighted blend of 9 inputs, each scored 0–100. Each bar is that input's sub-score; the figure is the points it added to the 100-point composite (weight × sub-score).
- Cash flow +20.4/30.0
- ARV discount +15.0/15.0
- DSCR +6.5/10.0
- 1% rule +4.6/10.0
- Livability +4.0/5.0
- Rent growth +3.4/5.0
- Condition / age +2.5/5.0
- Schools +0.7/10.0
- Appreciation +0.0/10.0
$125,000
🖨 Deal sheet 📄 Offer letter ✓ Due diligence
Listing remarks
Welcome to this charming home in the heart of Oklahoma City! Perfect for first-time buyers or investors, this property offers a great opportunity with comfortable living spaces, a functional layout, and endless potential to make it your own. Conveniently located near shopping, dining, schools, and easy highway access, this home combines affordability and location. Whether you’re looking to expand your investment portfolio or purchase your first home, this one is full of possibilities!
Key facts
- 7,000 sq ft lot
- Built 1950
- Listed 14 days
Property features AI
Finance
- Other: Listed as active and unoccupied; Directions: Take Britton to N Classen, go south on N Classen to 91st, go west on 91st — first house on the right.
- Financial info: Loan qualification available (assumable: no)
- HOA & community: No mandatory association dues
Exterior
- Home design: Single-family residence; One-story; Existing property; Located in Britton City First
- Construction: Frame construction; Composition roof; Combination foundation; Homestead eligible
- Exterior features: Outbuildings; Corner lot
Interior
- Bedrooms: 2 bedrooms
- Bathrooms: 2 full bathrooms
- Heating & cooling: Electric heat; No central air
- Interior features: One living area; No fireplace
Neighborhood map
What this means for you Summary
Snapshot
- This is a 2-bed/1.0-bath single-family listed at $125k.
Deal economics
- At list price, monthly cash flow is $162 ($2k/yr) — positive.
- The deal already cash-flows at list — no discount required.
- To meet the 1% rule (rent ≥ 1% of price), the offer needs to be $120k (4.2% below list).
- Recommended offer: $120k (4.2% below list) — sets the bar for 1% rule.
- Cap rate 7.8% vs local median 3.7% in Oklahoma City — top-decile yield for the area; either an underpriced asset or a hidden risk that comps aren't pricing in. Stress-test before assuming the spread holds.
Location & tenants
- Location reads 80/100 on livability (#3 in OK, #1,635 nationally) — a professional / high-income tenant draw. Strengths: amenities A+, commute A+, cost of living A+; Watch: crime F.
- Oklahoma City (urban): math 7% / reading 10% proficiency, ranked #254 of 270 in OK (top 94%) — low school quality limits family demand, transient renter base, plan for 1-2y turnover; 82% free/reduced lunch — lower-income household profile, screen leases tightly.
- Zoned schools: Nichols Hills Es (math 17% / reading 17%, grade F, #540 of 845 statewide, top 68%, 494 students, 0% FRL); John Marshall Hs (math 2% / reading 8%, grade F, #430 of 447 statewide, top 99%, 829 students, 0% FRL) — zoned schools average 0% FRL vs 82% district-wide (82 pts lower); this property's tenant base skews higher-income than the district average.
- Market conditions: Rents rising (+3.5%/yr); 145 active listings in the ZIP; 40 comparable units currently listed for rent nearby; rentals at typical pace (median 22d on market — plan ~3-4 weeks tenant-placement turnaround); 5,365 units permitted in Oklahoma County in 2024 (569 in 5+ unit buildings).
Forward outlook
- Local home prices are declining (-3.0%/yr); year-one equity from $864 of loan paydown is wiped out by about $4k of value loss. Plan a longer hold.
- Oklahoma County population projected at +41% by 2050 — long-run rental-demand tailwind backs the buy-and-hold thesis.
Negotiation context
- Only 14 days on market — expect competitive offers; lowballing is unlikely to land.
- Current owner paid $60k; list at $125k implies a 108% gain — meaningful room to come down on a strong offer.
Risks & watch-outs
- Watch-outs: built in 1950 — expect roof / HVAC / electrical / plumbing capex.
- Climate carrying-cost: extreme-heat days projected 7→19/yr by 2055 (HVAC capex compounding) — expect insurance premiums to compound above CPI over the hold.
Questions for the listing agent
- Built in 1950 — when were the roof, HVAC, electrical panel, plumbing, and water heater last replaced?
- Is there a deadline driving the sale (1031 exchange, divorce, estate, relocation)? That informs how much negotiation room exists.
- Schools are F-rated, which usually means shorter tenancies and higher turnover. Who's the typical renter profile here, and what's been the actual vacancy rate?
- Crime grade is F in this area — have there been break-ins, vandalism, or insurance claims at this property in the last 3 years? What carrier currently insures it and at what premium?
- What's the average days-on-market for RENTAL listings here right now (not sales)? A rising rental-DOM trend means longer vacancies and softer asking-rent achievability than the comps imply.
- What's the recent tenant-quality profile in this submarket — average credit score on applications, eviction rate, late-payment / NSF rate, and stable-employment percentage? A property-management company in the area should have these aggregated.
- How much new for-sale + rental construction is in the pipeline within 1–3 miles? Heavy new supply typically softens prices + rents 12–24 months out; constrained supply supports both.
Investment metrics
- 1% rule
- 0.96% ✗
- Cap rate
- 7.84%
- Cash-on-cash
- 5.54%
- DSCR
- 1.25
- GRM
- 8.7
CMA / ARV
- ARV (on-the-fly)
- $159,264
- Comps found
- 12
Show comp detail 12 sales within ~0.75 mi
| Address | Dist | Beds/Ba | Sqft | Sold | Price | $/sf | Match |
|---|---|---|---|---|---|---|---|
| 740 NW 87th St | 0.31mi | 2/2.0 | 974 (-3%) | 2mo | $160,000 | $164 | 74 |
| 705 NW 89th St | 0.20mi | 3/1.0 (+1) | 1,071 (+6%) | 3mo | $150,000 | $140 | 73 |
| 904 Westchester Dr | 0.41mi | 3/1.0 (+1) | 980 (-3%) | 1mo | $155,000 | $158 | 70 |
| 1329 NW 95th St | 0.58mi | 2/1.0 | 982 (-3%) | 2mo | $110,850 | $113 | 67 |
| 728 NW 87th St | 0.32mi | 2/1.0 | 894 (-11%) | 0mo | $135,000 | $151 | 66 |
| 904 NW 88th St | 0.24mi | 3/2.0 (+1) | 1,110 (+10%) | 2mo | $200,000 | $180 | 61 |
| 913 NW 87th St | 0.29mi | 3/2.0 (+1) | 1,099 (+9%) | 2mo | $219,900 | $200 | 61 |
| 1221 NW 83rd St | 0.67mi | 3/1.0 (+1) | 996 (-1%) | 1mo | $161,000 | $162 | 61 |
| 1310 NW 84th St | 0.69mi | 3/1.0 (+1) | 1,024 (+2%) | 1mo | $148,400 | $145 | 60 |
| 340 NW 90th St | 0.47mi | 3/2.0 (+1) | 1,080 (+7%) | 4mo | $197,500 | $183 | 54 |
| 1317 NW 95th St | 0.56mi | 2/1.0 | 1,132 (+12%) | 2mo | $105,000 | $93 | 52 |
| 348 NW 86th St | 0.57mi | 3/1.5 (+1) | 1,088 (+8%) | 3mo | $88,100 | $81 | 51 |
Match score weights: distance 35% · size 25% · config 20% · recency 20%. Top-matched comps best support the ARV.
Projected returns pro-forma
-3.0% appreciation · 3.47% rent growth · sell at horizon
- IRR
- -7.3%
- Equity multiple
- 0.73×
- Total profit
- $-9,422
- Equity at exit
- $18,638
- IRR
- 2.8%
- Equity multiple
- 1.21×
- Total profit
- $7,284
- Equity at exit
- $10,808
Cash invested: $35,000 (down + closing). Projections, not guarantees.
Landlord ↔ Tenant lean methodology
- Overall (STATE)
- 83 Strongly Landlord-Friendly
- State Oklahoma
- 83 Strongly Landlord-Friendly · R+20
- County
- — inherits STATE
- City
- — inherits STATE
ZIP-level market 73114
- Home prices YoY
- -12.5%
- Rents YoY
- 3.5%
- Active inventory
- 145
- Price-to-rent
- 8.7×
Monthly cashflow live
- Estimated rent
- $1,198 high interval (Pro) →
- Mortgage (P&I)
- −$656
- Tax from tax record
- −$77 /mo · $923/yr
- Insurance
- −$52
- HOA
- −$0
- Vacancy / Maint / Mgmt
- −$252
- Net cashflow
- $162
Break-even live
UW: 25.0% down · 7.5% · 30yr · 1.5% tax · 5.0% vac · 8.0% maint · 8.0% mgmt
Financing live
Cash to close
- Down payment
- $31,250
- Closing costs
- $3,750
- Reserves months
- —
- Total cash needed
- —
Loan-product check · same deal, 3 products live
Conventional
25% down · 7.5% · 30yr
- Down + closing
- —
- Monthly P&I
- —
- Monthly cashflow
- —
- DSCR
- —
- Eligible?
- —
Personal DTI + credit; lowest rate.
DSCR
20% down · 8.5% · 30yr
- Down + closing
- —
- Monthly P&I
- —
- Monthly cashflow
- —
- DSCR
- —
- Eligible?
- —
No personal income docs; deal must DSCR.
Hard money
10% down · 12.0% · 12mo
- Down + closing
- —
- Monthly P&I
- —
- Monthly cashflow
- —
- DSCR
- —
- Eligible?
- —
Short-term bridge; refi at stabilization.
Rent comps 40 comps
| Address | Beds | Baths | Sqft | Rent | $/sqft | DOM | Units | Dist |
|---|---|---|---|---|---|---|---|---|
| 745 NW 89th St Oklahoma City, OK | 3.0 | 1.0 | 1000 | $1,275 | $1.27 | 2d | 1 | 0.17mi |
| 9111 N Walker Ave Oklahoma City, OK | 3.0 | 1.5 | 1092 | $1,195 | $1.09 | 2d | 1 | 0.31mi |
| 1000 NW 88th St Oklahoma City, OK | 1.0 | 1.0 | 849 | $745 | $0.88 | 1d | 2 | 0.31mi |
| 1000 NW 88th St Oklahoma City, OK | 1.0 | 1.0 | 850 | $875 | $1.03 | 44d | 4 | 0.31mi |
| 1025 NW 86th St Oklahoma City, OK | 2.0 | 1.5 | 1100 | $1,000 | $0.91 | 44d | 1 | 0.35mi |
| 413 W Britton Rd Oklahoma City, OK | 2.0 | 1.0 | 912 | $840 | $0.92 | 20d | 1 | 0.42mi |
| 413 W Britton Rd Oklahoma City, OK | 2.0 | 1.0 | 912 | $840 | $0.92 | 23d | 1 | 0.42mi |
| 8801 N Walker Ave Unit B Oklahoma City, OK | 3.0 | 2.0 | 1250 | $1,450 | $1.16 | 44d | 1 | 0.43mi |
| 912 NW 98th St Oklahoma City, OK | 3.0 | 1.0 | 1364 | $1,250 | $0.92 | 44d | 1 | 0.45mi |
| 911 NW 98th St Oklahoma City, OK | 3.0 | 1.0 | 1122 | $1,100 | $0.98 | 2d | 1 | 0.47mi |
| 445 NW 86th St Oklahoma City, OK | 3.0 | 2.0 | 1448 | $1,325 | $0.92 | 2d | 1 | 0.47mi |
| 333 NW 90th St Oklahoma City, OK | 3.0 | 1.5 | 1053 | $1,350 | $1.28 | 44d | 1 | 0.48mi |
| 324 NW 89th St Oklahoma City, OK | 3.0 | 1.5 | 1307 | $1,495 | $1.14 | 23d | 1 | 0.53mi |
| 1133 NW 84th St Oklahoma City, OK | 3.0 | 1.0 | 884 | $1,150 | $1.30 | 23d | 1 | 0.56mi |
| 1435 NW 91st St Oklahoma City, OK | 2.0 | 1.5 | 1090 | $1,000 | $0.92 | 44d | 1 | 0.63mi |
| 1434 NW 92nd St Unit 3 Oklahoma City, OK | 2.0 | 1.5 | 950 | $915 | $0.96 | 44d | 1 | 0.64mi |
| 1216 NW 84th St Oklahoma City, OK | 2.0 | 1.5 | 1140 | $900 | $0.79 | 4d | 1 | 0.65mi |
| 1441 NW 92nd St Oklahoma City, OK | 1.0–2.0 | 1.0 | 725 | $850 | $1.17 | 44d | 1 | 0.66mi |
| 1425 NW 94th St Oklahoma City, OK | 2.0 | 1.0 | 816 | $795 | $0.97 | 21d | 1 | 0.66mi |
| 1417 NW 95th St Oklahoma City, OK | 2.0 | 1.0 | 916 | $1,085 | $1.18 | 23d | 1 | 0.66mi |
| 910 NW 101st St Oklahoma City, OK | 3.0 | 1.0 | 1100 | $1,400 | $1.27 | 2d | 1 | 0.67mi |
| 1304 Downing St Oklahoma City, OK | 2.0 | 1.0 | 1345 | $1,395 | $1.04 | 4d | 1 | 0.73mi |
| 1101 NW 103rd St Oklahoma City, OK | 3.0 | 2.0 | 1232 | $1,425 | $1.16 | 2d | 1 | 0.81mi |
| 1214 NW 81st St Oklahoma City, OK | 3.0 | 1.0 | 1100 | $1,350 | $1.23 | 2d | 1 | 0.81mi |
| 1622 W Britton Rd Oklahoma City, OK | 3.0 | 2.0 | 1370 | $1,460 | $1.07 | 21d | 1 | 0.92mi |
| 236 NW 81st St Oklahoma City, OK | 3.0 | 2.0 | 1240 | $1,250 | $1.01 | 23d | 1 | 0.92mi |
| 9721 Georgia Ave Oklahoma City, OK | 3.0 | 2.0 | 1442 | $1,685 | $1.17 | 4d | 1 | 0.94mi |
| 225 NW 80th St Oklahoma City, OK | 3.0 | 1.5 | 1223 | $1,450 | $1.19 | 2d | 1 | 0.97mi |
| 1702 W Britton Rd Oklahoma City, OK | 2.0 | 1.0 | 950 | $1,195 | $1.26 | 2d | 1 | 1.00mi |
| 10735 N Western Ave Unit 10727H Oklahoma City, OK | 2.0 | 2.0 | 935 | $949 | $1.01 | 23d | 1 | 1.04mi |
| 10735 N Western Ave Unit 10743C Oklahoma City, OK | 2.0 | 2.0 | 935 | $949 | $1.01 | 3d | 1 | 1.04mi |
| 10735 N Western Ave Oklahoma City, OK | 1.0 | 1.0 | 740 | $799 | $1.08 | 23d | 1 | 1.04mi |
| 10735 N Western Ave Oklahoma City, OK | 1.0 | 1.0 | 740 | $799 | $1.08 | 20d | 1 | 1.04mi |
| 10735 N Western Ave Oklahoma City, OK | 1.0–3.0 | 1.0–2.5 | 995 | $974 | $0.98 | 44d | 64 | 1.04mi |
| 10735 N Western Ave Oklahoma City, OK | 3.0 | 2.5 | 1250 | $1,149 | $0.92 | 21d | 1 | 1.04mi |
| 8500 N Oklahoma Ave Oklahoma City, OK | 3.0 | 1.0–2.0 | 954 | $2,039 | $2.14 | 1d | 23 | 1.10mi |
| 10517 N McKinley Ave Oklahoma City, OK | 3.0 | 1.5 | 1219 | $1,695 | $1.39 | 4d | 1 | 1.14mi |
| 1720 Castle St Oklahoma City, OK | 3.0 | 2.0 | 1428 | $1,800 | $1.26 | 44d | 1 | 1.15mi |
| 1618 Oxford Way Oklahoma City, OK | 3.0 | 1.0 | 1039 | $1,350 | $1.30 | 23d | 1 | 1.15mi |
| 10104 Haverhill Pl Oklahoma City, OK | 3.0 | 2.0 | 1188 | $1,550 | $1.30 | 14d | 1 | 1.17mi |
Listing history 6 events
-
2026-06-02statusdays on market $125,000 Pending 14 DOM
-
2026-06-01days on market $125,000 Active 13 DOM
-
2026-05-31days on market $125,000 Active 12 DOM
-
2026-05-19$125,000 Active
-
2021-03-01soldstatus $60,000
-
1994-05-19soldstatus $12,000
ⓘ Source: listings_history table (triggers on properties + properties_extension) + one-shot
backfill from property_details.listing_events for pre-trigger history.
Tax reassessment forecast OK · Resets to sale price
- Current annual tax
- $923 · $77/mo
- Projected year-2 tax
- $1,125 · $94/mo
- Expected delta
- +$202/yr (+$17/mo · 21.9%)
ⓘ Screening estimate from a state-policy table — verify with the county assessor before closing.
Climate risk First Street
- Flood 1/10 Low FEMA zone X (unshaded) · 0% chance over 30 yrs
- Wildfire 3/10 Moderate
- Heat 6/10 Major 7 d/yr ≥107°F today · 19 d/yr by 30 yrs out
- Wind 2/10 Low 2% chance of damaging wind over 30 yrs
- Air quality 2/10 Low 2 unhealthy d/yr today · 2 by 30 yrs out
Nearby sold comps map
Loading sold comps map…
Walkable amenities ~0.75 mi
Loading nearby amenities…
Taxation est. · year 1
- Rental income
- $14,372
- − Mortgage interest
- −$7,002
- − Property taxes
- −$923
- − Insurance
- −$625
- − Repairs & maintenance
- −$1,150
- − Management
- −$1,150
- − Depreciation
- −$3,636
- Taxable loss
- −$114
- Est. tax savings @ 24.0%
- +$27
- After-tax cash flow
- $1,967/yr
For passive investors: Depreciation is non-cash, so a rental often shows a tax loss while cash-flowing — sheltering income. Rental losses are passive: they offset passive income freely, and up to $25,000/yr can offset ordinary (W-2) income if you actively participate and your MAGI is under $100k (phasing out to $0 by $150k); unused losses carry forward. On sale, claimed depreciation is recaptured at up to 25%, and gains may owe capital-gains tax (a 1031 exchange can defer both). Figures are a year-1 estimate at your 24.0% rate — not tax advice; consult a CPA.
Schools (NCES district)
- District
- Oklahoma City
- NCES district ID
- 4022770
- Math proficiency
- 7% ▼ -5.00%
- Reading proficiency
- 10% ▼ -6.00%
- Median HH income
- $35,606
- Composite
- 7.0/100
- National rank
- #9970
- State rank
- #254 of 270 in OK
Livability — Oklahoma City
- Score
- 80/100
- State rank
- #3
- US rank
- #1635
Category grades
Schools grade is shown separately in the Schools card above.
Census & demographics
- Census place
- Oklahoma City, OK
- County
- Oklahoma County · 771,644 people
- City population
- 498,656
- Metro
- Oklahoma City, OK
- Population (ZIP)
- 17,656
- Household income
- $54,936
- Rent vs Own
- Severe rent burden
- 1035.0
Population outlook (Oklahoma County) Hauer SSP2
- Today (2025)
- 911,875 people
- By 2030
- 982,413 · +7.7%
- By 2040
- 1,130,468 · +24.0%
- By 2050
- 1,288,422 · +41.3%
- By 2075
- 1,711,482 · +87.7%
- By 2100
- 2,088,448 · +129.0%
Race, ethnicity, and origin ACS 2023
- Neighborhood character
- Highly diverse neighborhood (Simpson 0.71)
- Race & ethnicity
- Black 41% White 29% Hispanic / Latino 20% Two or more races 12% Native American 3%
- Hispanic origin (detail)
- Mexican 16% Puerto Rican 1%
- Common ancestry
- Russian 1% Slovak 1% Italian 1%
- Foreign-born
- 12% · Canada, Jamaica
- Languages at home
- 78% English-only · Spanish 18%
Political lean MEDSL · Oklahoma
- 2024 margin
- Toss-up / Even · D 48.0% · R 49.7% · Other 2.3%
- 2008→2024 swing
- +15.1pp toward D · 2008: -16.8pp · 2024: -1.7pp
- All cycles
- 2024: R+1.7 2020: R+1.1 2016: R+10.5 2012: R+16.7 2008: R+16.8
Not yet ingested
- Civics
- —
Market trends
- HPI YoY
- ▼ -44.26%
- Current HPI
- 310.4705
- Rent YoY
- ▲ 3.47%
- Metro
- Oklahoma City, OK
- State GDP YoY
- ▲ 1.55%
- F500 in state
- 6
Industry mix (Fortune 500 HQ in OK)
| Industry | F500 HQs | Revenue |
|---|---|---|
| Energy | 3 | $48B |
|
||
Price history
+941.7% since first listed3 events — show timeline
- 2026-05-19 Listed $125,000 MLSOK
- 2021-03-01 Sold (Public Records) $60,000 Public Records
- 1994-05-19 Sold (Public Records) $12,000 Public Records
Property tax history
+8.1%/yrLatest (2025): $923 · +4.2% YoY. Source: county tax records.
Cash-flow waterfall
monthlySold comps — $/sqft
last 12 mo · ≤1 miLoading sold comps…