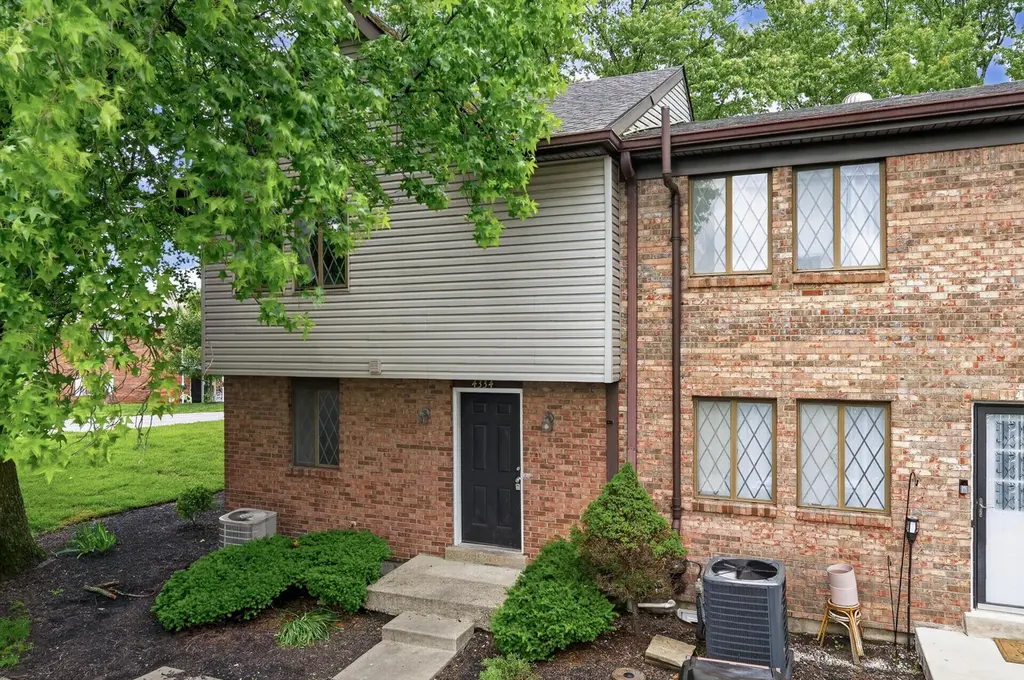
4334 Cobblewood Ct · Independence, KY
Flood risk 1/10 · Minimal
- FEMA flood zone
- X (unshaded)
- Chance of flooding over 30 yrs
- 0.0%
- Est. flood insurance / yr
- $507 – $1,088
Fire risk 2/10 · Minimal
- Est. fire insurance / yr
- $839 – $1,559
Heat risk 4/10 · Minor
- Hot days now (above 102°F)
- 7 days/yr
- Hot days in 30 yrs
- 19 days/yr
Wind risk 2/10 · Minimal
- Chance of severe wind over 30 yrs
- 1.0%
Air-quality risk 2/10 · Minimal
- Unhealthy air days now
- 1 days/yr
- Unhealthy air days in 30 yrs
- 3 days/yr
Risk factors via First Street. Map © Google.
Why this score? — see what drove the B- grade
The composite is a weighted blend of 9 inputs, each scored 0–100. Each bar is that input's sub-score; the figure is the points it added to the 100-point composite (weight × sub-score).
- Cash flow +27.0/30.0
- DSCR +9.3/10.0
- 1% rule +8.9/10.0
- ARV discount +7.5/15.0
- Schools +4.0/10.0
- Rent growth +3.8/5.0
- Livability +3.6/5.0
- Condition / age +2.5/5.0
- Appreciation +0.0/10.0
$165,000
🖨 Deal sheet (PDF) 📄 Offer letter ✓ Due diligence
Listing remarks MLS
This home was sold when submitted to the Northern Kentucky MLS.
Key facts
- Finished lower level
- Clubhouse with pool
- $297 HOA
Tags
Property features AI
Finance
- HOA & community: Monthly association with landscaping, pool and clubhouse (monthly fee applies)
Exterior
- Parking: Assigned parking
- Utilities: Public water; Public sewer; Cable available
- Home design: Townhouse; Two levels; Existing structure
- Construction: Aluminum siding and brick exterior; Shingle roof; Poured concrete foundation
- Exterior features: Patio; Privacy fencing
Interior
- Kitchen: Electric oven and range; Dishwasher; Microwave; Refrigerator
- Bedrooms: Primary bedroom (14 x 12); Bedroom 2 (11 x 9); Bedroom 3 (13 x 9)
- Bathrooms: 1 full bathroom; 1 half bathroom
- Heating & cooling: Electric heating; Central air conditioning
- Interior features: In-basement laundry; Electric oven, Electric range, Dishwasher, Microwave, Refrigerator
- Laundry & utility: Laundry in basement
Neighborhood map
What this means for you Summary
Snapshot
- This is a 3-bed/1.5-bath other listed at $165k.
Deal economics
- At list price, monthly cash flow is $461 ($6k/yr) — positive.
- The deal already cash-flows at list — no discount required.
- Meets the 1% rule at list price ($2k rent vs $165k).
- Cap rate 9.6% vs local median 3.7% in Independence — top-decile yield for the area; either an underpriced asset or a hidden risk that comps aren't pricing in. Stress-test before assuming the spread holds.
Location & tenants
- Location reads 72/100 on livability (#130 in KY) — a middle-class / working-renter tenant base. Strengths: crime A+, employment A+, cost of living A+; Watch: amenities F, commute F, health & safety F.
- Kenton County (suburban): math 42% / reading 48% proficiency, ranked #14 of 165 in KY (top 8%) — families likely to look elsewhere, expect single-tenant / working-renter base with shorter leases.
- Zoned schools: Beechgrove Elementary School (math 41% / reading 42%, grade F, #197 of 676 statewide, top 29%, 660 students, 61% FRL); Woodland Middle School (math 38% / reading 50%, grade D, #40 of 217 statewide, top 19%, 616 students, 48% FRL); Simon Kenton High School (math 40% / reading 44%, grade F, #32 of 254 statewide, top 13%, 1,859 students, 37% FRL) — zoned schools average 49% FRL vs 33% district-wide (15 pts higher); higher-poverty schools than district average — tighter screening recommended.
- Market conditions: Rents rising fast (+5.4%/yr); 257 active listings in the ZIP; 3 comparable units currently listed for rent nearby; rentals at typical pace (median 25d on market — plan ~3-4 weeks tenant-placement turnaround); solid renter incomes; 699 units permitted in Kenton County in 2024 (287 in 5+ unit buildings).
Forward outlook
- Local home prices are declining (-3.0%/yr); year-one equity from $1k of loan paydown is wiped out by about $5k of value loss. Plan a longer hold.
- Kenton County population projected at +5% by 2050 — modest demand growth; plan on rents tracking national, not racing it.
- At projected returns (-3.0% appreciation + 5.4% rent growth), your $46k cash investment doubles in ~8 years — after that, you're playing with house money.
Negotiation context
- Only 4 days on market — expect competitive offers; lowballing is unlikely to land.
- 10 sale attempts since 22y ago with the ask held roughly flat each time — persistent listings suggest the price (not the market) is what's stuck; bring a comps-based counter.
- Current owner paid $100k; list at $165k implies a 65% gain — meaningful room to come down on a strong offer.
Questions for the listing agent
- What does the HOA fee cover, when was the last increase, and are there any pending special assessments or reserve-fund shortfalls?
- Is there a deadline driving the sale (1031 exchange, divorce, estate, relocation)? That informs how much negotiation room exists.
- Schools are B-rated — typically a magnet for longer-tenancy family renters. What's the average tenant stay here, and is there a school-zone premium baked into asking?
- What's the average days-on-market for RENTAL listings here right now (not sales)? A rising rental-DOM trend means longer vacancies and softer asking-rent achievability than the comps imply.
- What's the recent tenant-quality profile in this submarket — average credit score on applications, eviction rate, late-payment / NSF rate, and stable-employment percentage? A property-management company in the area should have these aggregated.
- How much new for-sale + rental construction is in the pipeline within 1–3 miles? Heavy new supply typically softens prices + rents 12–24 months out; constrained supply supports both.
Investment metrics
- 1% rule
- 1.39% ✓
- Cap rate
- 9.65%
- Cash-on-cash
- 11.98%
- DSCR
- 1.53
- GRM
- 6.0
CMA / ARV
No comps found within radius.
Projected returns pro-forma
-3.0% appreciation · 5.37% rent growth · sell at horizon
- IRR
- 4.6%
- Equity multiple
- 1.18×
- Total profit
- $8,395
- Equity at exit
- $24,602
- IRR
- 16.4%
- Equity multiple
- 2.51×
- Total profit
- $69,912
- Equity at exit
- $14,266
Cash invested: $46,200 (down + closing). Projections, not guarantees.
Landlord ↔ Tenant lean methodology
- Overall (STATE)
- 83 Strongly Landlord-Friendly
- State Kentucky
- 83 Strongly Landlord-Friendly · R+16
- County
- — inherits STATE
- City
- — inherits STATE
ZIP-level market 41051
- Home prices YoY
- -32.6%
- Rents YoY
- 5.4%
- Active inventory
- 257
- Price-to-rent
- 6.0×
Monthly cashflow live
- Estimated rent
- $2,294 medium interval (Pro) →
- Mortgage (P&I)
- −$865
- Tax from tax record
- −$120 /mo · $1,438/yr
- Insurance
- −$69
- HOA
- −$297
- Vacancy / Maint / Mgmt
- −$482
- Net cashflow
- $461
Break-even live
Sensitivity live
| Price | -10% $555 | -5% $508 | +0% $461 | +5% $414 | +10% $368 |
|---|---|---|---|---|---|
| Rent | -10% $280 | -5% $371 | +0% $461 | +5% $552 | +10% $642 |
| Rate | -1.0pp $544 | -0.5pp $503 | base $461 | +0.5pp $418 | +1.0pp $375 |
UW: 25.0% down · 7.5% · 30yr · 1.5% tax · 5.0% vac · 8.0% maint · 8.0% mgmt
Financing live
Cash to close
- Down payment
- $41,250
- Closing costs
- $4,950
- Reserves months
- —
- Total cash needed
- —
Loan-product check · same deal, 3 products live
Conventional
25% down · 7.5% · 30yr
- Down + closing
- —
- Monthly P&I
- —
- Monthly cashflow
- —
- DSCR
- —
- Eligible?
- —
Personal DTI + credit; lowest rate.
DSCR
20% down · 8.5% · 30yr
- Down + closing
- —
- Monthly P&I
- —
- Monthly cashflow
- —
- DSCR
- —
- Eligible?
- —
No personal income docs; deal must DSCR.
Hard money
10% down · 12.0% · 12mo
- Down + closing
- —
- Monthly P&I
- —
- Monthly cashflow
- —
- DSCR
- —
- Eligible?
- —
Short-term bridge; refi at stabilization.
Rent comps 3 comps
| Address | Beds | Baths | Sqft | Rent | $/sqft | DOM | Units | Dist |
|---|---|---|---|---|---|---|---|---|
| 1047 Alpine Ct Independence, KY | 3.0 | 2.0 | 1035 | $2,400 | $2.32 | 25d | 1 | 0.19mi |
| 9552 Apple Valley Dr Independence, KY | 2.0 | 2.0 | 1100 | $1,456 | $1.32 | 3d | 6 | 0.38mi |
| 3924 Trappers Ct Florence, KY | 3.0 | 1.5 | 1384 | $2,380 | $1.72 | 45d | 1 | 0.50mi |
HOA detail
- Monthly dues
- $297 · $3,564/yr
Listing history 3 events
-
2026-06-08status $165,000 Pending 4 DOM
-
2026-06-07remarks 240-char remark
-
2026-06-07$165,000 Active 4 DOM
ⓘ Source: listings_history table (triggers on properties + properties_extension) + one-shot
backfill from property_details.listing_events for pre-trigger history.
Tax reassessment forecast KY · Resets to sale price
- Current annual tax
- $1,438 · $120/mo
- Projected year-2 tax
- $1,438 · $120/mo
- Expected delta
- $0/yr ($0/mo · 0.0%)
ⓘ Screening estimate from a state-policy table — verify with the county assessor before closing.
Climate risk First Street
- Flood 1/10 Low FEMA zone X (unshaded) · 0% chance over 30 yrs
- Wildfire 2/10 Low
- Heat 4/10 Moderate 7 d/yr ≥102°F today · 19 d/yr by 30 yrs out
- Wind 2/10 Low 100% chance of damaging wind over 30 yrs
- Air quality 2/10 Low 1 unhealthy d/yr today · 3 by 30 yrs out
Nearby sold comps map
Loading sold comps map…
Walkable amenities ~0.75 mi
Loading nearby amenities…
Taxation est. · year 1
- Rental income
- $27,524
- − Mortgage interest
- −$9,243
- − Property taxes
- −$1,438
- − Insurance
- −$825
- − Repairs & maintenance
- −$2,202
- − Management
- −$2,202
- − HOA
- −$3,564
- − Depreciation
- −$4,800
- Taxable income
- $3,251
- Est. tax owed @ 24.0%
- −$780
- After-tax cash flow
- $4,753/yr
For passive investors: Depreciation is non-cash, so a rental often shows a tax loss while cash-flowing — sheltering income. Rental losses are passive: they offset passive income freely, and up to $25,000/yr can offset ordinary (W-2) income if you actively participate and your MAGI is under $100k (phasing out to $0 by $150k); unused losses carry forward. On sale, claimed depreciation is recaptured at up to 25%, and gains may owe capital-gains tax (a 1031 exchange can defer both). Figures are a year-1 estimate at your 24.0% rate — not tax advice; consult a CPA.
Schools (NCES district)
- District
- Kenton County
- NCES district ID
- 2103090
- Math proficiency
- 42% ▼ -13.00%
- Reading proficiency
- 48% ▼ -14.00%
- Median HH income
- $66,183
- Composite
- 40.17/100
- National rank
- #3789
- State rank
- #14 of 165 in KY
Livability — Independence
- Score
- 72/100
- State rank
- #130
- US rank
- #6165
Category grades
Schools grade is shown separately in the Schools card above.
Census & demographics
- Census place
- Independence, KY
- County
- Kenton County · 142,881 people
- City population
- 33,054
- Metro
- Cincinnati, OH-KY-IN
- Population (ZIP)
- 33,054
- Household income
- $104,201
- Rent vs Own
- Severe rent burden
- 243.0
Population outlook (Kenton County) Hauer SSP2
- Today (2025)
- 174,205 people
- By 2030
- 177,897 · +2.1%
- By 2040
- 182,671 · +4.9%
- By 2050
- 183,543 · +5.4%
- By 2075
- 178,977 · +2.7%
- By 2100
- 159,920 · -8.2%
Race, ethnicity, and origin ACS 2023
- Neighborhood character
- Predominantly White (93%)
- Race & ethnicity
- White 93% Two or more races 3% Hispanic / Latino 2% Black 1% Asian 1%
- Common ancestry
- Italian 3% Lithuanian 3% Slovak 2%
- Foreign-born
- 3% · China, Canada
- Languages at home
- 96% English-only · Spanish 1% Chinese 1% Other Asian/Pacific 1%
Political lean MEDSL · Kenton
- 2024 margin
- Strong R (+21.7) · D 38.2% · R 59.9% · Other 1.9%
- 2008→2024 swing
- -0.9pp no change · 2008: -20.9pp · 2024: -21.7pp
- All cycles
- 2024: R+21.7 2020: R+19.3 2016: R+26.1 2012: R+24.3 2008: R+20.9
Not yet ingested
- Civics
- —
Market trends
- HPI YoY
- ▼ -105.60%
- Current HPI
- 218.492
- Rent YoY
- ▲ 5.37%
- Metro
- Cincinnati, OH-KY-IN
- State GDP YoY
- ▲ 1.81%
- F500 in state
- 4
Industry mix (Fortune 500 HQ in KY)
| Industry | F500 HQs | Revenue |
|---|---|---|
| Healthcare | 1 | $118B |
|
||
| Food / Beverage | 1 | $7B |
|
||
Price history
+292.9% since first listed28 events — show timeline
- 2026-06-03 Listed $165,000 NKMLS
- 2022-09-02 Pending — NKMLS
- 2022-08-15 Sold (Public Records) $100,000 Public Records
- 2022-08-11 Sold (MLS) $100,000 NKMLS
- 2022-07-29 Listed $100,000 NKMLS
- 2016-11-07 Sold (Public Records) $83,000 Public Records
- 2016-10-31 Sold (MLS) $83,000 NKMLS
- 2016-10-31 Sold (MLS) $83,000 Metro Search MLS
- 2016-07-26 Listed $83,000 NKMLS
- 2016-07-26 Listed $83,000 Metro Search MLS
- 2016-07-25 Listing Removed — NKMLS
- 2016-07-25 Listing Removed — Metro Search MLS
- 2016-06-30 Listed $85,000 NKMLS
- 2016-06-30 Listed $85,000 Metro Search MLS
- 2010-02-11 Sold (Public Records) $79,900 Public Records
- 2010-02-05 Sold (MLS) $79,900 NKMLS
- 2009-12-10 Listed $79,900 NKMLS
- 2009-10-07 Sold (MLS) $55,000 NKMLS
- 2009-08-27 Listed $59,000 NKMLS
- 2005-08-11 Sold (Public Records) $88,000 Public Records
- 2005-08-05 Sold (MLS) $88,000 NKMLS
- 2005-05-08 Listed $95,000 NKMLS
- 2005-01-05 Sold (Public Records) $85,000 Public Records
- 2004-12-30 Sold (MLS) $85,000 NKMLS
- 2004-09-07 Listed $87,900 NKMLS
- 2002-04-12 Sold (Public Records) $71,000 Public Records
- 1990-09-18 Sold (Public Records) $44,500 Public Records
- 1988-09-30 Sold (Public Records) $42,000 Public Records
Property tax history
+3.0%/yrLatest (2025): $1,438 · +13.2% YoY. Source: county tax records.
Cash-flow waterfall
monthlySold comps — $/sqft
last 12 mo · ≤1 miLoading sold comps…