 Multi-family
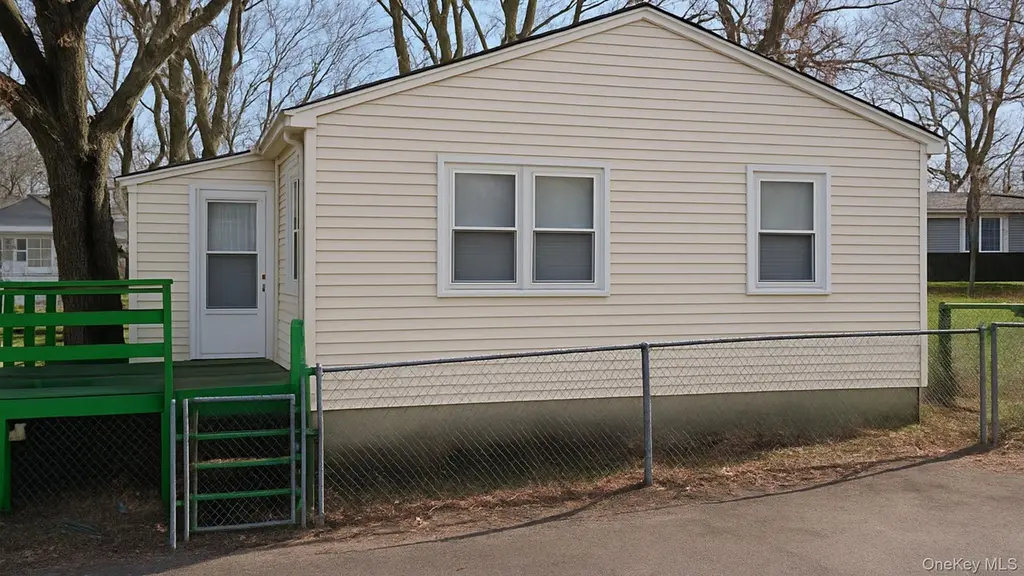
56 Woodcliff Trl · Baiting Hollow, NY
Flood risk 1/10 · Minimal
- FEMA flood zone
- X (unshaded)
- Chance of flooding over 30 yrs
- 0.0%
- Est. flood insurance / yr
- $507 – $1,088
Fire risk 2/10 · Minimal
- Est. fire insurance / yr
- $691 – $1,283
Heat risk 4/10 · Minor
- Hot days now (above 93°F)
- 6 days/yr
- Hot days in 30 yrs
- 15 days/yr
Wind risk 8/10 · Major
- Chance of severe wind over 30 yrs
- 80.0%
Air-quality risk 3/10 · Minor
- Unhealthy air days now
- 2 days/yr
- Unhealthy air days in 30 yrs
- 3 days/yr
Risk factors via First Street. Map © Google.
Why this score? — see what drove the C grade
The composite is a weighted blend of 9 inputs, each scored 0–100. Each bar is that input's sub-score; the figure is the points it added to the 100-point composite (weight × sub-score).
- Cash flow +15.0/30.0
- ARV discount +15.0/15.0
- Appreciation +6.6/10.0
- 1% rule +5.0/10.0
- DSCR +5.0/10.0
- Schools +3.6/10.0
- Livability +3.0/5.0
- Rent growth +2.5/5.0
- Condition / age +2.5/5.0
$79,999
🖨 Deal sheet (PDF) 📄 Offer letter ✓ Due diligence
Multi-family units
County records classify this as Multi-Family (2-4 Unit). Listing-text estimate: 1 unit. estimate disagrees with records
Listing remarks MLS
Enjoy the best of East End living in this charming seasonal duplex cottage nestled within the Woodcliff Park community. Available from April 15th through October 15th, this retreat offers a spacious deck perfect for morning coffee, summer gatherings, and relaxing evenings. Land is leased. Ideally located just minutes from beaches, dining, wineries, and all the coastal attractions Long Island’s East End is known for—your perfect seasonal escape awaits. Cash Only Sales
Key facts
- Minutes from beaches
- Spacious deck
- Coastal attractions
Tags
Neighborhood map
What this means for you Summary
Snapshot
- This is a 5-bed/2.0-bath multifamily listed at $80k.
Deal economics
- At list price, monthly cash flow is $3k ($34k/yr) — positive.
- The deal already cash-flows at list — no discount required.
- Meets the 1% rule at list price ($4k rent vs $80k).
- Recommended offer: $70k (12.0% below list) — sets the bar for market timing.
- Cap rate 48.7% vs local median 5.3% in Baiting Hollow — top-decile yield for the area; either an underpriced asset or a hidden risk that comps aren't pricing in. Stress-test before assuming the spread holds.
Location & tenants
- Location reads 60/100 on livability (#953 in NY) — a middle-class / working-renter tenant base. Strengths: crime A+, employment A+, housing A+; Watch: schools D, amenities F, commute F.
- Riverhead Central School District (suburban): math 34% / reading 48% proficiency, ranked #489 of 590 in NY (top 83%) — families likely to look elsewhere, expect single-tenant / working-renter base with shorter leases.
- Market conditions: 85 active listings in the ZIP; 1,366 units permitted in Suffolk County in 2024 (216 in 5+ unit buildings).
Forward outlook
- In year one you build about $3k of equity ($553 loan paydown + $3k appreciation (3.3% local appreciation)).
- Suffolk County population projected to shrink 5% by 2050 — rents likely to lag national; underwrite the cash flow, not the appreciation.
- At projected returns (3.3% appreciation + 3.0% rent growth), your $22k cash investment doubles in ~1 year — after that, you're playing with house money.
- By year 10, paydown + projected appreciation supports a ~$31k cash-out refi (75% LTV) — recoverable capital for the next deal without selling this one.
Negotiation context
- It's been on market 170 days — a 12% lower offer ($70k) is reasonable based on typical stale-listing flexibility.
- 6 sale attempts since 6y ago; this cycle's ask has dropped $19k (19%) from the opening price — seller is motivated, your offer sets the floor, not the list.
Risks & watch-outs
- Watch-outs: property tax is 3.4% of price; built in 1950 — expect roof / HVAC / electrical / plumbing capex.
- Climate carrying-cost: severe wind risk, 80% chance of damaging wind over 30y — expect insurance premiums to compound above CPI over the hold.
Questions for the listing agent
- It's been on market 170 days. Have you received any prior offers? Is the seller open to a 12% concession, seller financing, or rate buy-down credit?
- Built in 1950 — when were the roof, HVAC, electrical panel, plumbing, and water heater last replaced?
- Property tax is high relative to price — has the assessment been appealed recently, and will the sale trigger a re-assessment?
- Why hasn't it sold? Are there any deal-killer items the seller is aware of (foundation, flood, title, zoning, code violations)?
- Is there a deadline driving the sale (1031 exchange, divorce, estate, relocation)? That informs how much negotiation room exists.
- Schools are D-rated, which usually means shorter tenancies and higher turnover. Who's the typical renter profile here, and what's been the actual vacancy rate?
- What's the average days-on-market for RENTAL listings here right now (not sales)? A rising rental-DOM trend means longer vacancies and softer asking-rent achievability than the comps imply.
- What's the recent tenant-quality profile in this submarket — average credit score on applications, eviction rate, late-payment / NSF rate, and stable-employment percentage? A property-management company in the area should have these aggregated.
- How much new apartment / multifamily construction is in the pipeline within 1–3 miles? Heavy new supply (>2% of stock underway) typically softens rents 12–24 months out; light construction supports rent growth.
Investment metrics
- 1% rule
- 5.54% ✓
- Cap rate
- 48.69%
- Cash-on-cash
- 151.42%
- DSCR
- 7.74
- GRM
- 1.5
CMA / ARV
- ARV (median comp)
- $144,800
- List price
- $79,999
- Delta
- -44.75%
- Verdict
- UNDERPRICED
- Comps
- 18 within 1.0 mi
Projected returns pro-forma
3.26% appreciation · 3.0% rent growth · sell at horizon
- IRR
- —
- Equity multiple
- 9.52×
- Total profit
- $190,902
- Equity at exit
- $37,146
- IRR
- —
- Equity multiple
- 20.03×
- Total profit
- $426,161
- Equity at exit
- $58,177
Cash invested: $22,400 (down + closing). Projections, not guarantees.
Landlord ↔ Tenant lean methodology
- Overall (STATE)
- 15 Strongly Tenant-Friendly
- State New York
- 15 Strongly Tenant-Friendly · D+10
- County
- — inherits STATE
- City
- — inherits STATE
ZIP-level market 11933
- Home prices YoY
- 0.8%
- Active inventory
- 85
- Price-to-rent
- 1.5×
Monthly cashflow live
- Estimated rent
- $4,435 medium interval (Pro) →
- Mortgage (P&I)
- −$420
- Tax from tax record
- −$224 /mo · $2,689/yr
- Insurance
- −$33
- HOA
- −$0
- Vacancy / Maint / Mgmt
- −$931
- Net cashflow
- $2,826
Break-even live
Sensitivity live
| Price | -10% $2,872 | -5% $2,849 | +0% $2,826 | +5% $2,804 | +10% $2,781 |
|---|---|---|---|---|---|
| Rent | -10% $2,476 | -5% $2,651 | +0% $2,826 | +5% $3,002 | +10% $3,177 |
| Rate | -1.0pp $2,867 | -0.5pp $2,847 | base $2,826 | +0.5pp $2,806 | +1.0pp $2,785 |
UW: 25.0% down · 7.5% · 30yr · 1.5% tax · 5.0% vac · 8.0% maint · 8.0% mgmt
Financing live
Cash to close
- Down payment
- $20,000
- Closing costs
- $2,400
- Reserves months
- —
- Total cash needed
- —
Loan-product check · same deal, 3 products live
Conventional
25% down · 7.5% · 30yr
- Down + closing
- —
- Monthly P&I
- —
- Monthly cashflow
- —
- DSCR
- —
- Eligible?
- —
Personal DTI + credit; lowest rate.
DSCR
20% down · 8.5% · 30yr
- Down + closing
- —
- Monthly P&I
- —
- Monthly cashflow
- —
- DSCR
- —
- Eligible?
- —
No personal income docs; deal must DSCR.
Hard money
10% down · 12.0% · 12mo
- Down + closing
- —
- Monthly P&I
- —
- Monthly cashflow
- —
- DSCR
- —
- Eligible?
- —
Short-term bridge; refi at stabilization.
Listing history 30 events
-
2026-06-21days on market $79,999 Active 170 DOM
-
2026-06-18days on market $79,999 Active 167 DOM
-
2026-06-17pricedays on market $79,999 Active 166 DOM
-
2026-06-16days on market $99,000 Active 165 DOM
-
2026-06-15days on market $99,000 Active 164 DOM
-
2026-06-13days on market $99,000 Active 162 DOM
-
2026-06-09days on market $99,000 Active 158 DOM
-
2026-06-08days on market $99,000 Active 157 DOM
-
2026-06-07days on market $99,000 Active 156 DOM
-
2026-06-04days on market $99,000 Active 153 DOM
-
2026-06-03days on market $99,000 Active 152 DOM
-
2026-06-02days on market $99,000 Active 151 DOM
-
2026-06-01days on market $99,000 Active 150 DOM
-
2026-05-31days on market $99,000 Active 149 DOM
-
2026-01-02$99,000 Active 483-char remark
Show marketing remark (483 chars)
Enjoy the best of East End living in this charming seasonal duplex cottage nestled within the Woodcliff Park community. Available from April 15th through October 15th, this retreat offers a spacious deck perfect for morning coffee, summer gatherings, and relaxing evenings. Land is leased. Ideally located just minutes from beaches, dining, wineries, and all the coastal attractions Long Island’s East End is known for—your perfect seasonal escape awaits. Cash Only Sales
-
2025-12-29historical
-
2025-11-03status Active
-
2025-11-01historical
-
2025-09-28price $99,000
-
2025-05-30price $115,000
-
2024-10-02price $125,000
-
2024-10-02$120,000 Active
-
2024-10-02historical
-
2021-08-27soldstatus $70,000 Closed
-
2021-08-06status Active
-
2021-08-05historical
-
2021-07-02status Active
-
2021-07-01historical
-
2021-06-23price $85,000
-
2020-07-02$94,990 Active
ⓘ Source: listings_history table (triggers on properties + properties_extension) + one-shot
backfill from property_details.listing_events for pre-trigger history.
Tax reassessment forecast NY · Partial reset (capped growth)
- Current annual tax
- $2,689 · $224/mo
- Projected year-2 tax
- $2,689 · $224/mo
- Expected delta
- $0/yr ($0/mo · 0.0%)
ⓘ Screening estimate from a state-policy table — verify with the county assessor before closing.
Climate risk First Street
- Flood 1/10 Low FEMA zone X (unshaded) · 0% chance over 30 yrs
- Wildfire 2/10 Low
- Heat 4/10 Moderate 6 d/yr ≥93°F today · 15 d/yr by 30 yrs out
- Wind 8/10 Severe 80% chance of damaging wind over 30 yrs
- Air quality 3/10 Moderate 2 unhealthy d/yr today · 3 by 30 yrs out
Nearby sold comps map
Loading sold comps map…
Walkable amenities ~0.75 mi
Loading nearby amenities…
Taxation est. · year 1
- Rental income
- $53,216
- − Mortgage interest
- −$4,481
- − Property taxes
- −$2,689
- − Insurance
- −$400
- − Repairs & maintenance
- −$4,257
- − Management
- −$4,257
- − Depreciation
- −$2,327
- Taxable income
- $34,804
- Est. tax owed @ 24.0%
- −$8,353
- After-tax cash flow
- $25,564/yr
For passive investors: Depreciation is non-cash, so a rental often shows a tax loss while cash-flowing — sheltering income. Rental losses are passive: they offset passive income freely, and up to $25,000/yr can offset ordinary (W-2) income if you actively participate and your MAGI is under $100k (phasing out to $0 by $150k); unused losses carry forward. On sale, claimed depreciation is recaptured at up to 25%, and gains may owe capital-gains tax (a 1031 exchange can defer both). Figures are a year-1 estimate at your 24.0% rate — not tax advice; consult a CPA.
Schools (NCES district)
- District
- Riverhead Central School District
- NCES district ID
- 3624690
- Math proficiency
- 34% ▼ -4.00%
- Reading proficiency
- 48% ▲ 13.00%
- Median HH income
- $61,607
- Composite
- 36.38/100
- National rank
- #4683
- State rank
- #489 of 590 in NY
Livability — Baiting Hollow
- Score
- 60/100
- State rank
- #953
- US rank
- #18639
Category grades
Schools grade is shown separately in the Schools card above.
Census & demographics
- Census place
- Baiting Hollow, NY
- Population (ZIP)
- 6,784
Population outlook (Suffolk County) Hauer SSP2
- Today (2025)
- 1,505,262 people
- By 2030
- 1,498,318 · -0.5%
- By 2040
- 1,471,101 · -2.3%
- By 2050
- 1,424,848 · -5.3%
- By 2075
- 1,337,157 · -11.2%
- By 2100
- 1,217,720 · -19.1%
Race, ethnicity, and origin ACS 2023
- Neighborhood character
- Predominantly White (79%)
- Race & ethnicity
- White 79% Hispanic / Latino 10% Black 8% Two or more races 2% Asian 1%
- Hispanic origin (detail)
- Puerto Rican 1% Dominican 4%
- Common ancestry
- Romanian 5% Lithuanian 3% Iranian 1%
- Foreign-born
- 11% · Canada, Jamaica, South Korea
- Languages at home
- 85% English-only · Spanish 10% Other Indo-European 3% German/W. Germanic 1%
Political lean MEDSL · Suffolk
- 2024 margin
- Lean R (+10.0) · D 45.0% · R 55.0%
- 2008→2024 swing
- -16.0pp toward R · 2008: 6.0pp · 2024: -10.0pp
- All cycles
- 2024: R+10.0 2020: R+0.0 2016: R+8.2 2012: D+2.9 2008: D+6.0
Not yet ingested
- Civics
- —
Market trends
- HPI YoY
- ▲ 3.26%
- Current HPI
- 397.7148
- Rent YoY
- —
- Metro
- —
- State GDP YoY
- ▲ 2.60%
- F500 in state
- 92
Industry mix (Fortune 500 HQ in NY)
| Industry | F500 HQs | Revenue |
|---|---|---|
| Financial Services | 10 | $950B |
|
||
| Consumer Goods | 9 | $162B |
|
||
| Insurance | 4 | $225B |
|
||
| Telecommunications | 2 | $144B |
|
||
| Pharmaceuticals | 2 | $112B |
|
||
| Media / Entertainment | 2 | $69B |
|
||
Price history
+4.2% since first listed16 events — show timeline
- 2026-01-02 Listed $99,000 OneKey® MLS as Distributed by MLS Grid
- 2025-12-29 Listing Removed — OneKey® MLS as Distributed by MLS Grid
- 2025-11-03 Relisted — OneKey® MLS as Distributed by MLS Grid
- 2025-11-01 Listing Removed — OneKey® MLS as Distributed by MLS Grid
- 2025-09-28 Price Changed $99,000 OneKey® MLS as Distributed by MLS Grid
- 2025-05-30 Price Changed $115,000 OneKey® MLS as Distributed by MLS Grid
- 2024-10-02 Price Changed $125,000 OneKey® MLS as Distributed by MLS Grid
- 2024-10-02 Listed $120,000 OneKey® MLS as Distributed by MLS Grid
- 2024-10-02 Coming Soon — OneKey® MLS as Distributed by MLS Grid
- 2021-08-27 Sold (MLS) $70,000 OneKey® MLS as Distributed by MLS Grid
- 2021-08-06 Relisted — OneKey® MLS as Distributed by MLS Grid
- 2021-08-05 Listing Removed — OneKey® MLS as Distributed by MLS Grid
- 2021-07-02 Relisted — OneKey® MLS as Distributed by MLS Grid
- 2021-07-01 Listing Removed — OneKey® MLS as Distributed by MLS Grid
- 2021-06-23 Price Changed $85,000 OneKey® MLS as Distributed by MLS Grid
- 2020-07-02 Listed $94,990 OneKey® MLS as Distributed by MLS Grid
Property tax history
+2.1%/yrLatest (2025): $2,689 · +0.0% YoY. Source: county tax records.
Cash-flow waterfall
monthlySold comps — $/sqft
last 12 mo · ≤1 miLoading sold comps…