520 Willard Rd · Coronaca, SC
Flood risk 1/10 · Minimal
- FEMA flood zone
- X (unshaded)
- Chance of flooding over 30 yrs
- 0.0%
- Est. flood insurance / yr
- $507 – $1,088
Fire risk 4/10 · Minor
- Est. fire insurance / yr
- $783 – $1,453
Heat risk 6/10 · Moderate
- Hot days now (above 106°F)
- 7 days/yr
- Hot days in 30 yrs
- 17 days/yr
Wind risk 6/10 · Moderate
- Chance of severe wind over 30 yrs
- 27.0%
Air-quality risk 3/10 · Minor
- Unhealthy air days now
- 2 days/yr
- Unhealthy air days in 30 yrs
- 2 days/yr
Risk factors via First Street. Map © Google.
Why this score? — see what drove the D+ grade
The composite is a weighted blend of 9 inputs, each scored 0–100. Each bar is that input's sub-score; the figure is the points it added to the 100-point composite (weight × sub-score).
- Cash flow +24.7/30.0
- DSCR +8.0/10.0
- 1% rule +5.4/10.0
- Schools +2.9/10.0
- Rent growth +2.5/5.0
- Condition / age +2.5/5.0
- Livability +2.1/5.0
- ARV discount +0.6/15.0
- Appreciation +0.0/10.0
$179,900
🖨 Deal sheet 📄 Offer letter ✓ Due diligence
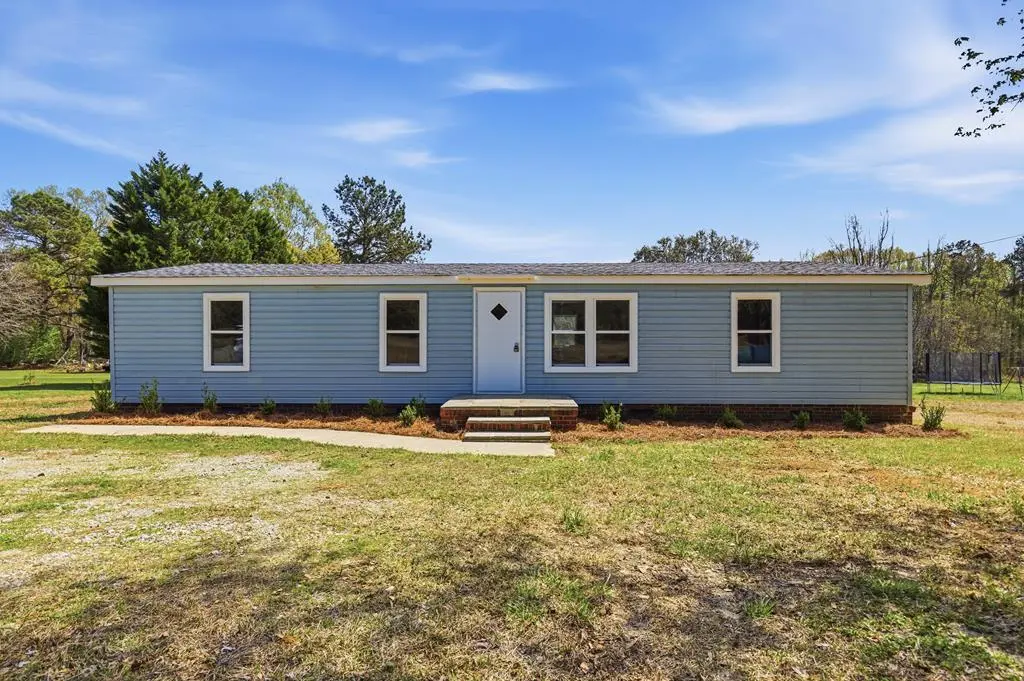
Listing remarks
Great location, very nice almost acre lot. This home is move in ready, come take a look and you will want to stay. Inside you will find an open floor plan. Recently installed vinyl plank, carpet, kitchen appliances, butcher block countertops in kitchen, updated baths, lighting and also a freshly painted interior. Out back is a large covered porch with a pond view. Lets not forget the huge detached garage/workshop. The detached garage used to have electrical so it has the possibility to have it again. This property has room for your garden, hobbies, etc.
Key facts
- Open floor plan
- Pond view
- Large covered porch
Tags
Neighborhood map
What this means for you Summary
Snapshot
- This is a 3-bed/2.0-bath manufactured listed at $180k.
Deal economics
- At list price, monthly cash flow is $376 ($5k/yr) — positive.
- The deal already cash-flows at list — no discount required.
- Meets the 1% rule at list price ($2k rent vs $180k).
- Cap rate 8.8% vs local median 1.8% in Coronaca — top-decile yield for the area; either an underpriced asset or a hidden risk that comps aren't pricing in. Stress-test before assuming the spread holds.
Location & tenants
- Location reads 42/100 on livability (#387 in SC) — a working-class tenant base; expect higher turnover. Strengths: cost of living A+, crime A; Watch: health & safety C-, schools F, amenities F.
- Greenwood 50 (town): math 31% / reading 39% proficiency, ranked #43 of 80 in SC (top 54%) — families likely to look elsewhere, expect single-tenant / working-renter base with shorter leases.
- Market conditions: 253 active listings in the ZIP; 193 units permitted in Greenwood County in 2024 (0 in 5+ unit buildings).
- This rent runs 41% of the median local income ($55k/yr) — at the standard rent-burdened threshold; future hikes will face affordability resistance.
Forward outlook
- Local home prices are declining (-3.0%/yr); year-one equity from $1k of loan paydown is wiped out by about $5k of value loss. Plan a longer hold.
- Greenwood County population projected to shrink 8% by 2050 — rents likely to lag national; underwrite the cash flow, not the appreciation.
Negotiation context
- Only 4 days on market — expect competitive offers; lowballing is unlikely to land.
Risks & watch-outs
- Climate carrying-cost: major wind risk, 27% chance of damaging wind over 30y; extreme-heat days projected 7→17/yr by 2055 (HVAC capex compounding) — expect insurance premiums to compound above CPI over the hold.
Questions for the listing agent
- Is there a deadline driving the sale (1031 exchange, divorce, estate, relocation)? That informs how much negotiation room exists.
- Schools are F-rated, which usually means shorter tenancies and higher turnover. Who's the typical renter profile here, and what's been the actual vacancy rate?
- The area grade is low — what's the realistic commute time and amenity access for the typical tenant pool here? Any planned neighborhood developments (good or bad) we should know about?
- What's the average days-on-market for RENTAL listings here right now (not sales)? A rising rental-DOM trend means longer vacancies and softer asking-rent achievability than the comps imply.
- What's the recent tenant-quality profile in this submarket — average credit score on applications, eviction rate, late-payment / NSF rate, and stable-employment percentage? A property-management company in the area should have these aggregated.
- How much new for-sale + rental construction is in the pipeline within 1–3 miles? Heavy new supply typically softens prices + rents 12–24 months out; constrained supply supports both.
Investment metrics
- 1% rule
- 1.04% ✓
- Cap rate
- 8.80%
- Cash-on-cash
- 8.97%
- DSCR
- 1.40
- GRM
- 8.0
CMA / ARV
- ARV (on-the-fly)
- $156,000
- Comps found
- 1
Show comp detail 1 sale within ~0.75 mi
| Address | Dist | Beds/Ba | Sqft | Sold | Price | $/sf | Match |
|---|---|---|---|---|---|---|---|
| 520 Willard Rd | 0.00mi | 3/2.0 | 1,350 (+12%) | 1mo | $175,000 | $130 | 78 |
Match score weights: distance 35% · size 25% · config 20% · recency 20%. Top-matched comps best support the ARV.
Projected returns pro-forma
-3.0% appreciation · 3.0% rent growth · sell at horizon
- IRR
- -2.8%
- Equity multiple
- 0.90×
- Total profit
- $-5,230
- Equity at exit
- $26,824
- IRR
- 6.9%
- Equity multiple
- 1.52×
- Total profit
- $26,096
- Equity at exit
- $15,554
Cash invested: $50,372 (down + closing). Projections, not guarantees.
Landlord ↔ Tenant lean methodology
- Overall (STATE)
- 90 Strongly Landlord-Friendly
- State South Carolina
- 90 Strongly Landlord-Friendly · R+6
- County
- — inherits STATE
- City
- — inherits STATE
ZIP-level market 29649
- Active inventory
- 253
- Price-to-rent
- 8.0×
Monthly cashflow live
- Estimated rent
- $1,879 medium interval (Pro) →
- Mortgage (P&I)
- −$943
- Tax from tax record
- −$89 /mo · $1,071/yr
- Insurance
- −$75
- HOA
- −$0
- Vacancy / Maint / Mgmt
- −$394
- Net cashflow
- $376
Break-even live
UW: 25.0% down · 7.5% · 30yr · 1.5% tax · 5.0% vac · 8.0% maint · 8.0% mgmt
Financing live
Cash to close
- Down payment
- $44,975
- Closing costs
- $5,397
- Reserves months
- —
- Total cash needed
- —
Loan-product check · same deal, 3 products live
Conventional
25% down · 7.5% · 30yr
- Down + closing
- —
- Monthly P&I
- —
- Monthly cashflow
- —
- DSCR
- —
- Eligible?
- —
Personal DTI + credit; lowest rate.
DSCR
20% down · 8.5% · 30yr
- Down + closing
- —
- Monthly P&I
- —
- Monthly cashflow
- —
- DSCR
- —
- Eligible?
- —
No personal income docs; deal must DSCR.
Hard money
10% down · 12.0% · 12mo
- Down + closing
- —
- Monthly P&I
- —
- Monthly cashflow
- —
- DSCR
- —
- Eligible?
- —
Short-term bridge; refi at stabilization.
Listing history 2 events
-
2026-06-12remarks 559-char remark
-
2026-06-12$179,900 Pending 4 DOM
ⓘ Source: listings_history table (triggers on properties + properties_extension) + one-shot
backfill from property_details.listing_events for pre-trigger history.
Tax reassessment forecast SC · Resets to sale price
- Current annual tax
- $1,071 · $89/mo
- Projected year-2 tax
- $1,071 · $89/mo
- Expected delta
- $0/yr ($0/mo · 0.0%)
ⓘ Screening estimate from a state-policy table — verify with the county assessor before closing.
Climate risk First Street
- Flood 1/10 Low FEMA zone X (unshaded) · 0% chance over 30 yrs
- Wildfire 4/10 Moderate
- Heat 6/10 Major 7 d/yr ≥106°F today · 17 d/yr by 30 yrs out
- Wind 6/10 Major 27% chance of damaging wind over 30 yrs
- Air quality 3/10 Moderate 2 unhealthy d/yr today · 2 by 30 yrs out
Nearby sold comps map
Loading sold comps map…
Walkable amenities ~0.75 mi
Loading nearby amenities…
Taxation est. · year 1
- Rental income
- $22,543
- − Mortgage interest
- −$10,077
- − Property taxes
- −$1,071
- − Insurance
- −$900
- − Repairs & maintenance
- −$1,803
- − Management
- −$1,803
- − Depreciation
- −$5,233
- Taxable income
- $1,655
- Est. tax owed @ 24.0%
- −$397
- After-tax cash flow
- $4,120/yr
For passive investors: Depreciation is non-cash, so a rental often shows a tax loss while cash-flowing — sheltering income. Rental losses are passive: they offset passive income freely, and up to $25,000/yr can offset ordinary (W-2) income if you actively participate and your MAGI is under $100k (phasing out to $0 by $150k); unused losses carry forward. On sale, claimed depreciation is recaptured at up to 25%, and gains may owe capital-gains tax (a 1031 exchange can defer both). Figures are a year-1 estimate at your 24.0% rate — not tax advice; consult a CPA.
Schools (NCES district)
- District
- Greenwood 50
- NCES district ID
- 4502340
- Math proficiency
- 31% ▼ -4.00%
- Reading proficiency
- 39% ▲ 2.00%
- Median HH income
- $37,663
- Composite
- 29.14/100
- National rank
- #6585
- State rank
- #43 of 80 in SC
Livability — Coronaca
- Score
- 42/100
- State rank
- #387
- US rank
- #27009
Category grades
Schools grade is shown separately in the Schools card above.
Census & demographics
- Census place
- Coronaca, SC
- County
- Greenwood County · 26,275 people
- Metro
- Greenwood, SC
- Population (ZIP)
- 26,275
- Household income
- $54,585
- Rent vs Own
- Severe rent burden
- 566.0
Population outlook (Greenwood County) Hauer SSP2
- Today (2025)
- 69,627 people
- By 2030
- 68,905 · -1.0%
- By 2040
- 66,640 · -4.3%
- By 2050
- 63,768 · -8.4%
- By 2075
- 55,769 · -19.9%
- By 2100
- 47,293 · -32.1%
Race, ethnicity, and origin ACS 2023
- Neighborhood character
- Predominantly White (65%)
- Race & ethnicity
- White 65% Black 25% Hispanic / Latino 4% Two or more races 4% Asian 2%
- Common ancestry
- Serbian 3% Italian 3% Slovak 3%
- Foreign-born
- 4% · Canada, China
- Languages at home
- 97% English-only · Spanish 2%
Political lean MEDSL · Greenwood
- 2024 margin
- Strong R (+29.0) · D 34.9% · R 63.8% · Other 1.3%
- 2008→2024 swing
- -13.3pp toward R · 2008: -15.7pp · 2024: -29.0pp
- All cycles
- 2024: R+29.0 2020: R+22.8 2016: R+21.8 2012: R+15.4 2008: R+15.7
Not yet ingested
- Civics
- —
Market trends
- HPI YoY
- ▼ -128.00%
- Current HPI
- 167.9262
- Rent YoY
- —
- Metro
- Greenwood, SC
- State GDP YoY
- ▲ 4.51%
- F500 in state
- 2
Industry mix (Fortune 500 HQ in SC)
| Industry | F500 HQs | Revenue |
|---|---|---|
| Packaging | 1 | $7B |
|
||
Price history
+250.0% since first listed6 events — show timeline
- 2026-06-11 Pending — GAOR
- 2026-05-18 Sold (MLS) $175,000 GAOR
- 2026-05-18 Sold (MLS) $175,000 GAOR
- 2026-04-01 Pending — GAOR
- 2026-03-28 Listed $179,900 GAOR
- 2025-09-25 Sold (Public Records) $50,000 Public Records
Property tax history
+22.4%/yrLatest (2025): $1,071 · +0.0% YoY. Source: county tax records.
Cash-flow waterfall
monthlySold comps — $/sqft
last 12 mo · ≤1 miLoading sold comps…