311 S Bridge St · Belding, MI
Flood risk 1/10 · Minimal
- FEMA flood zone
- X (unshaded)
- Chance of flooding over 30 yrs
- 0.0%
- Est. flood insurance / yr
- $473 – $860
Fire risk 1/10 · Minimal
- Est. fire insurance / yr
- $784 – $1,456
Heat risk 3/10 · Minor
- Hot days now (above 98°F)
- 7 days/yr
- Hot days in 30 yrs
- 16 days/yr
Wind risk 2/10 · Minimal
- Chance of severe wind over 30 yrs
- —
Air-quality risk 2/10 · Minimal
- Unhealthy air days now
- 1 days/yr
- Unhealthy air days in 30 yrs
- 2 days/yr
Risk factors via First Street. Map © Google.
Why this score? — see what drove the C+ grade
The composite is a weighted blend of 9 inputs, each scored 0–100. Each bar is that input's sub-score; the figure is the points it added to the 100-point composite (weight × sub-score).
- Cash flow +18.1/30.0
- ARV discount +12.4/15.0
- Appreciation +10.0/10.0
- DSCR +5.7/10.0
- 1% rule +5.0/10.0
- Livability +3.7/5.0
- Rent growth +2.5/5.0
- Condition / age +2.5/5.0
- Schools +2.3/10.0
$229,900
🖨 Deal sheet 📄 Offer letter ✓ Due diligence
Listing remarks MLS
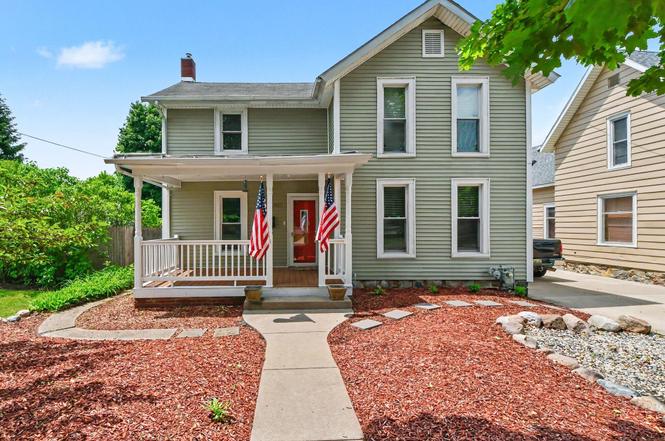
Welcome home! This well cared for 3 bed 2 bath home in Belding schools is ready for you to call home. Two living rooms and a large bedroom on the main floor. Full bath, remodeled kitchen and laundry room lead you too a backyard oasis. With a covered pad and gazebo, the backyard is perfect for entertaining or a quiet evening retreat. Extra deep one stall garage for storage and hobbies. Upstairs features 2 more bedrooms and another full bath. Offers due on Wednesday June 24th at 6pm.
Key facts
- Gazebo
- Remodeled kitchen
- Covered porch area
Tags
Property features AI
Exterior
- Parking: Detached 1-car garage
- Utilities: Public water; Natural gas connected
- Home design: Traditional single-family residence; Residential property; Built in 1900
- Construction: Vinyl siding; Composition roof
- Exterior features: Sidewalk
Interior
- Kitchen: Dishwasher; Range; Refrigerator
- Bathrooms: 2 full bathrooms
- Heating & cooling: Forced air heating; Cooling present
- Interior features: 7 total rooms; Michigan-style basement
- Laundry & utility: Washer; Dryer
Neighborhood map
What this means for you Summary
Snapshot
- This is a 3-bed/2.0-bath single-family listed at $230k.
Deal economics
- At list price, monthly cash flow is $202 ($2k/yr) — positive.
- The deal already cash-flows at list — no discount required.
- To meet the 1% rule (rent ≥ 1% of price), the offer needs to be $230k (0.2% below list).
- Recommended offer: $230k (0.2% below list) — sets the bar for 1% rule.
- Cap rate 7.3% vs local median 4.5% in Belding — top-decile yield for the area; either an underpriced asset or a hidden risk that comps aren't pricing in. Stress-test before assuming the spread holds.
Location & tenants
- Location reads 74/100 on livability (#169 in MI, #4,436 nationally) — a middle-class / working-renter tenant base. Strengths: cost of living A+, housing A+, health & safety A+; Watch: employment D, schools D-, amenities F.
- Belding Area School District (town): math 23% / reading 31% proficiency, ranked #398 of 540 in MI (top 74%) — low school quality limits family demand, transient renter base, plan for 1-2y turnover.
- Market conditions: 72 active listings in the ZIP; 1 comparable units currently listed for rent nearby; 94 units permitted in Ionia County in 2024 (0 in 5+ unit buildings).
Forward outlook
- In year one you build about $25k of equity ($2k loan paydown + $23k appreciation (10.0% local appreciation)).
- Ionia County population projected to shrink 8% by 2050 — rents likely to lag national; underwrite the cash flow, not the appreciation.
- At projected returns (10.0% appreciation + 3.0% rent growth), your $64k cash investment doubles in ~3 years — after that, you're playing with house money.
- By year 2, paydown + projected appreciation supports a ~$40k cash-out refi (75% LTV) — recoverable capital for the next deal without selling this one.
Negotiation context
- Only 1 days on market — expect competitive offers; lowballing is unlikely to land.
- 17 sale attempts since 21y ago with the ask held roughly flat each time — persistent listings suggest the price (not the market) is what's stuck; bring a comps-based counter.
- Current owner paid $178k; 29% above their basis — modest negotiation headroom, anchor on the comps not their cost.
Risks & watch-outs
- Watch-outs: built in 1900 — expect roof / HVAC / electrical / plumbing capex.
Questions for the listing agent
- Built in 1900 — when were the roof, HVAC, electrical panel, plumbing, and water heater last replaced?
- Is there a deadline driving the sale (1031 exchange, divorce, estate, relocation)? That informs how much negotiation room exists.
- Schools are D-rated, which usually means shorter tenancies and higher turnover. Who's the typical renter profile here, and what's been the actual vacancy rate?
- What's the average days-on-market for RENTAL listings here right now (not sales)? A rising rental-DOM trend means longer vacancies and softer asking-rent achievability than the comps imply.
- What's the recent tenant-quality profile in this submarket — average credit score on applications, eviction rate, late-payment / NSF rate, and stable-employment percentage? A property-management company in the area should have these aggregated.
- How much new for-sale + rental construction is in the pipeline within 1–3 miles? Heavy new supply typically softens prices + rents 12–24 months out; constrained supply supports both.
Investment metrics
- 1% rule
- 1.00% ✗
- Cap rate
- 7.35%
- Cash-on-cash
- 3.76%
- DSCR
- 1.17
- GRM
- 8.3
CMA / ARV
- ARV (on-the-fly)
- $258,264
- Comps found
- 12
Show comp detail 12 sales within ~0.75 mi
| Address | Dist | Beds/Ba | Sqft | Sold | Price | $/sf | Match |
|---|---|---|---|---|---|---|---|
| 322 Alderman St | 0.09mi | 3/2.0 | 1,810 (+7%) | 3mo | $220,000 | $122 | 81 |
| 917 S Bridge St | 0.39mi | 4/2.0 (+1) | 1,768 (+5%) | 3mo | $223,000 | $126 | 66 |
| 121 W Ann St | 0.24mi | 4/2.0 (+1) | 1,558 (-8%) | 7mo | $255,000 | $164 | 65 |
| 616 S Broas St | 0.25mi | 4/2.0 (+1) | 1,512 (-10%) | 1mo | $255,000 | $169 | 65 |
| 421 Lewis St | 0.52mi | 4/2.0 (+1) | 1,738 (+3%) | 3mo | $212,000 | $122 | 63 |
| 509 W Congress St | 0.28mi | 3/2.0 | 1,499 (-11%) | 7mo | $230,000 | $153 | 63 |
| 425 Woodland Ave | 0.56mi | 4/2.0 (+1) | 1,651 (-2%) | 6mo | $210,000 | $127 | 60 |
| 516 S Front St | 0.25mi | 4/3.5 (+1) | 1,869 (+11%) | 2mo | $235,000 | $126 | 58 |
| 710 James St | 0.29mi | 3/1.0 | 1,899 (+12%) | 7mo | $157,000 | $83 | 56 |
| 114 Vincent St | 0.69mi | 4/2.0 (+1) | 1,634 (-3%) | 5mo | $250,000 | $153 | 54 |
| 377 White Pine Ct | 0.73mi | 3/2.0 | 1,555 (-8%) | 1mo | $269,900 | $174 | 52 |
| 714 W State St | 0.60mi | 3/2.0 | 1,914 (+13%) | 4mo | $312,000 | $163 | 46 |
Match score weights: distance 35% · size 25% · config 20% · recency 20%. Top-matched comps best support the ARV.
Projected returns pro-forma
10.0% appreciation · 3.0% rent growth · sell at horizon
- IRR
- 27.0%
- Equity multiple
- 3.15×
- Total profit
- $138,096
- Equity at exit
- $207,112
- IRR
- 23.6%
- Equity multiple
- 7.16×
- Total profit
- $396,671
- Equity at exit
- $446,645
Cash invested: $64,372 (down + closing). Projections, not guarantees.
Landlord ↔ Tenant lean methodology
- Overall (STATE)
- 62 Landlord-Friendly
- State Michigan
- 62 Landlord-Friendly · EVEN
- County
- — inherits STATE
- City
- — inherits STATE
ZIP-level market 48809
- Home prices YoY
- 3.3%
- Active inventory
- 72
- Price-to-rent
- 8.3×
Monthly cashflow live
- Estimated rent
- $2,295 medium interval (Pro) →
- Mortgage (P&I)
- −$1,206
- Tax from tax record
- −$310 /mo · $3,721/yr
- Insurance
- −$96
- HOA
- −$0
- Vacancy / Maint / Mgmt
- −$482
- Net cashflow
- $202
Break-even live
UW: 25.0% down · 7.5% · 30yr · 1.5% tax · 5.0% vac · 8.0% maint · 8.0% mgmt
Financing live
Cash to close
- Down payment
- $57,475
- Closing costs
- $6,897
- Reserves months
- —
- Total cash needed
- —
Loan-product check · same deal, 3 products live
Conventional
25% down · 7.5% · 30yr
- Down + closing
- —
- Monthly P&I
- —
- Monthly cashflow
- —
- DSCR
- —
- Eligible?
- —
Personal DTI + credit; lowest rate.
DSCR
20% down · 8.5% · 30yr
- Down + closing
- —
- Monthly P&I
- —
- Monthly cashflow
- —
- DSCR
- —
- Eligible?
- —
No personal income docs; deal must DSCR.
Hard money
10% down · 12.0% · 12mo
- Down + closing
- —
- Monthly P&I
- —
- Monthly cashflow
- —
- DSCR
- —
- Eligible?
- —
Short-term bridge; refi at stabilization.
Rent comps 1 comps
| Address | Beds | Baths | Sqft | Rent | $/sqft | DOM | Units | Dist |
|---|---|---|---|---|---|---|---|---|
| 372 White Pine Ct Belding, MI | 4.0 | 2.5 | 1750 | $2,295 | $1.31 | 10d | 1 | 0.73mi |
Listing history 2 events
-
2026-06-17remarks 487-char remark
-
2026-06-17$229,900 Active 1 DOM
ⓘ Source: listings_history table (triggers on properties + properties_extension) + one-shot
backfill from property_details.listing_events for pre-trigger history.
Tax reassessment forecast MI · Partial reset (capped growth)
- Current annual tax
- $3,721 · $310/mo
- Projected year-2 tax
- $3,721 · $310/mo
- Expected delta
- $0/yr ($0/mo · 0.0%)
ⓘ Screening estimate from a state-policy table — verify with the county assessor before closing.
Climate risk First Street
- Flood 1/10 Low FEMA zone X (unshaded) · 0% chance over 30 yrs
- Wildfire 1/10 Low
- Heat 3/10 Moderate 7 d/yr ≥98°F today · 16 d/yr by 30 yrs out
- Wind 2/10 Low
- Air quality 2/10 Low 1 unhealthy d/yr today · 2 by 30 yrs out
Nearby sold comps map
Loading sold comps map…
Walkable amenities ~0.75 mi
Loading nearby amenities…
Taxation est. · year 1
- Rental income
- $27,540
- − Mortgage interest
- −$12,878
- − Property taxes
- −$3,721
- − Insurance
- −$1,150
- − Repairs & maintenance
- −$2,203
- − Management
- −$2,203
- − Depreciation
- −$6,688
- Taxable loss
- −$1,303
- Est. tax savings @ 24.0%
- +$313
- After-tax cash flow
- $2,731/yr
For passive investors: Depreciation is non-cash, so a rental often shows a tax loss while cash-flowing — sheltering income. Rental losses are passive: they offset passive income freely, and up to $25,000/yr can offset ordinary (W-2) income if you actively participate and your MAGI is under $100k (phasing out to $0 by $150k); unused losses carry forward. On sale, claimed depreciation is recaptured at up to 25%, and gains may owe capital-gains tax (a 1031 exchange can defer both). Figures are a year-1 estimate at your 24.0% rate — not tax advice; consult a CPA.
Schools (NCES district)
- District
- Belding Area School District
- NCES district ID
- 2604530
- Math proficiency
- 23% ▼ -9.00%
- Reading proficiency
- 31% ▼ -8.00%
- Median HH income
- $46,310
- Composite
- 23.33/100
- National rank
- #7915
- State rank
- #398 of 540 in MI
Livability — Belding
- Score
- 74/100
- State rank
- #169
- US rank
- #4436
Category grades
Schools grade is shown separately in the Schools card above.
Census & demographics
- Census place
- Belding, MI
- Population (ZIP)
- 11,292
Population outlook (Ionia County) Hauer SSP2
- Today (2025)
- 63,958 people
- By 2030
- 63,321 · -1.0%
- By 2040
- 61,544 · -3.8%
- By 2050
- 58,682 · -8.2%
- By 2075
- 48,909 · -23.5%
- By 2100
- 35,867 · -43.9%
Race, ethnicity, and origin ACS 2023
- Neighborhood character
- Predominantly White (91%)
- Race & ethnicity
- White 91% Hispanic / Latino 4% Two or more races 4%
- Common ancestry
- Iranian 7% Romanian 4% Lithuanian 3%
- Foreign-born
- 1% · Canada, China
- Languages at home
- 95% English-only · Spanish 3% Russian/Polish/Slavic 1%
Political lean MEDSL · Ionia
- 2024 margin
- Solid R (+31.9) · D 33.3% · R 65.2% · Other 1.5%
- 2008→2024 swing
- -26.0pp toward R · 2008: -5.8pp · 2024: -31.9pp
- All cycles
- 2024: R+31.9 2020: R+30.3 2016: R+31.0 2012: R+12.8 2008: R+5.8
Not yet ingested
- Civics
- —
Market trends
- HPI YoY
- ▲ 13.30%
- Current HPI
- 412.5108
- Rent YoY
- —
- Metro
- —
- State GDP YoY
- ▲ 1.37%
- F500 in state
- 28
Industry mix (Fortune 500 HQ in MI)
| Industry | F500 HQs | Revenue |
|---|---|---|
| Automotive Parts | 3 | $48B |
|
||
| Automotive | 2 | $372B |
|
||
| Chemicals | 1 | $45B |
|
||
| Automotive Retail | 1 | $29B |
|
||
| Healthcare / Medical Devices | 1 | $23B |
|
||
| Automotive Technology | 1 | $20B |
|
||
Price history
+187.7% since first listed36 events — show timeline
- 2026-06-10 Listed $229,900 REALCOMP
- 2026-06-10 Listed $229,900 MiRealSource-MiMLS
- 2026-06-10 Listed $229,900 SW Michigan MLS
- 2021-07-06 Sold (Public Records) $178,000 Public Records
- 2021-06-25 Sold (MLS) $178,000 SW Michigan MLS
- 2021-06-25 Sold (MLS) $178,000 REALCOMP
- 2021-05-26 Pending — REALCOMP
- 2021-05-26 Pending — SW Michigan MLS
- 2021-05-21 Listed $180,000 MiRealSource-MiMLS
- 2021-05-21 Listed $180,000 SW Michigan MLS
- 2021-05-21 Listed $180,000 REALCOMP
- 2019-11-22 Sold (Public Records) $150,000 Public Records
- 2019-11-13 Sold (MLS) $150,000 SW Michigan MLS
- 2019-11-13 Sold (MLS) $150,000 REALCOMP
- 2019-10-08 Pending — SW Michigan MLS
- 2019-09-10 Price Changed $147,900 SW Michigan MLS
- 2019-08-30 Relisted — SW Michigan MLS
- 2019-08-23 Pending — SW Michigan MLS
- 2019-08-14 Listed $147,900 MiRealSource-MiMLS
- 2019-08-14 Listed $147,900 REALCOMP
- 2019-08-14 Listed $149,900 SW Michigan MLS
- 2019-08-14 Listed $147,900 REALCOMP
- 2016-08-31 Sold (Public Records) $122,500 Public Records
- 2014-09-16 Listing Removed — SW Michigan MLS
- 2011-04-28 Sold (MLS) $17,500 REALCOMP
- 2011-04-28 Sold (MLS) $17,500 SW Michigan MLS
- 2010-12-18 Listed $22,800 REALCOMP
- 2010-12-18 Listed $22,800 SW Michigan MLS
- 2010-10-25 Listing Removed — REALCOMP
- 2010-08-13 Listed $32,000 REALCOMP
- 2010-08-13 Listed $32,000 SW Michigan MLS
- 2005-10-15 Sold (MLS) $89,000 REALCOMP
- 2005-10-15 Sold (MLS) $89,000 SW Michigan MLS
- 2005-10-07 Sold (Public Records) $89,000 Public Records
- 2005-05-20 Listed $79,900 REALCOMP
- 2005-05-20 Listed $79,900 SW Michigan MLS
Property tax history
+12.4%/yrLatest (2025): $3,721 · +2.7% YoY. Source: county tax records.
Cash-flow waterfall
monthlySold comps — $/sqft
last 12 mo · ≤1 miLoading sold comps…