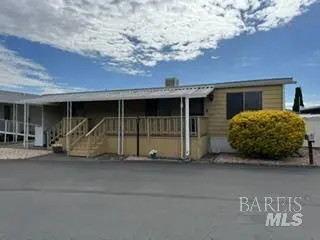
8117 Circle Dr St · Windsor, CA
Flood risk 6/10 · Moderate
- FEMA flood zone
- X (unshaded)
- Chance of flooding over 30 yrs
- 0.68%
- Est. flood insurance / yr
- $507 – $1,088
Fire risk 5/10 · Moderate
- Est. fire insurance / yr
- $659 – $1,223
Heat risk 4/10 · Minor
- Hot days now (above 92°F)
- 7 days/yr
- Hot days in 30 yrs
- 16 days/yr
Wind risk 1/10 · Minimal
- Chance of severe wind over 30 yrs
- —
Air-quality risk 9/10 · Severe
- Unhealthy air days now
- 18 days/yr
- Unhealthy air days in 30 yrs
- 20 days/yr
Risk factors via First Street. Map © Google.
Why this score? — see what drove the B+ grade
The composite is a weighted blend of 9 inputs, each scored 0–100. Each bar is that input's sub-score; the figure is the points it added to the 100-point composite (weight × sub-score).
- Cash flow +30.0/30.0
- ARV discount +15.0/15.0
- 1% rule +10.0/10.0
- DSCR +10.0/10.0
- Condition / age +3.8/5.0
- Livability +3.6/5.0
- Rent growth +2.5/5.0
- Schools +2.5/10.0
- Appreciation +0.0/10.0
$159,900
🖨 Deal sheet (PDF) 📄 Offer letter ✓ Due diligence
Listing remarks
Welcome to this spacious and inviting 1977 manufactured home offering approximately 1344 square feet of comfortable living space with 2 bedrooms and 2 bathrooms. Ideally located directly across from the office, clubhouse, and swimming pool in the desirable Windsor Mobile Country Club community. This home also enjoys convenient access to the Town Green, Oliver's Market, Safeway, shopping, dining, and many of the wonderful amenities Windsor has to offer. There is also public transit across the street outside the clubhouse. Step inside to a large and welcoming living area filled with natural light from the many windows throughout the home, creating a bright and airy atmosphere. Brand new carpe
Key facts
- New window coverings
- Large living area
- Natural light
Tags
Property features AI
Finance
- Other: Future space rent information available
- Financial info: Land lease amount: $929
- HOA & community: No homeowners association; Senior community; Located in Windsor Mobile Country Club (park name); Land lease applies
Exterior
- Parking: Detached garage; Guest parking available; 2 parking spaces
- Security: Carbon monoxide detector; Smoke detector; Double-strapped water heater
- Utilities: Gas plumbed; Individual electric meter; Individual gas meter; Internet available; Public sewer
- Home design: Manufactured home in park; Double-wide; Updated/remodeled condition
- Construction: Aluminum skirting; Meteor manufacturer/make; Other roof
- Exterior features: Covered deck; Porch with steps; Deck attached to living room; Shed(s); Close to clubhouse
Interior
- Kitchen: Dishwasher; Disposal; Free-standing gas range; Free-standing refrigerator; Synthetic countertops; Breakfast area
- Bedrooms: 2 bedrooms
- Flooring: Carpet; Linoleum; Simulated wood
- Bathrooms: 2 full bathrooms; Sunken tub; Tub with shower over
- Heating & cooling: Central heating; Evaporative cooler
- Interior features: Cathedral ceiling; Carbon monoxide detector; Double-strapped water heater; Smoke detector
- Laundry & utility: Washer and dryer included; Gas hook-up for dryer; Gas water heater
Neighborhood map
What this means for you Summary
Snapshot
- This is a 2-bed/2.0-bath manufactured listed at $160k. Condition is rated good.
Deal economics
- At list price, monthly cash flow is $1k ($15k/yr) — positive.
- The deal already cash-flows at list — no discount required.
- Meets the 1% rule at list price ($3k rent vs $160k).
- Cap rate 15.9% vs local median 3.1% in Windsor — top-decile yield for the area; either an underpriced asset or a hidden risk that comps aren't pricing in. Stress-test before assuming the spread holds.
Location & tenants
- Location reads 71/100 on livability (#210 in CA) — a middle-class / working-renter tenant base. Strengths: employment A+, housing A+, health & safety A+; Watch: amenities F, commute F, cost of living F.
- Windsor Unified (suburban): math 25% / reading 25% proficiency, ranked #362 of 517 in CA (top 70%) — low school quality limits family demand, transient renter base, plan for 1-2y turnover.
- Zoned schools: Mattie Washburn Elementary (514 students, 49% FRL); Windsor Middle (725 students, 50% FRL); Windsor High (1,603 students, 46% FRL) — zoned schools average 48% FRL vs 33% district-wide (16 pts higher); higher-poverty schools than district average — tighter screening recommended.
- Market conditions: 106 active listings in the ZIP; 10 comparable units currently listed for rent nearby; rentals lingering (median 46d on market — plan ~5-8 weeks vacancy on turnover, expect pricing pressure); 60% of comp listings sitting > 30 days — soft ceiling on asking rent; high-income renter base; 1,039 units permitted in Sonoma County in 2024 (185 in 5+ unit buildings).
Forward outlook
- Local home prices are declining (-3.0%/yr); year-one equity from $1k of loan paydown is wiped out by about $5k of value loss. Plan a longer hold.
- Sonoma County population projected at +8% by 2050 — modest demand growth; plan on rents tracking national, not racing it.
- At projected returns (-3.0% appreciation + 3.0% rent growth), your $45k cash investment doubles in ~4 years — after that, you're playing with house money.
Negotiation context
- Only 13 days on market — expect competitive offers; lowballing is unlikely to land.
Risks & watch-outs
- Climate carrying-cost: major flood risk; moderate wildfire risk — expect insurance premiums to compound above CPI over the hold.
Questions for the listing agent
- Built in 1977 — when were the roof, HVAC, electrical panel, plumbing, and water heater last replaced?
- Is there a deadline driving the sale (1031 exchange, divorce, estate, relocation)? That informs how much negotiation room exists.
- What's the average days-on-market for RENTAL listings here right now (not sales)? A rising rental-DOM trend means longer vacancies and softer asking-rent achievability than the comps imply.
- What's the recent tenant-quality profile in this submarket — average credit score on applications, eviction rate, late-payment / NSF rate, and stable-employment percentage? A property-management company in the area should have these aggregated.
- How much new for-sale + rental construction is in the pipeline within 1–3 miles? Heavy new supply typically softens prices + rents 12–24 months out; constrained supply supports both.
Investment metrics
- 1% rule
- 1.88% ✓
- Cap rate
- 15.85%
- Cash-on-cash
- 34.15%
- DSCR
- 2.52
- GRM
- 4.4
CMA / ARV
- ARV (on-the-fly)
- $260,736
- Comps found
- 12
Show comp detail 12 sales within ~0.75 mi
| Address | Dist | Beds/Ba | Sqft | Sold | Price | $/sf | Match |
|---|---|---|---|---|---|---|---|
| 601 Aspen Way | 0.11mi | 2/2.0 | 1,296 (-4%) | 6mo | $179,900 | $139 | 84 |
| 610 Aspen Way | 0.14mi | 2/2.0 | 1,345 (+0%) | 12mo | $169,000 | $126 | 84 |
| 8107 B St | 0.12mi | 3/2.0 (+1) | 1,300 (-3%) | 10mo | $270,000 | $208 | 76 |
| 612 Aspen Way | 0.15mi | 3/2.0 (+1) | 1,308 (-3%) | 11mo | $215,000 | $164 | 75 |
| 8109 B St | 0.00mi | 2/2.0 | 1,152 (-14%) | 3mo | $199,000 | $173 | 74 |
| 8317 Blue Spruce Way | 0.19mi | 2/2.0 | 1,440 (+7%) | 7mo | $135,000 | $94 | 73 |
| 1032 Maple Dr | 0.11mi | 2/2.0 | 1,484 (+10%) | 8mo | $385,000 | $259 | 71 |
| 1133 Chinaberry Way | 0.22mi | 2/2.0 | 1,440 (+7%) | 12mo | $279,000 | $194 | 68 |
| 702 Sequoia St | 0.11mi | 2/2.0 | 1,536 (+14%) | 12mo | $170,000 | $111 | 61 |
| 229 Wade Dr | 0.65mi | 3/2.0 (+1) | 1,344 (0%) | 16mo | $285,000 | $212 | 51 |
| 153 Bari Ln | 0.64mi | 3/2.0 (+1) | 1,238 (-8%) | 3mo | $268,620 | $217 | 49 |
| 237 Wade Dr Unit Sp 46 | 0.65mi | 3/2.0 (+1) | 1,231 (-8%) | 14mo | $312,000 | $253 | 39 |
Match score weights: distance 35% · size 25% · config 20% · recency 20%. Top-matched comps best support the ARV.
Projected returns pro-forma
-3.0% appreciation · 3.0% rent growth · sell at horizon
- IRR
- 29.5%
- Equity multiple
- 2.23×
- Total profit
- $55,285
- Equity at exit
- $23,842
- IRR
- 36.9%
- Equity multiple
- 4.41×
- Total profit
- $152,820
- Equity at exit
- $13,825
Cash invested: $44,772 (down + closing). Projections, not guarantees.
Landlord ↔ Tenant lean methodology
- Overall (STATE)
- 18 Strongly Tenant-Friendly
- State California
- 18 Strongly Tenant-Friendly · D+13
- County
- — inherits STATE
- City
- — inherits STATE
ZIP-level market 95492
- Active inventory
- 106
- Price-to-rent
- 4.4×
Monthly cashflow live
- Estimated rent
- $3,012 high interval (Pro) →
- Mortgage (P&I)
- −$839
- Tax est. 1.5%
- −$200 /mo · $2,398/yr
- Insurance
- −$67
- HOA
- −$0
- Vacancy / Maint / Mgmt
- −$632
- Net cashflow
- $1,274
Break-even live
Sensitivity live
| Price | -10% $1,385 | -5% $1,329 | +0% $1,274 | +5% $1,219 | +10% $1,164 |
|---|---|---|---|---|---|
| Rent | -10% $1,036 | -5% $1,155 | +0% $1,274 | +5% $1,393 | +10% $1,512 |
| Rate | -1.0pp $1,355 | -0.5pp $1,315 | base $1,274 | +0.5pp $1,233 | +1.0pp $1,191 |
UW: 25.0% down · 7.5% · 30yr · 1.5% tax · 5.0% vac · 8.0% maint · 8.0% mgmt
Financing live
Cash to close
- Down payment
- $39,975
- Closing costs
- $4,797
- Reserves months
- —
- Total cash needed
- —
Loan-product check · same deal, 3 products live
Conventional
25% down · 7.5% · 30yr
- Down + closing
- —
- Monthly P&I
- —
- Monthly cashflow
- —
- DSCR
- —
- Eligible?
- —
Personal DTI + credit; lowest rate.
DSCR
20% down · 8.5% · 30yr
- Down + closing
- —
- Monthly P&I
- —
- Monthly cashflow
- —
- DSCR
- —
- Eligible?
- —
No personal income docs; deal must DSCR.
Hard money
10% down · 12.0% · 12mo
- Down + closing
- —
- Monthly P&I
- —
- Monthly cashflow
- —
- DSCR
- —
- Eligible?
- —
Short-term bridge; refi at stabilization.
Rent comps 10 comps
| Address | Beds | Baths | Sqft | Rent | $/sqft | DOM | Units | Dist |
|---|---|---|---|---|---|---|---|---|
| 208 Courtyards E Windsor, CA | 2.0 | 2.0 | 980 | $2,300 | $2.35 | 15d | 1 | 0.24mi |
| 172 Courtyards E Windsor, CA | 2.0 | 2.0 | 980 | $2,650 | $2.70 | 15d | 1 | 0.32mi |
| 10 3rd St Unit 10 Windsor, CA | 2.0 | 1.5 | 1000 | $2,395 | $2.40 | 45d | 1 | 0.47mi |
| 7924 Ferrari Way Windsor, CA | 3.0 | 2.0 | 1476 | $3,400 | $2.30 | 45d | 1 | 0.62mi |
| 185 Johnson St Windsor, CA | 3.0 | 2.5 | 1796 | $3,300 | $1.84 | 45d | 1 | 0.72mi |
| 776 McClelland Dr Windsor, CA | 2.0 | 2.5 | 1344 | $2,900 | $2.16 | 45d | 1 | 0.84mi |
| 1145 Shiloh Rd Windsor, CA | 3.0 | 1.0–2.0 | 776 | $3,828 | $4.93 | 9d | 14 | 0.91mi |
| 904 Bond Pl Windsor, CA | 3.0 | 3.0 | 1587 | $1,275 | $0.80 | 45d | 1 | 1.01mi |
| 9631 Old Redwood Hwy Unit 9631 Windsor, CA | 2.0 | 1.0 | 1047 | $2,375 | $2.27 | 23d | 1 | 1.28mi |
| 1011 Ventana Dr Windsor, CA | 3.0 | 2.0 | 1100 | $3,400 | $3.09 | 45d | 1 | 1.30mi |
Listing history 10 events
-
2026-06-21days on market $159,900 Active 13 DOM
-
2026-06-18days on market $159,900 Active 10 DOM
-
2026-06-17days on market $159,900 Active 9 DOM
-
2026-06-16days on market $159,900 Active 8 DOM
-
2026-06-15days on market $159,900 Active 7 DOM
-
2026-06-14days on market $159,900 Active 5 DOM
-
2026-06-13days on market $159,900 Active 4 DOM
-
2026-06-10days on market $159,900 Active 2 DOM
-
2026-06-09remarks 699-char remark
-
2026-06-09$159,900 Active 1 DOM
ⓘ Source: listings_history table (triggers on properties + properties_extension) + one-shot
backfill from property_details.listing_events for pre-trigger history.
Climate risk First Street
- Flood 6/10 Major FEMA zone X (unshaded) · 68% chance over 30 yrs
- Wildfire 5/10 Major
- Heat 4/10 Moderate 7 d/yr ≥92°F today · 16 d/yr by 30 yrs out
- Wind 1/10 Low
- Air quality 9/10 Extreme 18 unhealthy d/yr today · 20 by 30 yrs out
Nearby sold comps map
Loading sold comps map…
Walkable amenities ~0.75 mi
Loading nearby amenities…
Taxation est. · year 1
- Rental income
- $36,139
- − Mortgage interest
- −$8,957
- − Property taxes
- −$2,398
- − Insurance
- −$800
- − Repairs & maintenance
- −$2,891
- − Management
- −$2,891
- − Depreciation
- −$4,652
- Taxable income
- $13,551
- Est. tax owed @ 24.0%
- −$3,252
- After-tax cash flow
- $12,038/yr
For passive investors: Depreciation is non-cash, so a rental often shows a tax loss while cash-flowing — sheltering income. Rental losses are passive: they offset passive income freely, and up to $25,000/yr can offset ordinary (W-2) income if you actively participate and your MAGI is under $100k (phasing out to $0 by $150k); unused losses carry forward. On sale, claimed depreciation is recaptured at up to 25%, and gains may owe capital-gains tax (a 1031 exchange can defer both). Figures are a year-1 estimate at your 24.0% rate — not tax advice; consult a CPA.
Condition & rehab AI · 6 photos
This 1977 manufactured home in the Windsor Mobile Country Club community is in good condition with minimal repairs needed. It offers a spacious and inviting living area with 2 bedrooms and 2 bathrooms. The home is move-in ready with a few cosmetic updates that can significantly increase its value.
Value-add opportunities
- Both Paint interior walls — Fresh paint can enhance the home's curb appeal and interior aesthetics.
- Both Replace carpet with hardwood or tile — Hardwood or tile flooring can increase the home's value and appeal to a broader range of buyers.
- Both Install new kitchen appliances — Upgrading appliances can make the kitchen more functional and appealing to potential buyers/renters.
- Both Replace countertops with quartz or granite — Quartz or granite countertops can add value and appeal to the kitchen space.
- Both Install new bathroom fixtures — Fresh fixtures can improve the bathroom's functionality and appearance, enhancing the home's overall value.
- Both Replace carpet with hardwood or tile — Hardwood or tile flooring can increase the home's value and appeal to a broader range of buyers/renters.
Renovation cost estimate screening
Value-add ROI direction
- Both Paint interior walls — Fresh paint can enhance the home's curb appeal and interior aesthetics. ↑
- Both Replace carpet with hardwood or tile — Hardwood or tile flooring can increase the home's value and appeal to a broader range of buyers. ↑
- Both Install new kitchen appliances — Upgrading appliances can make the kitchen more functional and appealing to potential buyers/renters. ↑
- Both Replace countertops with quartz or granite — Quartz or granite countertops can add value and appeal to the kitchen space. ↑
- Both Install new bathroom fixtures — Fresh fixtures can improve the bathroom's functionality and appearance, enhancing the home's overall value. ↑
- Both Replace carpet with hardwood or tile — Hardwood or tile flooring can increase the home's value and appeal to a broader range of buyers/renters. ↑
ⓘ Cost ranges are severity-bucket heuristics (US national rule-of-thumb). Get contractor quotes + a written scope before underwriting a rehab budget.
Schools (NCES district)
- District
- Windsor Unified
- NCES district ID
- 0600034
- Math proficiency
- 25% ▼ -10.00%
- Reading proficiency
- 25% ▼ -22.00%
- Median HH income
- $81,297
- Composite
- 25.06/100
- National rank
- #7541
- State rank
- #362 of 517 in CA
Livability — Windsor
- Score
- 71/100
- State rank
- #210
- US rank
- #6671
Category grades
Schools grade is shown separately in the Schools card above.
Census & demographics
- Census place
- Windsor, CA
- County
- Sonoma County · 449,805 people
- City population
- 27,429
- Metro
- Santa Rosa-Petaluma, CA
- Population (ZIP)
- 27,429
- Household income
- $134,211
- Rent vs Own
- Severe rent burden
- 628.0
Population outlook (Sonoma County) Hauer SSP2
- Today (2025)
- 539,935 people
- By 2030
- 554,870 · +2.8%
- By 2040
- 573,262 · +6.2%
- By 2050
- 580,715 · +7.6%
- By 2075
- 579,229 · +7.3%
- By 2100
- 547,835 · +1.5%
Race, ethnicity, and origin ACS 2023
- Neighborhood character
- Majority White (59%)
- Race & ethnicity
- White 59% Hispanic / Latino 33% Two or more races 13% Native American 4% Asian 2% Black 1%
- Hispanic origin (detail)
- Mexican 28%
- Common ancestry
- Italian 4% Slovak 3% Lithuanian 2%
- Foreign-born
- 14% · Canada
- Languages at home
- 72% English-only · Spanish 25% French/Haitian/Cajun 1% Vietnamese 1%
Political lean MEDSL · Sonoma
- 2024 margin
- Solid D (+46.2) · D 71.4% · R 25.2% · Other 3.3%
- 2008→2024 swing
- -3.4pp toward R · 2008: 49.6pp · 2024: 46.2pp
- All cycles
- 2024: D+46.2 2020: D+51.5 2016: D+47.9 2012: D+44.9 2008: D+49.6
Not yet ingested
- Civics
- —
Market trends
- HPI YoY
- ▼ -348.03%
- Current HPI
- 249.6052
- Rent YoY
- —
- Metro
- Santa Rosa-Petaluma, CA
- State GDP YoY
- ▲ 3.21%
- F500 in state
- 116
Industry mix (Fortune 500 HQ in CA)
| Industry | F500 HQs | Revenue |
|---|---|---|
| Technology | 27 | $1,492B |
|
||
| Financial Services | 3 | $174B |
|
||
| Retail | 3 | $44B |
|
||
| Insurance | 3 | $26B |
|
||
| Media / Entertainment | 2 | $115B |
|
||
| Pharmaceuticals / Biotech | 2 | $62B |
|
||
Price history
1 event — show timeline
- 2026-06-08 Listed $159,900 BAREIS
Cash-flow waterfall
monthlySold comps — $/sqft
last 12 mo · ≤1 miLoading sold comps…