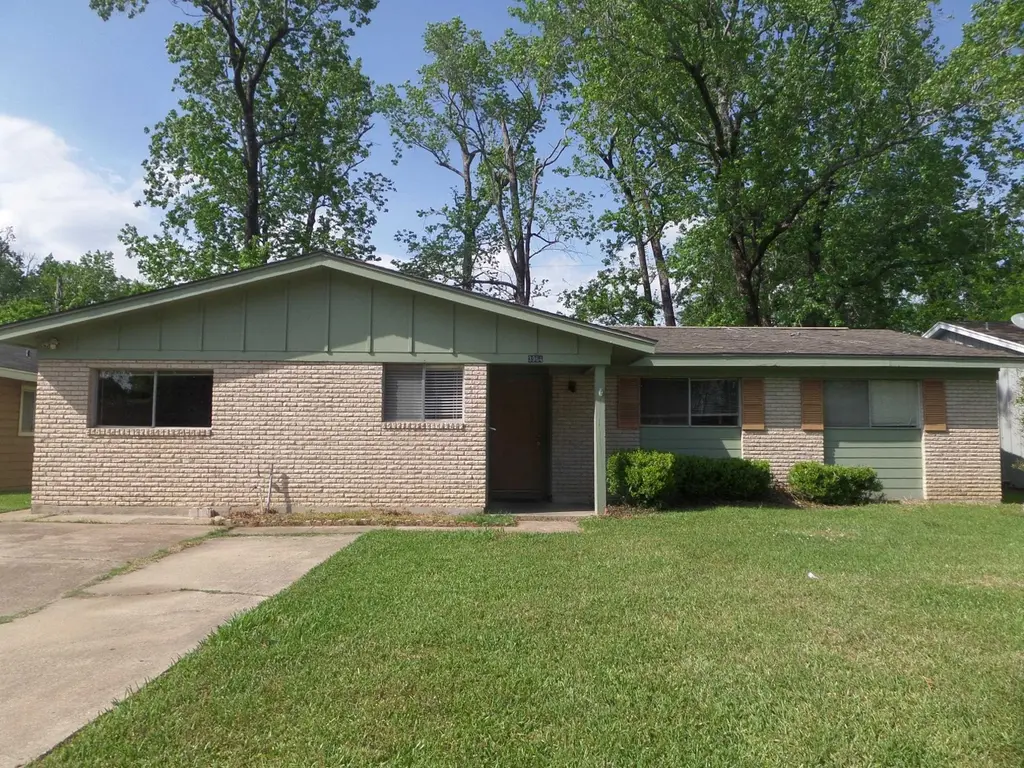
3964 Bristol Dr · Beaumont, TX
Flood risk 7/10 · Major
- FEMA flood zone
- X
- Chance of flooding over 30 yrs
- 0.96%
- Est. flood insurance / yr
- $507 – $1,088
Fire risk 1/10 · Minimal
- Est. fire insurance / yr
- $1,222 – $2,270
Heat risk 9/10 · Severe
- Hot days now (above 110°F)
- 7 days/yr
- Hot days in 30 yrs
- 24 days/yr
Wind risk 9/10 · Severe
- Chance of severe wind over 30 yrs
- 99.0%
Air-quality risk 2/10 · Minimal
- Unhealthy air days now
- 1 days/yr
- Unhealthy air days in 30 yrs
- 1 days/yr
Risk factors via First Street. Map © Google.
Why this score? — see what drove the C grade
The composite is a weighted blend of 9 inputs, each scored 0–100. Each bar is that input's sub-score; the figure is the points it added to the 100-point composite (weight × sub-score).
- Cash flow +20.6/30.0
- ARV discount +12.4/15.0
- DSCR +6.5/10.0
- 1% rule +6.0/10.0
- Livability +3.2/5.0
- Rent growth +2.5/5.0
- Condition / age +2.5/5.0
- Schools +1.5/10.0
- Appreciation +0.0/10.0
$145,000
🖨 Deal sheet 📄 Offer letter ✓ Due diligence
Listing remarks MLS
West End Home for a Great Price. 3/2 in the Heart of the West End. Extra living room and inside laundry. Kitchen includes refrigerator. Wood burning fireplace in living area. Large backyard with lots of storage.
Key facts
- Lots of storage
- Large backyard
- Extra living room
Tags
Neighborhood map
What this means for you Summary
Snapshot
- This is a 3-bed/2.0-bath single-family listed at $145k.
Deal economics
- At list price, monthly cash flow is $127 ($2k/yr) — positive.
- The deal already cash-flows at list — no discount required.
- Meets the 1% rule at list price ($2k rent vs $145k).
- Recommended offer: $136k (6.0% below list) — sets the bar for market timing.
- Cap rate 7.9% vs local median 5.3% in Beaumont — top-decile yield for the area; either an underpriced asset or a hidden risk that comps aren't pricing in. Stress-test before assuming the spread holds.
Location & tenants
- Location reads 64/100 on livability (#739 in TX) — a middle-class / working-renter tenant base. Strengths: cost of living A+, housing A+, health & safety A+; Watch: employment D, schools D-, crime F.
- Beaumont ISD (urban): math 14% / reading 22% proficiency, ranked #789 of 826 in TX (top 96%) — low school quality limits family demand, transient renter base, plan for 1-2y turnover; 69% free/reduced lunch — lower-income household profile, screen leases tightly.
- Market conditions: 151 active listings in the ZIP; 19 comparable units currently listed for rent nearby; rentals at typical pace (median 23d on market — plan ~3-4 weeks tenant-placement turnaround); 343 units permitted in Jefferson County in 2024 (0 in 5+ unit buildings).
Forward outlook
- Local home prices are declining (-3.0%/yr); year-one equity from $1k of loan paydown is wiped out by about $4k of value loss. Plan a longer hold.
Negotiation context
- It's been on market 67 days — a 6% lower offer ($136k) is reasonable based on typical stale-listing flexibility.
- 3 sale attempts since 2y ago with the ask held roughly flat each time — persistent listings suggest the price (not the market) is what's stuck; bring a comps-based counter.
Risks & watch-outs
- Watch-outs: flood insurance adds $66/mo.
- Climate carrying-cost: major flood risk; severe wind risk, 99% chance of damaging wind over 30y; extreme-heat days projected 7→24/yr by 2055 (HVAC capex compounding) — expect insurance premiums to compound above CPI over the hold.
Questions for the listing agent
- It's been on market 67 days. Have you received any prior offers? Is the seller open to a 6% concession, seller financing, or rate buy-down credit?
- Built in 1962 — when were the roof, HVAC, electrical panel, plumbing, and water heater last replaced?
- What's the actual annual flood-insurance premium (NFIP or private), and is the property in a SFHA with mandatory coverage?
- Why hasn't it sold? Are there any deal-killer items the seller is aware of (foundation, flood, title, zoning, code violations)?
- Is there a deadline driving the sale (1031 exchange, divorce, estate, relocation)? That informs how much negotiation room exists.
- Schools are D-rated, which usually means shorter tenancies and higher turnover. Who's the typical renter profile here, and what's been the actual vacancy rate?
- Crime grade is F in this area — have there been break-ins, vandalism, or insurance claims at this property in the last 3 years? What carrier currently insures it and at what premium?
- What's the average days-on-market for RENTAL listings here right now (not sales)? A rising rental-DOM trend means longer vacancies and softer asking-rent achievability than the comps imply.
- What's the recent tenant-quality profile in this submarket — average credit score on applications, eviction rate, late-payment / NSF rate, and stable-employment percentage? A property-management company in the area should have these aggregated.
- How much new for-sale + rental construction is in the pipeline within 1–3 miles? Heavy new supply typically softens prices + rents 12–24 months out; constrained supply supports both.
Investment metrics
- 1% rule
- 1.10% ✓
- Cap rate
- 7.89%
- Cash-on-cash
- 5.70%
- DSCR
- 1.25
- GRM
- 7.6
CMA / ARV
- ARV (median comp)
- $162,867
- List price
- $145,000
- Delta
- -10.97%
- Verdict
- UNDERPRICED
- Comps
- 20 within 1.0 mi
Show comp detail 6 sales within ~0.75 mi
| Address | Dist | Beds/Ba | Sqft | Sold | Price | $/sf | Match |
|---|---|---|---|---|---|---|---|
| 92 Sparrow Way | 0.42mi | 3/2.0 | 1,305 (-0%) | 3mo | $169,900 | $130 | 78 |
| 98 Sparrow Way | 0.39mi | 3/2.0 | 1,275 (-2%) | 1mo | $198,000 | $155 | 77 |
| 3966 Broadmoor Dr | 0.09mi | 4/1.5 (+1) | 1,502 (+15%) | 2mo | $115,000 | $77 | 62 |
| 137 Briggs St | 0.21mi | 3/2.0 | 1,427 (+9%) | 20mo | $178,000 | $125 | 59 |
| 4375 W Broadway St | 0.60mi | 3/2.0 | 1,191 (-9%) | 6mo | $169,000 | $142 | 52 |
| 520 24th St | 0.62mi | 3/2.0 | 1,171 (-10%) | 5mo | $159,900 | $137 | 50 |
Match score weights: distance 35% · size 25% · config 20% · recency 20%. Top-matched comps best support the ARV.
Projected returns pro-forma
-3.0% appreciation · 3.0% rent growth · sell at horizon
- IRR
- -10.4%
- Equity multiple
- 0.62×
- Total profit
- $-15,332
- Equity at exit
- $21,620
- IRR
- -0.9%
- Equity multiple
- 0.94×
- Total profit
- $-2,542
- Equity at exit
- $12,537
Cash invested: $40,600 (down + closing). Projections, not guarantees.
Landlord ↔ Tenant lean methodology
- Overall (STATE)
- 87 Strongly Landlord-Friendly
- State Texas
- 87 Strongly Landlord-Friendly · R+5
- County
- — inherits STATE
- City
- — inherits STATE
ZIP-level market 77707
- Active inventory
- 151
- Price-to-rent
- 7.6×
Monthly cashflow live
- Estimated rent
- $1,598 high interval (Pro) →
- Mortgage (P&I)
- −$760
- Tax from tax record
- −$248 /mo · $2,982/yr
- Insurance
- −$60
- Flood insurance flood zone
- −$66 /mo · $798/yr
- HOA
- −$0
- Vacancy / Maint / Mgmt
- −$336
- Net cashflow
- $127
Break-even live
UW: 25.0% down · 7.5% · 30yr · 1.5% tax · 5.0% vac · 8.0% maint · 8.0% mgmt
Financing live
Cash to close
- Down payment
- $36,250
- Closing costs
- $4,350
- Reserves months
- —
- Total cash needed
- —
Loan-product check · same deal, 3 products live
Conventional
25% down · 7.5% · 30yr
- Down + closing
- —
- Monthly P&I
- —
- Monthly cashflow
- —
- DSCR
- —
- Eligible?
- —
Personal DTI + credit; lowest rate.
DSCR
20% down · 8.5% · 30yr
- Down + closing
- —
- Monthly P&I
- —
- Monthly cashflow
- —
- DSCR
- —
- Eligible?
- —
No personal income docs; deal must DSCR.
Hard money
10% down · 12.0% · 12mo
- Down + closing
- —
- Monthly P&I
- —
- Monthly cashflow
- —
- DSCR
- —
- Eligible?
- —
Short-term bridge; refi at stabilization.
Rent comps 19 comps
| Address | Beds | Baths | Sqft | Rent | $/sqft | DOM | Units | Dist |
|---|---|---|---|---|---|---|---|---|
| 340 Maxwell Dr Beaumont, TX | 3.0 | 2.5 | 1824 | $2,100 | $1.15 | 43d | 1 | 0.29mi |
| 3720 Laurel Ave Unit Laurel Ave unit 12 Beaumont, TX | 2.0 | 1.5 | 1188 | $1,095 | $0.92 | 23d | 1 | 0.47mi |
| 3720 Laurel St #6 Beaumont, TX | 2.0 | 1.5 | 1152 | $1,095 | $0.95 | 13d | 1 | 0.49mi |
| 5195 Oriole Dr Beaumont, TX | 3.0 | 2.0 | 1814 | $2,000 | $1.10 | 43d | 1 | 0.50mi |
| 5110 Laurel St Beaumont, TX | 3.0 | 2.0 | 1303 | $1,995 | $1.53 | 21d | 1 | 0.53mi |
| 355 N 18th St Beaumont, TX | 3.0 | 2.0 | 1050 | $1,395 | $1.33 | 43d | 1 | 0.63mi |
| 85 E Caldwood Dr Beaumont, TX | 2.0 | 1.5 | 1330 | $1,223 | $0.92 | 43d | 2 | 0.66mi |
| 85 E Caldwood Dr #6 Beaumont, TX | 2.0 | 1.5 | 1331 | $1,250 | $0.94 | 23d | 1 | 0.66mi |
| 565 25th St Beaumont, TX | 2.0 | 2.0 | 1128 | $1,650 | $1.46 | 13d | 1 | 0.67mi |
| 745 Jeny Ln Beaumont, TX | 3.0 | 1.0 | 1008 | $1,190 | $1.18 | 23d | 1 | 0.87mi |
| 551 Georgetown St Beaumont, TX | 2.0 | 1.5 | 1317 | $1,300 | $0.99 | 43d | 1 | 1.03mi |
| 458 Belvedere Dr Beaumont, TX | 3.0 | 2.0 | 1465 | $1,595 | $1.09 | 21d | 1 | 1.09mi |
| 1425 Washington Village Pkwy Beaumont, TX | 1.0–2.0 | 1.0 | 861 | $1,065 | $1.24 | 13d | 1 | 1.14mi |
| 1215 Longfellow Dr Beaumont, TX | 1.0–2.0 | 1.0–2.0 | 834 | $1,545 | $1.85 | 13d | 15 | 1.25mi |
| 770 Peyton Dr Beaumont, TX | 3.0 | 2.0 | 1769 | $1,895 | $1.07 | 43d | 1 | 1.29mi |
| 2640 Harrison Ave Beaumont, TX | 3.0 | 1.0 | 1158 | $1,295 | $1.12 | 23d | 1 | 1.34mi |
| 2565 Harrison Ave Beaumont, TX | 3.0 | 2.0 | 1789 | $2,150 | $1.20 | 43d | 1 | 1.40mi |
| 6250 Ivanhoe Ln Beaumont, TX | 1.0–2.0 | 1.0–2.0 | 885 | $1,604 | $1.81 | 13d | 9 | 1.43mi |
| 520 Dowlen Rd Beaumont, TX | 1.0–2.0 | 1.0–2.0 | 940 | $1,050 | $1.12 | 13d | 10 | 1.49mi |
Listing history 20 events
-
2026-06-18status $145,000 Active 67 DOM
-
2026-06-09status $145,000 Pending 67 DOM
-
2026-06-08days on market $145,000 Active 67 DOM
-
2026-06-07days on market $145,000 Active 66 DOM
-
2026-06-03days on market $145,000 Active 62 DOM
-
2026-06-02days on market $145,000 Active 61 DOM
-
2026-06-01days on market $145,000 Active 60 DOM
-
2026-05-31days on market $145,000 Active 59 DOM
-
2026-05-30days on market $145,000 Active 58 DOM
-
2026-05-12price $145,000 211-char remark
Show marketing remark (211 chars)
West End Home for a Great Price. 3/2 in the Heart of the West End. Extra living room and inside laundry. Kitchen includes refrigerator. Wood burning fireplace in living area. Large backyard with lots of storage.
-
2026-04-15price $147,500 211-char remark
Show marketing remark (211 chars)
West End Home for a Great Price. 3/2 in the Heart of the West End. Extra living room and inside laundry. Kitchen includes refrigerator. Wood burning fireplace in living area. Large backyard with lots of storage.
-
2026-04-02$150,000 Active 211-char remark
Show marketing remark (211 chars)
West End Home for a Great Price. 3/2 in the Heart of the West End. Extra living room and inside laundry. Kitchen includes refrigerator. Wood burning fireplace in living area. Large backyard with lots of storage.
-
2024-06-15historical $1,500
-
2024-06-07$1,500
-
2024-04-16soldstatus
-
2024-04-15soldstatus Closed
-
2024-03-29historical
-
2024-03-01$130,000
-
2023-05-01soldstatus
-
2018-12-21soldstatus
ⓘ Source: listings_history table (triggers on properties + properties_extension) + one-shot
backfill from property_details.listing_events for pre-trigger history.
Tax reassessment forecast TX · Resets to sale price
- Current annual tax
- $2,982 · $248/mo
- Projected year-2 tax
- $2,982 · $248/mo
- Expected delta
- $0/yr ($0/mo · 0.0%)
ⓘ Screening estimate from a state-policy table — verify with the county assessor before closing.
Climate risk First Street
- Flood 7/10 Severe FEMA zone X · 96% chance over 30 yrs
- Wildfire 1/10 Low
- Heat 9/10 Extreme 7 d/yr ≥110°F today · 24 d/yr by 30 yrs out
- Wind 9/10 Extreme 99% chance of damaging wind over 30 yrs
- Air quality 2/10 Low 1 unhealthy d/yr today · 1 by 30 yrs out
Nearby sold comps map
Loading sold comps map…
Walkable amenities ~0.75 mi
Loading nearby amenities…
Taxation est. · year 1
- Rental income
- $19,174
- − Mortgage interest
- −$8,122
- − Property taxes
- −$2,982
- − Insurance
- −$1,522
- − Repairs & maintenance
- −$1,534
- − Management
- −$1,534
- − Depreciation
- −$4,218
- Taxable loss
- −$739
- Est. tax savings @ 24.0%
- +$177
- After-tax cash flow
- $1,696/yr
For passive investors: Depreciation is non-cash, so a rental often shows a tax loss while cash-flowing — sheltering income. Rental losses are passive: they offset passive income freely, and up to $25,000/yr can offset ordinary (W-2) income if you actively participate and your MAGI is under $100k (phasing out to $0 by $150k); unused losses carry forward. On sale, claimed depreciation is recaptured at up to 25%, and gains may owe capital-gains tax (a 1031 exchange can defer both). Figures are a year-1 estimate at your 24.0% rate — not tax advice; consult a CPA.
Schools (NCES district)
- District
- Beaumont ISD
- NCES district ID
- 4809670
- Math proficiency
- 14% ▼ -13.00%
- Reading proficiency
- 22% ▼ -7.00%
- Median HH income
- $41,683
- Composite
- 15.43/100
- National rank
- #9316
- State rank
- #789 of 826 in TX
Livability — Beaumont
- Score
- 64/100
- State rank
- #739
- US rank
- #13710
Category grades
Schools grade is shown separately in the Schools card above.
Census & demographics
- Census place
- Beaumont, TX
- County
- Jefferson County · 203,592 people
- City population
- 125,901
- Metro
- Beaumont-Port Arthur, TX
- Population (ZIP)
- 18,323
- Household income
- $69,756
- Rent vs Own
- Severe rent burden
- 596.0
Population outlook (Jefferson County) Hauer SSP2
- Today (2025)
- 259,015 people
- By 2030
- 260,685 · +0.6%
- By 2040
- 263,309 · +1.7%
- By 2050
- 265,237 · +2.4%
- By 2075
- 270,193 · +4.3%
- By 2100
- 255,628 · -1.3%
Race, ethnicity, and origin ACS 2023
- Neighborhood character
- Highly diverse neighborhood (Simpson 0.70)
- Race & ethnicity
- Black 40% White 28% Hispanic / Latino 23% Two or more races 18% Asian 6%
- Hispanic origin (detail)
- Mexican 19%
- Common ancestry
- Lithuanian 3% Italian 1% Romanian 1%
- Foreign-born
- 12% · Canada, Vietnam
- Languages at home
- 75% English-only · Spanish 19% Vietnamese 3% Other Indo-European 1%
Political lean MEDSL · Jefferson
- 2024 margin
- Lean R (+8.9) · D 45.1% · R 54.0%
- 2008→2024 swing
- -11.1pp toward R · 2008: 2.2pp · 2024: -8.9pp
- All cycles
- 2024: R+8.9 2020: R+1.6 2016: R+0.5 2012: D+1.6 2008: D+2.2
Not yet ingested
- Civics
- —
Market trends
- HPI YoY
- ▼ -163.16%
- Current HPI
- 167.8109
- Rent YoY
- —
- Metro
- Beaumont-Port Arthur, TX
- State GDP YoY
- ▲ 3.95%
- F500 in state
- 110
Industry mix (Fortune 500 HQ in TX)
| Industry | F500 HQs | Revenue |
|---|---|---|
| Energy | 16 | $1,198B |
|
||
| Technology | 5 | $198B |
|
||
| Engineering / Construction | 4 | $72B |
|
||
| Energy Services | 3 | $60B |
|
||
| Utilities | 3 | $41B |
|
||
| Healthcare | 2 | $330B |
|
||
Price history
+11.5% since first listed11 events — show timeline
- 2026-05-12 Price Changed $145,000 BBOR
- 2026-04-15 Price Changed $147,500 BBOR
- 2026-04-02 Listed $150,000 BBOR
- 2024-06-15 Rental Removed $1,500 BBOR
- 2024-06-07 Listed for Rent $1,500 BBOR
- 2024-04-16 Sold (Public Records) — Public Records
- 2024-04-15 Sold (MLS) — BBOR
- 2024-03-29 Delisted — BBOR
- 2024-03-01 Listed $130,000 BBOR
- 2023-05-01 Sold (Public Records) — Public Records
- 2018-12-21 Sold (Public Records) — Public Records
Property tax history
+5.1%/yrLatest (2025): $2,982 · -0.8% YoY. Source: county tax records.
Cash-flow waterfall
monthlySold comps — $/sqft
last 12 mo · ≤1 miLoading sold comps…