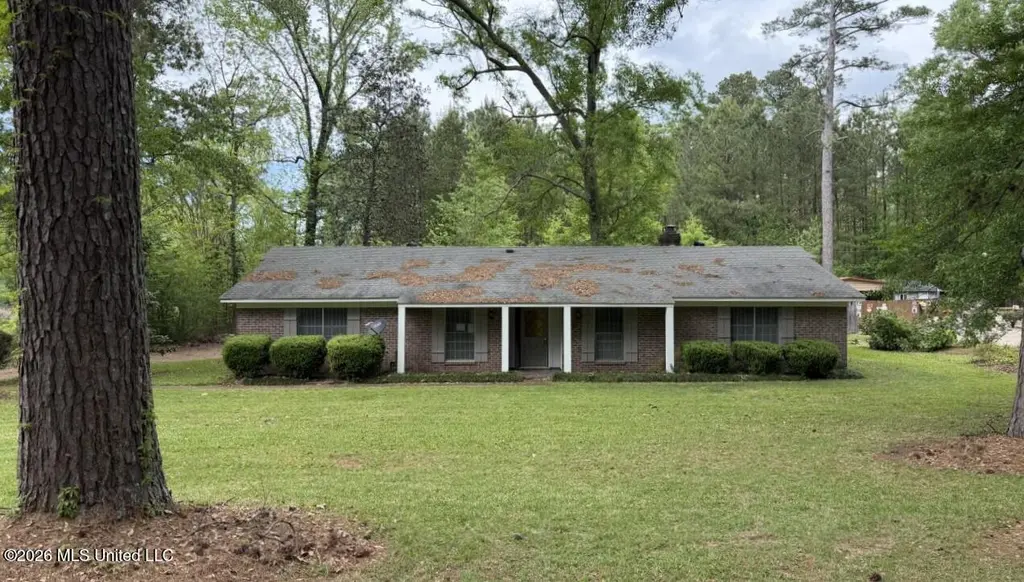
118 Scottdale Dr · Jackson, MS
Flood risk 8/10 · Major
- FEMA flood zone
- X (unshaded)
- Chance of flooding over 30 yrs
- 0.99%
- Est. flood insurance / yr
- $507 – $1,088
Fire risk 3/10 · Minor
- Est. fire insurance / yr
- $1,241 – $2,305
Heat risk 7/10 · Major
- Hot days now (above 108°F)
- 7 days/yr
- Hot days in 30 yrs
- 20 days/yr
Wind risk 8/10 · Major
- Chance of severe wind over 30 yrs
- 80.0%
Air-quality risk 1/10 · Minimal
- Unhealthy air days now
- 0 days/yr
- Unhealthy air days in 30 yrs
- 0 days/yr
Risk factors via First Street. Map © Google.
Why this score? — see what drove the B grade
The composite is a weighted blend of 9 inputs, each scored 0–100. Each bar is that input's sub-score; the figure is the points it added to the 100-point composite (weight × sub-score).
- Cash flow +30.0/30.0
- ARV discount +15.0/15.0
- DSCR +10.0/10.0
- 1% rule +8.6/10.0
- Rent growth +3.6/5.0
- Livability +3.4/5.0
- Condition / age +2.5/5.0
- Schools +1.1/10.0
- Appreciation +0.0/10.0
$131,500
🖨 Deal sheet 📄 Offer letter ✓ Due diligence
Listing remarks
Charming updated retreat in serene Southwood Estates! Nestled among the woods on a spacious half acre lot at 118 Scottdale Dr, this beautiful 4-bed, 3-bath ranch offers 2,010 sq ft of inviting living space just minutes from Jackson conveniences. Step inside to soaring high ceilings, and sleek stained concrete floors that flow throughout. The kitchen shines with granite counters, stainless steel appliances, and an open layout perfect for entertaining. Relax in the bright living room beside the cozy wood-burning fireplace, or unwind in generous bedrooms with walk-in closets. Outside, enjoy lush landscaping, a new-style architectural shingle roof, and a roomy covered carport. Come make this o
Key facts
- Open layout
- Granite counters
- 0.57 acre lot
Tags
Property features AI
Exterior
- Parking: Attached garage; 4-space carport
- Security: Smoke detectors
- Utilities: Public water; Public sewer; Other utilities (see remarks)
- Home design: Single-family house; One level
- Construction: Brick and wood siding construction; Slab foundation; Architectural shingle roof; Built (year source: appraiser)
- Exterior features: Patio with slab; Partial chain link fence; Additional exterior features (see remarks)
Interior
- Kitchen: Dishwasher; Other/see remarks
- Flooring: Stamped; Stone; Tile
- Bathrooms: 3 full bathrooms
- Heating & cooling: Central heating (natural gas); Fireplace heating; Central air conditioning; Ceiling fans
- Interior features: Eat-in kitchen; Entrance foyer; Soaking tub; Storage; Fireplace
- Laundry & utility: Dedicated laundry room
Neighborhood map
What this means for you Summary
Snapshot
- This is a 4-bed/3.0-bath single-family listed at $132k.
Deal economics
- At list price, monthly cash flow is $456 ($5k/yr) — positive.
- The deal already cash-flows at list — no discount required.
- Meets the 1% rule at list price ($2k rent vs $132k).
- Recommended offer: $128k (3.0% below list) — sets the bar for market timing.
Location & tenants
- Location reads 68/100 on livability (#66 in MS) — a middle-class / working-renter tenant base. Strengths: commute A+, cost of living A+, housing A+; Watch: amenities F, employment F, health & safety F.
- Jackson Public School District (urban): math 9% / reading 18% proficiency, ranked #112 of 130 in MS (top 86%) — low school quality limits family demand, transient renter base, plan for 1-2y turnover; 88% free/reduced lunch — lower-income household profile, screen leases tightly.
- Zoned schools: Sykes Elementary School (math 8% / reading 12%, grade F, #319 of 375 statewide, top 88%, 325 students, 100% FRL); Whitten Middle School (math 4% / reading 11%, grade F, #168 of 179 statewide, top 94%, 338 students, 100% FRL); Forest Hill High School (math 5% / reading 15%, grade F, #168 of 197 statewide, top 86%, 991 students, 100% FRL).
- Market conditions: Rents rising fast (+4.2%/yr); 302 active listings in the ZIP; 2 comparable units currently listed for rent nearby; 167 units permitted in Hinds County in 2024 (0 in 5+ unit buildings).
- This rent runs 42% of the median local income ($51k/yr) — at the standard rent-burdened threshold; future hikes will face affordability resistance.
Forward outlook
- Local home prices are declining (-3.0%/yr); year-one equity from $909 of loan paydown is wiped out by about $4k of value loss. Plan a longer hold.
- Hinds County population projected to shrink 6% by 2050 — rents likely to lag national; underwrite the cash flow, not the appreciation.
- At projected returns (-3.0% appreciation + 4.2% rent growth), your $37k cash investment doubles in ~8 years — after that, you're playing with house money.
Negotiation context
- It's been on market 51 days — a 3% lower offer ($128k) is reasonable based on typical stale-listing flexibility.
- 10 sale attempts since 21y ago; this cycle's ask has dropped $44k (25%) from the opening price — seller is motivated, your offer sets the floor, not the list.
Risks & watch-outs
- Watch-outs: flood insurance adds $66/mo.
- Climate carrying-cost: severe flood risk; severe wind risk, 80% chance of damaging wind over 30y; extreme-heat days projected 7→20/yr by 2055 (HVAC capex compounding) — expect insurance premiums to compound above CPI over the hold.
Questions for the listing agent
- It's been on market 51 days. Have you received any prior offers? Is the seller open to a 3% concession, seller financing, or rate buy-down credit?
- Built in 1972 — when were the roof, HVAC, electrical panel, plumbing, and water heater last replaced?
- What's the actual annual flood-insurance premium (NFIP or private), and is the property in a SFHA with mandatory coverage?
- Is there a deadline driving the sale (1031 exchange, divorce, estate, relocation)? That informs how much negotiation room exists.
- Schools are F-rated, which usually means shorter tenancies and higher turnover. Who's the typical renter profile here, and what's been the actual vacancy rate?
- What's the average days-on-market for RENTAL listings here right now (not sales)? A rising rental-DOM trend means longer vacancies and softer asking-rent achievability than the comps imply.
- What's the recent tenant-quality profile in this submarket — average credit score on applications, eviction rate, late-payment / NSF rate, and stable-employment percentage? A property-management company in the area should have these aggregated.
- How much new for-sale + rental construction is in the pipeline within 1–3 miles? Heavy new supply typically softens prices + rents 12–24 months out; constrained supply supports both.
Investment metrics
- 1% rule
- 1.36% ✓
- Cap rate
- 11.06%
- Cash-on-cash
- 17.02%
- DSCR
- 1.76
- GRM
- 6.1
CMA / ARV
- ARV (median comp)
- $189,162
- List price
- $131,500
- Delta
- -30.48%
- Verdict
- UNDERPRICED
- Comps
- 20 within 1.0 mi
Show comp detail 4 sales within ~0.75 mi
| Address | Dist | Beds/Ba | Sqft | Sold | Price | $/sf | Match |
|---|---|---|---|---|---|---|---|
| 13 Rob Ln | 0.08mi | 3/2.0 (-1) | 2,085 (+2%) | 12mo | $119,900 | $58 | 74 |
| 5232 Old Byram Rd | 0.62mi | 3/2.5 (-1) | 2,201 (+8%) | 5mo | $289,000 | $131 | 47 |
| 5130 Sycamore Dr | 0.56mi | 3/2.0 (-1) | 1,765 (-14%) | 22mo | $99,900 | $57 | 24 |
| 5257 Sycamore Dr | 0.70mi | 3/2.0 (-1) | 1,739 (-15%) | 18mo | $155,000 | $89 | 18 |
Match score weights: distance 35% · size 25% · config 20% · recency 20%. Top-matched comps best support the ARV.
Projected returns pro-forma
-3.0% appreciation · 4.23% rent growth · sell at horizon
- IRR
- 6.9%
- Equity multiple
- 1.27×
- Total profit
- $10,007
- Equity at exit
- $19,607
- IRR
- 17.3%
- Equity multiple
- 2.51×
- Total profit
- $55,724
- Equity at exit
- $11,370
Cash invested: $36,820 (down + closing). Projections, not guarantees.
Landlord ↔ Tenant lean methodology
- Overall (STATE)
- 90 Strongly Landlord-Friendly
- State Mississippi
- 90 Strongly Landlord-Friendly · R+11
- County
- — inherits STATE
- City
- — inherits STATE
ZIP-level market 39212
- Home prices YoY
- -11.7%
- Rents YoY
- 4.2%
- Active inventory
- 302
- Price-to-rent
- 6.1×
Monthly cashflow live
- Estimated rent
- $1,786 medium interval (Pro) →
- Mortgage (P&I)
- −$690
- Tax from tax record
- −$144 /mo · $1,730/yr
- Insurance
- −$55
- Flood insurance flood zone
- −$66 /mo · $798/yr
- HOA
- −$0
- Vacancy / Maint / Mgmt
- −$375
- Net cashflow
- $456
Break-even live
UW: 25.0% down · 7.5% · 30yr · 1.5% tax · 5.0% vac · 8.0% maint · 8.0% mgmt
Financing live
Cash to close
- Down payment
- $32,875
- Closing costs
- $3,945
- Reserves months
- —
- Total cash needed
- —
Loan-product check · same deal, 3 products live
Conventional
25% down · 7.5% · 30yr
- Down + closing
- —
- Monthly P&I
- —
- Monthly cashflow
- —
- DSCR
- —
- Eligible?
- —
Personal DTI + credit; lowest rate.
DSCR
20% down · 8.5% · 30yr
- Down + closing
- —
- Monthly P&I
- —
- Monthly cashflow
- —
- DSCR
- —
- Eligible?
- —
No personal income docs; deal must DSCR.
Hard money
10% down · 12.0% · 12mo
- Down + closing
- —
- Monthly P&I
- —
- Monthly cashflow
- —
- DSCR
- —
- Eligible?
- —
Short-term bridge; refi at stabilization.
Rent comps 2 comps
| Address | Beds | Baths | Sqft | Rent | $/sqft | DOM | Units | Dist |
|---|---|---|---|---|---|---|---|---|
| 306 Gary Daniels Dr Byram, MS | 3.0 | 2.0 | 1517 | $1,595 | $1.05 | 43d | 1 | 1.14mi |
| 257 Gaddy Dr Byram, MS | 3.0 | 2.0 | 1400 | $1,900 | $1.36 | 13d | 1 | 1.50mi |
Listing history 39 events
-
2026-06-18days on market $131,500 Active 51 DOM
-
2026-06-17days on market $131,500 Active 50 DOM
-
2026-06-16days on market $131,500 Active 49 DOM
-
2026-06-15days on market $131,500 Active 48 DOM
-
2026-06-14days on market $131,500 Active 46 DOM
-
2026-06-13pricedays on market $131,500 Active 45 DOM
-
2026-06-10days on market $175,000 Active 43 DOM
-
2026-06-09days on market $175,000 Active 42 DOM
-
2026-06-08days on market $175,000 Active 41 DOM
-
2026-06-07days on market $175,000 Active 40 DOM
-
2026-06-05days on market $175,000 Active 37 DOM
-
2026-06-03days on market $175,000 Active 36 DOM
-
2026-06-02days on market $175,000 Active 35 DOM
-
2026-06-01days on market $175,000 Active 34 DOM
-
2026-05-31days on market $175,000 Active 33 DOM
-
2026-05-30days on market $175,000 Active 32 DOM
-
2026-04-28$175,000 Active 711-char remark
-
2021-10-08historical
-
2021-10-01historical
-
2021-10-01historical
-
2020-12-17soldstatus
-
2020-12-04soldstatus
-
2020-10-02$158,000
-
2020-06-22soldstatus
-
2020-05-19$80,000
-
2009-08-27soldstatus
-
2009-08-27soldstatus
-
2009-05-10$124,500
-
2008-09-30soldstatus
-
2008-09-29soldstatus
-
2008-08-26$84,900
-
2006-11-09$141,500
-
2006-02-27historical
-
2006-01-29
-
2006-01-29historical
-
2006-01-28$145,000
-
2006-01-02$150,000
-
2005-06-15$150,000
-
1979-06-12soldstatus
ⓘ Source: listings_history table (triggers on properties + properties_extension) + one-shot
backfill from property_details.listing_events for pre-trigger history.
Tax reassessment forecast MS · Resets to sale price
- Current annual tax
- $1,730 · $144/mo
- Projected year-2 tax
- $1,730 · $144/mo
- Expected delta
- $0/yr ($0/mo · 0.0%)
ⓘ Screening estimate from a state-policy table — verify with the county assessor before closing.
Climate risk First Street
- Flood 8/10 Severe FEMA zone X (unshaded) · 99% chance over 30 yrs
- Wildfire 3/10 Moderate
- Heat 7/10 Severe 7 d/yr ≥108°F today · 20 d/yr by 30 yrs out
- Wind 8/10 Severe 80% chance of damaging wind over 30 yrs
- Air quality 1/10 Low 0 unhealthy d/yr today · 0 by 30 yrs out
Nearby sold comps map
Loading sold comps map…
Walkable amenities ~0.75 mi
Loading nearby amenities…
Taxation est. · year 1
- Rental income
- $21,428
- − Mortgage interest
- −$7,366
- − Property taxes
- −$1,730
- − Insurance
- −$1,455
- − Repairs & maintenance
- −$1,714
- − Management
- −$1,714
- − Depreciation
- −$3,825
- Taxable income
- $3,623
- Est. tax owed @ 24.0%
- −$870
- After-tax cash flow
- $4,599/yr
For passive investors: Depreciation is non-cash, so a rental often shows a tax loss while cash-flowing — sheltering income. Rental losses are passive: they offset passive income freely, and up to $25,000/yr can offset ordinary (W-2) income if you actively participate and your MAGI is under $100k (phasing out to $0 by $150k); unused losses carry forward. On sale, claimed depreciation is recaptured at up to 25%, and gains may owe capital-gains tax (a 1031 exchange can defer both). Figures are a year-1 estimate at your 24.0% rate — not tax advice; consult a CPA.
Schools (NCES district)
- District
- Jackson Public School District
- NCES district ID
- 2802190
- Math proficiency
- 9% ▼ -14.00%
- Reading proficiency
- 18% ▼ -7.00%
- Median HH income
- $33,234
- Composite
- 10.89/100
- National rank
- #9755
- State rank
- #112 of 130 in MS
Livability — Jackson
- Score
- 68/100
- State rank
- #66
- US rank
- #9695
Category grades
Schools grade is shown separately in the Schools card above.
Census & demographics
- Census place
- Jackson, MS
- County
- Hinds County · 167,040 people
- City population
- 140,204
- Metro
- Jackson, MS
- Population (ZIP)
- 25,659
- Household income
- $50,722
- Rent vs Own
- Severe rent burden
- 1314.0
Population outlook (Hinds County) Hauer SSP2
- Today (2025)
- 242,528 people
- By 2030
- 241,113 · -0.6%
- By 2040
- 235,557 · -2.9%
- By 2050
- 226,946 · -6.4%
- By 2075
- 199,995 · -17.5%
- By 2100
- 164,165 · -32.3%
Race, ethnicity, and origin ACS 2023
- Neighborhood character
- Predominantly Black (86%)
- Race & ethnicity
- Black 86% White 9% Hispanic / Latino 3% Two or more races 3%
- Common ancestry
- Serbian 1% Lithuanian 1%
- Foreign-born
- 1% · Canada
- Languages at home
- 97% English-only · Spanish 2%
Political lean MEDSL · Hinds
- 2024 margin
- Solid D (+46.1) · D 72.4% · R 26.3% · Other 1.4%
- 2008→2024 swing
- +7.1pp toward D · 2008: 39.0pp · 2024: 46.1pp
- All cycles
- 2024: D+46.1 2020: D+48.3 2016: D+43.7 2012: D+45.1 2008: D+39.0
Not yet ingested
- Civics
- —
Market trends
- HPI YoY
- ▼ -23.01%
- Current HPI
- 174.4025
- Rent YoY
- ▲ 4.23%
- Metro
- Jackson, MS
- State GDP YoY
- —
- F500 in state
- 0
Price history
-12.3% since first listed24 events — show timeline
- 2026-06-12 Price Changed $131,500 MLSU
- 2026-04-28 Listed $175,000 MLSU
- 2021-10-08 Listing Removed — MLSU
- 2021-10-01 Listing Removed — MLSU
- 2021-10-01 Listing Removed — MLSU
- 2020-12-17 Sold (MLS) — MLSU
- 2020-12-04 Sold (Public Records) — Public Records
- 2020-10-02 Listed $158,000 MLSU
- 2020-06-22 Sold (MLS) — MLSU
- 2020-05-19 Listed $80,000 MLSU
- 2009-08-27 Sold (Public Records) — Public Records
- 2009-08-27 Sold (MLS) — MLSU
- 2009-05-10 Listed $124,500 MLSU
- 2008-09-30 Sold (MLS) — MLSU
- 2008-09-29 Sold (Public Records) — Public Records
- 2008-08-26 Listed $84,900 MLSU
- 2006-11-09 Listed $141,500 MLSU
- 2006-02-27 Listing Removed — MLSU
- 2006-01-29 Listing Removed — MLSU
- 2006-01-29 Listed — MLSU
- 2006-01-28 Listed $145,000 MLSU
- 2006-01-02 Listed $150,000 MLSU
- 2005-06-15 Listed $150,000 MLSU
- 1979-06-12 Sold (Public Records) — Public Records
Property tax history
+0.7%/yrLatest (2025): $1,730 · +230.2% YoY. Source: county tax records.
Cash-flow waterfall
monthlySold comps — $/sqft
last 12 mo · ≤1 miLoading sold comps…