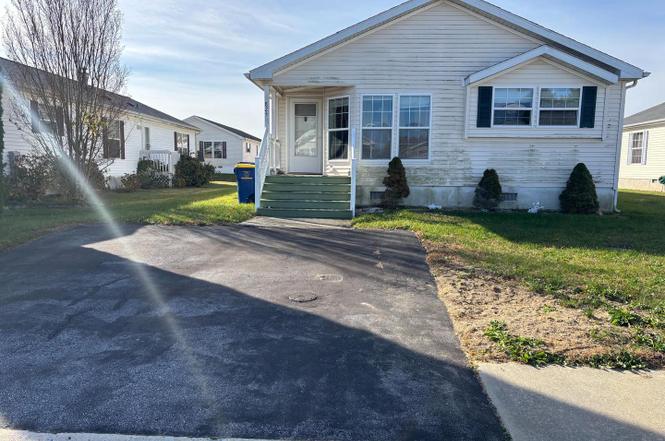
825 Stella St #117 · Smyrna, DE
Flood risk No data
- FEMA flood zone
- —
- Chance of flooding over 30 yrs
- —
- Est. flood insurance / yr
- —
Fire risk No data
- Est. fire insurance / yr
- —
Heat risk No data
- Hot days now (above threshold)
- —
- Hot days in 30 yrs
- —
Wind risk No data
- Chance of severe wind over 30 yrs
- —
Air-quality risk No data
- Unhealthy air days now
- —
- Unhealthy air days in 30 yrs
- —
Risk factors via First Street. Map © Google.
Why this score? — see what drove the B- grade
The composite is a weighted blend of 9 inputs, each scored 0–100. Each bar is that input's sub-score; the figure is the points it added to the 100-point composite (weight × sub-score).
- Cash flow +29.9/30.0
- DSCR +10.0/10.0
- 1% rule +8.7/10.0
- ARV discount +7.5/15.0
- Livability +3.5/5.0
- Schools +2.8/10.0
- Rent growth +2.5/5.0
- Condition / age +2.5/5.0
- Appreciation +0.0/10.0
$130,000
🖨 Deal sheet 📄 Offer letter ✓ Due diligence
Listing remarks
This 2 bedroom, 2 bath manufactured home was built in 2005 and is located in the highly sought after Bon Ayre 55+ community. This home is equipped with central AC and offers the convenience of 2 off street parking spots. The open floor plan makes this the perfect home for entertaining or just relaxing. Plenty of windows surrounding the breakfast nook in kitchen to enjoy your morning coffee. This home is just waiting for you to come enjoy your retirement. This community is designed to make retirement life an active life. There is plenty to do right in this community giving you the convenience of entertainment without having to leave. The community building has a large meeting room, exercise
Key facts
- Central ac
- Breakfast nook
- Open floor plan
Tags
Property features AI
Finance
- Other: Located in a senior community with 55+ age requirement; Community pool included
- Financial info: Monthly land lease payment of $527.46; Ground rent exists
- HOA & community: Annual association fee of $325
Exterior
- Parking: Driveway
- Utilities: Public water; Public sewer; Electric cooling fuel; Natural gas heating and hot water
- Home design: Manufactured property; Land lease ownership; Above-grade finished living space per assessor
- Construction: Vinyl siding
- Exterior features: Community pool; Ground rent exists (monthly land lease of $527.46)
Interior
- Bedrooms: Two bedrooms on the main level
- Bathrooms: Two full bathrooms (both on the main level)
- Heating & cooling: Central heating (natural gas); Central air conditioning (electric); Natural gas hot water
- Interior features: No basement; Living area per assessor
Neighborhood map
What this means for you Summary
Snapshot
- This is a 2-bed/2.0-bath single-family listed at $130k.
Deal economics
- At list price, monthly cash flow is $483 ($6k/yr) — positive.
- The deal already cash-flows at list — no discount required.
- Meets the 1% rule at list price ($2k rent vs $130k).
- Recommended offer: $118k (9.0% below list) — sets the bar for market timing.
- Cap rate 10.7% vs local median 3.5% in Smyrna — top-decile yield for the area; either an underpriced asset or a hidden risk that comps aren't pricing in. Stress-test before assuming the spread holds.
Location & tenants
- Location reads 69/100 on livability (#29 in DE) — a middle-class / working-renter tenant base. Strengths: cost of living A+, housing A+, health & safety A+; Watch: crime D-, amenities F, commute F.
- Smyrna School District (rural): math 22% / reading 39% proficiency, ranked #16 of 26 in DE (top 62%) — families likely to look elsewhere, expect single-tenant / working-renter base with shorter leases.
- Market conditions: 220 active listings in the ZIP; 1,201 units permitted in Kent County in 2024 (116 in 5+ unit buildings).
Forward outlook
- Local home prices are declining (-3.0%/yr); year-one equity from $899 of loan paydown is wiped out by about $4k of value loss. Plan a longer hold.
- Kent County population projected at +22% by 2050 — long-run rental-demand tailwind backs the buy-and-hold thesis.
- At projected returns (-3.0% appreciation + 3.0% rent growth), your $36k cash investment doubles in ~8 years — after that, you're playing with house money.
Negotiation context
- It's been on market 110 days — a 9% lower offer ($118k) is reasonable based on typical stale-listing flexibility.
- 2 sale attempts; this cycle's ask has dropped $10k (7%) from the opening price — seller is motivated, your offer sets the floor, not the list.
Questions for the listing agent
- It's been on market 110 days. Have you received any prior offers? Is the seller open to a 9% concession, seller financing, or rate buy-down credit?
- What does the HOA fee cover, when was the last increase, and are there any pending special assessments or reserve-fund shortfalls?
- Why hasn't it sold? Are there any deal-killer items the seller is aware of (foundation, flood, title, zoning, code violations)?
- Is there a deadline driving the sale (1031 exchange, divorce, estate, relocation)? That informs how much negotiation room exists.
- Crime grade is D in this area — have there been break-ins, vandalism, or insurance claims at this property in the last 3 years? What carrier currently insures it and at what premium?
- What's the average days-on-market for RENTAL listings here right now (not sales)? A rising rental-DOM trend means longer vacancies and softer asking-rent achievability than the comps imply.
- What's the recent tenant-quality profile in this submarket — average credit score on applications, eviction rate, late-payment / NSF rate, and stable-employment percentage? A property-management company in the area should have these aggregated.
- How much new for-sale + rental construction is in the pipeline within 1–3 miles? Heavy new supply typically softens prices + rents 12–24 months out; constrained supply supports both.
Investment metrics
- 1% rule
- 1.37% ✓
- Cap rate
- 10.75%
- Cash-on-cash
- 15.91%
- DSCR
- 1.71
- GRM
- 6.1
CMA / ARV
- ARV (on-the-fly)
- $316,940
- Comps found
- 12
Show comp detail 12 sales within ~0.75 mi
| Address | Dist | Beds/Ba | Sqft | Sold | Price | $/sf | Match |
|---|---|---|---|---|---|---|---|
| 717 Saks St #84 | 0.07mi | 3/2.0 (+1) | 1,404 (+2%) | 8mo | $161,000 | $115 | 82 |
| 2 Liborio Ln | 0.27mi | 3/2.0 (+1) | 1,382 (+0%) | 4mo | $350,888 | $254 | 78 |
| 926 Appleberry Dr | 0.02mi | 2/2.0 | 1,552 (+13%) | 2mo | $154,900 | $100 | 76 |
| 59 Vincent Ct | 0.23mi | 3/2.0 (+1) | 1,326 (-4%) | 8mo | $360,000 | $271 | 71 |
| 1125 Lorenzo Ln #274 | 0.15mi | 3/2.0 (+1) | 1,481 (+8%) | 6mo | $160,000 | $108 | 71 |
| 58 Vincent Ct | 0.27mi | 3/2.0 (+1) | 1,326 (-4%) | 6mo | $365,000 | $275 | 71 |
| 1111 Lorenzo Ln #267 | 0.17mi | 3/2.0 (+1) | 1,516 (+10%) | 3mo | $165,000 | $109 | 68 |
| 46 Liborio Ln | 0.37mi | 3/2.5 (+1) | 1,434 (+4%) | 2mo | $355,000 | $248 | 67 |
| 43 Hedgerow Hollow Rd #43 | 0.54mi | 3/2.0 (+1) | 1,404 (+2%) | 7mo | $115,000 | $82 | 61 |
| 74 Liborio Ln | 0.40mi | 3/2.5 (+1) | 1,488 (+8%) | 2mo | $335,000 | $225 | 59 |
| 38 Liborio Ln | 0.37mi | 3/2.5 (+1) | 1,488 (+8%) | 5mo | $360,000 | $242 | 58 |
| 125 E Clarendon Dr | 0.68mi | 2/2.0 | 1,466 (+6%) | 3mo | $337,500 | $230 | 55 |
Match score weights: distance 35% · size 25% · config 20% · recency 20%. Top-matched comps best support the ARV.
Projected returns pro-forma
-3.0% appreciation · 3.0% rent growth · sell at horizon
- IRR
- 6.8%
- Equity multiple
- 1.27×
- Total profit
- $9,717
- Equity at exit
- $19,383
- IRR
- 16.2%
- Equity multiple
- 2.32×
- Total profit
- $48,220
- Equity at exit
- $11,240
Cash invested: $36,400 (down + closing). Projections, not guarantees.
Landlord ↔ Tenant lean methodology
- Overall (STATE)
- 70 Landlord-Friendly
- State Delaware
- 70 Landlord-Friendly · D+7
- County
- — inherits STATE
- City
- — inherits STATE
ZIP-level market 19977
- Home prices YoY
- -29.1%
- Active inventory
- 220
- Price-to-rent
- 6.1×
Monthly cashflow live
- Estimated rent
- $1,782 medium interval (Pro) →
- Mortgage (P&I)
- −$682
- Tax est. 1.5%
- −$162 /mo · $1,950/yr
- Insurance
- −$54
- HOA
- −$27
- Vacancy / Maint / Mgmt
- −$374
- Net cashflow
- $483
Break-even live
UW: 25.0% down · 7.5% · 30yr · 1.5% tax · 5.0% vac · 8.0% maint · 8.0% mgmt
Financing live
Cash to close
- Down payment
- $32,500
- Closing costs
- $3,900
- Reserves months
- —
- Total cash needed
- —
Loan-product check · same deal, 3 products live
Conventional
25% down · 7.5% · 30yr
- Down + closing
- —
- Monthly P&I
- —
- Monthly cashflow
- —
- DSCR
- —
- Eligible?
- —
Personal DTI + credit; lowest rate.
DSCR
20% down · 8.5% · 30yr
- Down + closing
- —
- Monthly P&I
- —
- Monthly cashflow
- —
- DSCR
- —
- Eligible?
- —
No personal income docs; deal must DSCR.
Hard money
10% down · 12.0% · 12mo
- Down + closing
- —
- Monthly P&I
- —
- Monthly cashflow
- —
- DSCR
- —
- Eligible?
- —
Short-term bridge; refi at stabilization.
HOA detail
- Monthly dues
- $27 · $324/yr
Listing history 5 events
-
2026-04-24status Pending
-
2026-03-28status Active
-
2026-02-16status Pending
-
2025-12-07price $130,000
-
2025-11-25$140,000 Active
ⓘ Source: listings_history table (triggers on properties + properties_extension) + one-shot
backfill from property_details.listing_events for pre-trigger history.
Nearby sold comps map
Loading sold comps map…
Walkable amenities ~0.75 mi
Loading nearby amenities…
Taxation est. · year 1
- Rental income
- $21,388
- − Mortgage interest
- −$7,282
- − Property taxes
- −$1,950
- − Insurance
- −$650
- − Repairs & maintenance
- −$1,711
- − Management
- −$1,711
- − HOA
- −$324
- − Depreciation
- −$3,782
- Taxable income
- $3,978
- Est. tax owed @ 24.0%
- −$955
- After-tax cash flow
- $4,837/yr
For passive investors: Depreciation is non-cash, so a rental often shows a tax loss while cash-flowing — sheltering income. Rental losses are passive: they offset passive income freely, and up to $25,000/yr can offset ordinary (W-2) income if you actively participate and your MAGI is under $100k (phasing out to $0 by $150k); unused losses carry forward. On sale, claimed depreciation is recaptured at up to 25%, and gains may owe capital-gains tax (a 1031 exchange can defer both). Figures are a year-1 estimate at your 24.0% rate — not tax advice; consult a CPA.
Schools (NCES district)
- District
- Smyrna School District
- NCES district ID
- 1001620
- Math proficiency
- 22% ▼ -25.00%
- Reading proficiency
- 39% ▼ -17.00%
- Median HH income
- $61,704
- Composite
- 27.67/100
- National rank
- #6915
- State rank
- #16 of 26 in DE
Livability — Smyrna
- Score
- 69/100
- State rank
- #29
- US rank
- #8702
Category grades
Schools grade is shown separately in the Schools card above.
Census & demographics
- Census place
- Smyrna, DE
- Population (ZIP)
- 27,164
Population outlook (Kent County) Hauer SSP2
- Today (2025)
- 194,477 people
- By 2030
- 204,351 · +5.1%
- By 2040
- 222,135 · +14.2%
- By 2050
- 236,483 · +21.6%
- By 2075
- 266,327 · +36.9%
- By 2100
- 275,335 · +41.6%
Race, ethnicity, and origin ACS 2023
- Neighborhood character
- Diverse neighborhood (Simpson 0.59)
- Race & ethnicity
- White 56% Black 29% Two or more races 9% Hispanic / Latino 8% Asian 2%
- Hispanic origin (detail)
- Mexican 1% Puerto Rican 5% Dominican 1%
- Common ancestry
- Romanian 5% Hispanic 1% Iranian 1%
- Foreign-born
- 7% · Canada
- Languages at home
- 89% English-only · Spanish 4% French/Haitian/Cajun 2% Other Asian/Pacific 2%
Political lean MEDSL · Kent
- 2024 margin
- Toss-up / Even · D 50.2% · R 48.2% · Other 1.7%
- 2008→2024 swing
- -7.8pp toward R · 2008: 9.8pp · 2024: 2.0pp
- All cycles
- 2024: D+2.0 2020: D+4.1 2016: R+4.9 2012: D+4.9 2008: D+9.8
Not yet ingested
- Civics
- —
Market trends
- HPI YoY
- ▼ -110.14%
- Current HPI
- 267.998
- Rent YoY
- —
- Metro
- —
- State GDP YoY
- —
- F500 in state
- 0
Price history
-7.1% since first listed5 events — show timeline
- 2026-04-24 Pending — BRIGHT MLS
- 2026-03-28 Relisted — BRIGHT MLS
- 2026-02-16 Pending — BRIGHT MLS
- 2025-12-07 Price Changed $130,000 BRIGHT MLS
- 2025-11-25 Listed $140,000 BRIGHT MLS
Cash-flow waterfall
monthlySold comps — $/sqft
last 12 mo · ≤1 miLoading sold comps…