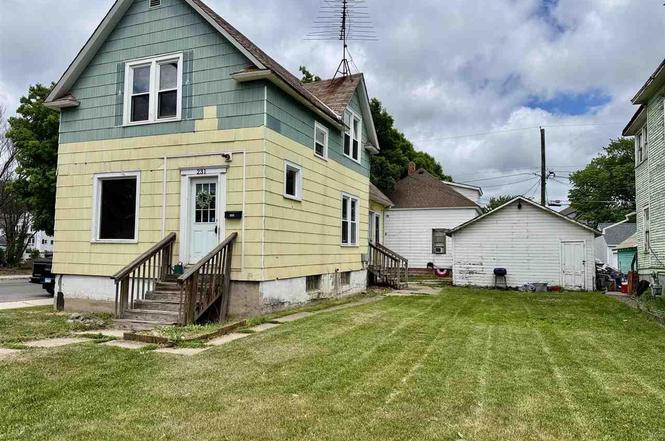
231 8th St S · Virginia, MN
Flood risk 1/10 · Minimal
- FEMA flood zone
- —
- Chance of flooding over 30 yrs
- 0.0%
- Est. flood insurance / yr
- —
Fire risk 4/10 · Minor
- Est. fire insurance / yr
- $888 – $1,650
Heat risk 1/10 · Minimal
- Hot days now (above 91°F)
- 7 days/yr
- Hot days in 30 yrs
- 12 days/yr
Wind risk 1/10 · Minimal
- Chance of severe wind over 30 yrs
- —
Air-quality risk 2/10 · Minimal
- Unhealthy air days now
- 2 days/yr
- Unhealthy air days in 30 yrs
- 2 days/yr
Risk factors via First Street. Map © Google.
Why this score? — see what drove the B grade
The composite is a weighted blend of 9 inputs, each scored 0–100. Each bar is that input's sub-score; the figure is the points it added to the 100-point composite (weight × sub-score).
- Cash flow +30.0/30.0
- 1% rule +10.0/10.0
- DSCR +10.0/10.0
- ARV discount +7.5/15.0
- Schools +5.0/10.0
- Livability +3.2/5.0
- Rent growth +2.5/5.0
- Condition / age +2.5/5.0
- Appreciation +0.0/10.0
$64,900
🖨 Deal sheet 📄 Offer letter ✓ Due diligence
Listing remarks MLS
Move-in ready 1¾-story home on a corner lot offering plenty of character and functional living space! The bright eat-in kitchen features beautiful hickory cabinets with tile inlays, a walk-in pantry, and ample room for kitchen table. The main level includes a formal dining room, cozy living room with a large picture window, and a versatile bedroom that could also serve as a home office. A very nice original wood banister leads upstairs to three spacious bedrooms, all showcasing original hard wood floors. There is extra closet space. The tiled bathroom has a updated vanity keeping original charm. The basement offers a large shower, toilet, water softener, high-efficiency gas boiler, water heater, and newer baseboard heat registers throughout the home. Vinyl double-hung windows throughout. While the exterior and single-stall garage could use some TLC, this solid home offers an excellent opportunity to own a property with timeless character and room to add your personal touch.
Key facts
- Formal dining room
- Hickory cabinets
- Eat-in kitchen
Tags
Property features AI
Exterior
- Parking: 1-car garage (approx. 12 x 18)
- Utilities: City water connected; City sewer connected; 100 amp electric service; Natural gas; Electric service provided by Virginia Public Utilities
- Home design: Residential property; One and one-half stories; Main and upper level living
- Construction: Poured concrete foundation; Asphalt roof; Built area includes above- and below-grade space
- Exterior features: Lot approximately 75 x 50; Lot size about 0.085 acres
Interior
- Kitchen: Range
- Bedrooms: 4 bedrooms (combination of main and upper levels)
- Bathrooms: 1 full bath; 1 half bath
- Heating & cooling: Baseboard heating; Hot water heating; No central air
- Interior features: Range; Full basement
Neighborhood map
What this means for you Summary
Snapshot
- This is a 3-bed/2.0-bath other listed at $65k.
Deal economics
- At list price, monthly cash flow is $629 ($8k/yr) — positive.
- The deal already cash-flows at list — no discount required.
- Meets the 1% rule at list price ($1k rent vs $65k).
- Cap rate 17.9% vs local median 7.5% in Virginia — top-decile yield for the area; either an underpriced asset or a hidden risk that comps aren't pricing in. Stress-test before assuming the spread holds.
Location & tenants
- Location reads 63/100 on livability (#664 in MN) — a middle-class / working-renter tenant base. Strengths: cost of living A+, housing A+; Watch: schools C-, crime D, health & safety D.
- Market conditions: 64 active listings in the ZIP; 1 comparable units currently listed for rent nearby; 639 units permitted in St. Louis County in 2024 (338 in 5+ unit buildings).
- This rent runs 31% of the median local income ($54k/yr) — at the standard rent-burdened threshold; future hikes will face affordability resistance.
Forward outlook
- Local home prices are declining (-3.0%/yr); year-one equity from $449 of loan paydown is wiped out by about $2k of value loss. Plan a longer hold.
- At projected returns (-3.0% appreciation + 3.0% rent growth), your $18k cash investment doubles in ~3 years — after that, you're playing with house money.
Negotiation context
- Only 4 days on market — expect competitive offers; lowballing is unlikely to land.
- 3 sale attempts with the ask held roughly flat each time — persistent listings suggest the price (not the market) is what's stuck; bring a comps-based counter.
- Current owner paid $16k; list at $65k implies a 319% gain — meaningful room to come down on a strong offer.
Risks & watch-outs
- Watch-outs: built in 1905 — expect roof / HVAC / electrical / plumbing capex.
Questions for the listing agent
- Built in 1905 — when were the roof, HVAC, electrical panel, plumbing, and water heater last replaced?
- Is there a deadline driving the sale (1031 exchange, divorce, estate, relocation)? That informs how much negotiation room exists.
- Crime grade is D in this area — have there been break-ins, vandalism, or insurance claims at this property in the last 3 years? What carrier currently insures it and at what premium?
- What's the average days-on-market for RENTAL listings here right now (not sales)? A rising rental-DOM trend means longer vacancies and softer asking-rent achievability than the comps imply.
- What's the recent tenant-quality profile in this submarket — average credit score on applications, eviction rate, late-payment / NSF rate, and stable-employment percentage? A property-management company in the area should have these aggregated.
- How much new for-sale + rental construction is in the pipeline within 1–3 miles? Heavy new supply typically softens prices + rents 12–24 months out; constrained supply supports both.
Investment metrics
- 1% rule
- 2.13% ✓
- Cap rate
- 17.92%
- Cash-on-cash
- 41.52%
- DSCR
- 2.85
- GRM
- 3.9
CMA / ARV
No comps found within radius.
Projected returns pro-forma
-3.0% appreciation · 3.0% rent growth · sell at horizon
- IRR
- 38.1%
- Equity multiple
- 2.63×
- Total profit
- $29,560
- Equity at exit
- $9,677
- IRR
- 44.6%
- Equity multiple
- 5.26×
- Total profit
- $77,429
- Equity at exit
- $5,611
Cash invested: $18,172 (down + closing). Projections, not guarantees.
Landlord ↔ Tenant lean methodology
- Overall (STATE)
- 46 Balanced
- State Minnesota
- 46 Balanced · D+2
- County
- — inherits STATE
- City
- — inherits STATE
ZIP-level market 55792
- Home prices YoY
- -26.5%
- Active inventory
- 64
- Price-to-rent
- 3.9×
Monthly cashflow live
- Estimated rent
- $1,383 medium interval (Pro) →
- Mortgage (P&I)
- −$340
- Tax from tax record
- −$96 /mo · $1,158/yr
- Insurance
- −$27
- HOA
- −$0
- Vacancy / Maint / Mgmt
- −$290
- Net cashflow
- $629
Break-even live
UW: 25.0% down · 7.5% · 30yr · 1.5% tax · 5.0% vac · 8.0% maint · 8.0% mgmt
Financing live
Cash to close
- Down payment
- $16,225
- Closing costs
- $1,947
- Reserves months
- —
- Total cash needed
- —
Loan-product check · same deal, 3 products live
Conventional
25% down · 7.5% · 30yr
- Down + closing
- —
- Monthly P&I
- —
- Monthly cashflow
- —
- DSCR
- —
- Eligible?
- —
Personal DTI + credit; lowest rate.
DSCR
20% down · 8.5% · 30yr
- Down + closing
- —
- Monthly P&I
- —
- Monthly cashflow
- —
- DSCR
- —
- Eligible?
- —
No personal income docs; deal must DSCR.
Hard money
10% down · 12.0% · 12mo
- Down + closing
- —
- Monthly P&I
- —
- Monthly cashflow
- —
- DSCR
- —
- Eligible?
- —
Short-term bridge; refi at stabilization.
Rent comps 1 comps
| Address | Beds | Baths | Sqft | Rent | $/sqft | DOM | Units | Dist |
|---|---|---|---|---|---|---|---|---|
| 117 2nd St N Unit 2 Virginia, MN | 3.0 | 1.0 | 970 | $1,535 | $1.58 | 13d | 1 | 0.64mi |
Listing history 5 events
-
2026-06-15status $64,900 Pending 4 DOM
-
2026-06-15days on market $64,900 Active 4 DOM
-
2026-06-14days on market $64,900 Active 2 DOM
-
2026-06-13remarks 692-char remark
-
2026-06-13$64,900 Active 1 DOM
ⓘ Source: listings_history table (triggers on properties + properties_extension) + one-shot
backfill from property_details.listing_events for pre-trigger history.
Tax reassessment forecast MN · Partial reset (capped growth)
- Current annual tax
- $1,158 · $96/mo
- Projected year-2 tax
- $1,158 · $96/mo
- Expected delta
- $0/yr ($0/mo · 0.0%)
ⓘ Screening estimate from a state-policy table — verify with the county assessor before closing.
Climate risk First Street
- Flood 1/10 Low 0% chance over 30 yrs
- Wildfire 4/10 Moderate
- Heat 1/10 Low 7 d/yr ≥91°F today · 12 d/yr by 30 yrs out
- Wind 1/10 Low
- Air quality 2/10 Low 2 unhealthy d/yr today · 2 by 30 yrs out
Nearby sold comps map
Loading sold comps map…
Walkable amenities ~0.75 mi
Loading nearby amenities…
Taxation est. · year 1
- Rental income
- $16,597
- − Mortgage interest
- −$3,635
- − Property taxes
- −$1,158
- − Insurance
- −$324
- − Repairs & maintenance
- −$1,328
- − Management
- −$1,328
- − Depreciation
- −$1,888
- Taxable income
- $6,936
- Est. tax owed @ 24.0%
- −$1,665
- After-tax cash flow
- $5,881/yr
For passive investors: Depreciation is non-cash, so a rental often shows a tax loss while cash-flowing — sheltering income. Rental losses are passive: they offset passive income freely, and up to $25,000/yr can offset ordinary (W-2) income if you actively participate and your MAGI is under $100k (phasing out to $0 by $150k); unused losses carry forward. On sale, claimed depreciation is recaptured at up to 25%, and gains may owe capital-gains tax (a 1031 exchange can defer both). Figures are a year-1 estimate at your 24.0% rate — not tax advice; consult a CPA.
Schools (NCES district)
No district data.
Livability — Virginia
- Score
- 63/100
- State rank
- #664
- US rank
- #15991
Category grades
Schools grade is shown separately in the Schools card above.
Census & demographics
- Census place
- Virginia, MN
- County
- Saint Louis County · 115,152 people
- City population
- 9,663
- Metro
- Duluth, MN-WI
- Population (ZIP)
- 9,663
- Household income
- $53,750
- Rent vs Own
- Severe rent burden
- 286.0
Population outlook (St. Louis County) Hauer SSP2
- Today (2025)
- 202,411 people
- By 2030
- 203,234 · +0.4%
- By 2040
- 202,520 · +0.1%
- By 2050
- 200,853 · -0.8%
- By 2075
- 200,943 · -0.7%
- By 2100
- 192,058 · -5.1%
Race, ethnicity, and origin ACS 2023
- Neighborhood character
- Predominantly White (90%)
- Race & ethnicity
- White 90% Two or more races 4% Native American 3% Asian 1%
- Common ancestry
- Portuguese 12% Romanian 4% Lithuanian 2%
- Foreign-born
- 2% · Canada, Vietnam
- Languages at home
- 96% English-only · Spanish 1% Other Asian/Pacific 1%
Political lean MEDSL · St. Louis
- 2024 margin
- D (+13.7) · D 55.9% · R 42.2% · Other 1.8%
- 2008→2024 swing
- -18.8pp toward R · 2008: 32.5pp · 2024: 13.7pp
- All cycles
- 2024: D+13.7 2020: D+15.6 2016: D+11.8 2012: D+29.6 2008: D+32.5
Not yet ingested
- Civics
- —
Market trends
- HPI YoY
- ▼ -72.05%
- Current HPI
- 199.7165
- Rent YoY
- —
- Metro
- Duluth, MN-WI
- State GDP YoY
- ▲ 2.41%
- F500 in state
- 34
Industry mix (Fortune 500 HQ in MN)
| Industry | F500 HQs | Revenue |
|---|---|---|
| Healthcare | 2 | $407B |
|
||
| Retail | 2 | $150B |
|
||
| Consumer Goods | 2 | $32B |
|
||
| Industrial Machinery | 2 | $6B |
|
||
| Agriculture | 1 | $40B |
|
||
| Healthcare / Medical Devices | 1 | $32B |
|
||
Price history
+318.7% since first listed4 events — show timeline
- 2026-06-10 Listed $64,900 LSAR
- 2026-06-10 Listed $64,900 NORTHSTARMLS as Distributed by MLS Grid
- 2026-06-10 Listed $64,900 RAOR
- 1999-11-03 Sold (Public Records) $15,500 Public Records
Property tax history
+5.9%/yrLatest (2025): $1,158 · -1.5% YoY. Source: county tax records.
Cash-flow waterfall
monthlySold comps — $/sqft
last 12 mo · ≤1 miLoading sold comps…