300 Lighthouse Dr Unit PT86 · Preston, TX
Flood risk No data
- FEMA flood zone
- —
- Chance of flooding over 30 yrs
- —
- Est. flood insurance / yr
- —
Fire risk No data
- Est. fire insurance / yr
- —
Heat risk No data
- Hot days now (above threshold)
- —
- Hot days in 30 yrs
- —
Wind risk No data
- Chance of severe wind over 30 yrs
- —
Air-quality risk No data
- Unhealthy air days now
- —
- Unhealthy air days in 30 yrs
- —
Risk factors via First Street. Map © Google.
Why this score? — see what drove the B- grade
The composite is a weighted blend of 9 inputs, each scored 0–100. Each bar is that input's sub-score; the figure is the points it added to the 100-point composite (weight × sub-score).
- Cash flow +30.0/30.0
- 1% rule +10.0/10.0
- DSCR +10.0/10.0
- ARV discount +7.5/15.0
- Schools +3.7/10.0
- Livability +2.8/5.0
- Rent growth +2.5/5.0
- Condition / age +2.5/5.0
- Appreciation +0.0/10.0
$60,000
🖨 Deal sheet 📄 Offer letter ✓ Due diligence
Listing remarks MLS
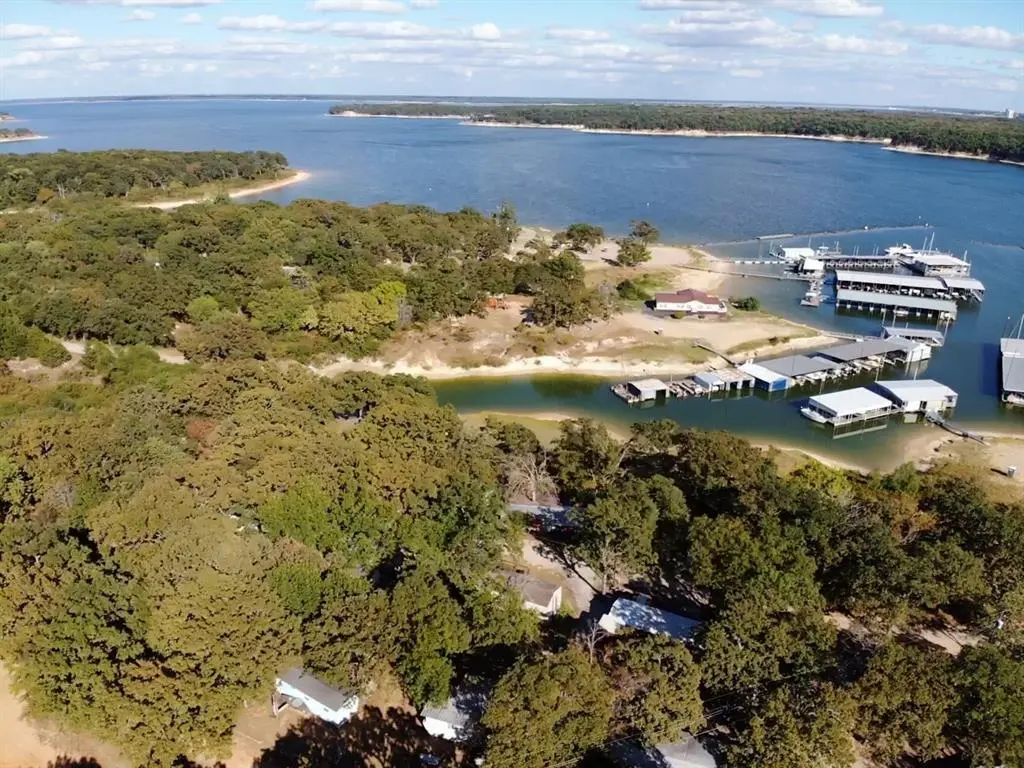
Discover your dream retreat in this charming lake house with stunning views in the Lighthouse Resort and Marina community. This home boasts a lake view and a large screened-in porch, ideal for morning coffee or relaxing sunset views. Located in a vibrant golf cart community with easy access to amenities and the acclaimed Pottsboro School District, this property offers a perfect lakeside lifestyle. Don’t miss out!
Key facts
- Golf cart community
- Lake view
- Built 1970
Tags
Neighborhood map
What this means for you Summary
Snapshot
- This is a 2-bed/1.5-bath manufactured listed at $60k.
Deal economics
- At list price, monthly cash flow is $436 ($5k/yr) — positive.
- The deal already cash-flows at list — no discount required.
- Meets the 1% rule at list price ($1k rent vs $60k).
- Recommended offer: $58k (3.0% below list) — sets the bar for market timing.
- Cap rate 15.0% vs local median 2.9% in Preston — top-decile yield for the area; either an underpriced asset or a hidden risk that comps aren't pricing in. Stress-test before assuming the spread holds.
Location & tenants
- Location reads 56/100 on livability (#1,306 in TX) — a working-class tenant base; expect higher turnover. Strengths: crime A+, cost of living A+, housing A+; Watch: employment D, schools F, amenities F.
- Pottsboro ISD (suburban): math 39% / reading 48% proficiency, ranked #288 of 826 in TX (top 35%) — families likely to look elsewhere, expect single-tenant / working-renter base with shorter leases.
- Market conditions: 292 active listings in the ZIP; solid renter incomes; 2,272 units permitted in Grayson County in 2024 (750 in 5+ unit buildings).
Forward outlook
- Local home prices are declining (-3.0%/yr); year-one equity from $415 of loan paydown is wiped out by about $2k of value loss. Plan a longer hold.
- Grayson County population projected at +12% by 2050 — modest demand growth; plan on rents tracking national, not racing it.
- At projected returns (-3.0% appreciation + 3.0% rent growth), your $17k cash investment doubles in ~4 years — after that, you're playing with house money.
Negotiation context
- It's been on market 59 days — a 3% lower offer ($58k) is reasonable based on typical stale-listing flexibility.
- 4 sale attempts since 2y ago with the ask held roughly flat each time — persistent listings suggest the price (not the market) is what's stuck; bring a comps-based counter.
Questions for the listing agent
- It's been on market 59 days. Have you received any prior offers? Is the seller open to a 3% concession, seller financing, or rate buy-down credit?
- Built in 1970 — when were the roof, HVAC, electrical panel, plumbing, and water heater last replaced?
- What does the HOA fee cover, when was the last increase, and are there any pending special assessments or reserve-fund shortfalls?
- Is there a deadline driving the sale (1031 exchange, divorce, estate, relocation)? That informs how much negotiation room exists.
- Schools are F-rated, which usually means shorter tenancies and higher turnover. Who's the typical renter profile here, and what's been the actual vacancy rate?
- What's the average days-on-market for RENTAL listings here right now (not sales)? A rising rental-DOM trend means longer vacancies and softer asking-rent achievability than the comps imply.
- What's the recent tenant-quality profile in this submarket — average credit score on applications, eviction rate, late-payment / NSF rate, and stable-employment percentage? A property-management company in the area should have these aggregated.
- How much new for-sale + rental construction is in the pipeline within 1–3 miles? Heavy new supply typically softens prices + rents 12–24 months out; constrained supply supports both.
Investment metrics
- 1% rule
- 2.15% ✓
- Cap rate
- 15.02%
- Cash-on-cash
- 31.15%
- DSCR
- 2.39
- GRM
- 3.9
CMA / ARV
- ARV (median comp)
- $186,000
- List price
- $60,000
- Delta
- -67.74%
- Verdict
- UNDERPRICED
- Comps
- 2 within 1.0 mi
Show comp detail 1 sale within ~0.75 mi
| Address | Dist | Beds/Ba | Sqft | Sold | Price | $/sf | Match |
|---|---|---|---|---|---|---|---|
| 59 Air Force Dr | 0.18mi | 1/1.0 (-1) | 720 (-1%) | 4mo | $200,000 | $278 | 79 |
Match score weights: distance 35% · size 25% · config 20% · recency 20%. Top-matched comps best support the ARV.
Projected returns pro-forma
-3.0% appreciation · 3.0% rent growth · sell at horizon
- IRR
- 26.1%
- Equity multiple
- 2.08×
- Total profit
- $18,178
- Equity at exit
- $8,946
- IRR
- 33.8%
- Equity multiple
- 4.10×
- Total profit
- $52,094
- Equity at exit
- $5,188
Cash invested: $16,800 (down + closing). Projections, not guarantees.
Landlord ↔ Tenant lean methodology
- Overall (STATE)
- 87 Strongly Landlord-Friendly
- State Texas
- 87 Strongly Landlord-Friendly · R+5
- County
- — inherits STATE
- City
- — inherits STATE
ZIP-level market 75076
- Home prices YoY
- -17.3%
- Active inventory
- 292
- Price-to-rent
- 3.9×
Monthly cashflow live
- Estimated rent
- $1,289 medium interval (Pro) →
- Mortgage (P&I)
- −$315
- Tax from tax record
- −$17 /mo · $206/yr
- Insurance
- −$25
- HOA
- −$225
- Vacancy / Maint / Mgmt
- −$271
- Net cashflow
- $436
Break-even live
UW: 25.0% down · 7.5% · 30yr · 1.5% tax · 5.0% vac · 8.0% maint · 8.0% mgmt
Financing live
Cash to close
- Down payment
- $15,000
- Closing costs
- $1,800
- Reserves months
- —
- Total cash needed
- —
Loan-product check · same deal, 3 products live
Conventional
25% down · 7.5% · 30yr
- Down + closing
- —
- Monthly P&I
- —
- Monthly cashflow
- —
- DSCR
- —
- Eligible?
- —
Personal DTI + credit; lowest rate.
DSCR
20% down · 8.5% · 30yr
- Down + closing
- —
- Monthly P&I
- —
- Monthly cashflow
- —
- DSCR
- —
- Eligible?
- —
No personal income docs; deal must DSCR.
Hard money
10% down · 12.0% · 12mo
- Down + closing
- —
- Monthly P&I
- —
- Monthly cashflow
- —
- DSCR
- —
- Eligible?
- —
Short-term bridge; refi at stabilization.
HOA detail
- Monthly dues
- $225 · $2,700/yr
Listing history 22 events
-
2026-06-19days on market $60,000 Active 59 DOM
-
2026-06-18days on market $60,000 Active 58 DOM
-
2026-06-17days on market $60,000 Active 57 DOM
-
2026-06-16days on market $60,000 Active 56 DOM
-
2026-06-15days on market $60,000 Active 55 DOM
-
2026-06-14days on market $60,000 Active 53 DOM
-
2026-06-13days on market $60,000 Active 52 DOM
-
2026-06-10days on market $60,000 Active 50 DOM
-
2026-06-09days on market $60,000 Active 49 DOM
-
2026-06-08days on market $60,000 Active 48 DOM
-
2026-06-07days on market $60,000 Active 47 DOM
-
2026-06-03days on market $60,000 Active 43 DOM
-
2026-06-02days on market $60,000 Active 42 DOM
-
2026-06-01days on market $60,000 Active 41 DOM
-
2026-05-31days on market $60,000 Active 40 DOM
-
2026-05-30days on market $60,000 Active 39 DOM
-
2026-04-21$60,000 Active 422-char remark
Show marketing remark (422 chars)
Discover your dream retreat in this charming lake house with stunning views in the Lighthouse Resort and Marina community. This home boasts a lake view and a large screened-in porch, ideal for morning coffee or relaxing sunset views. Located in a vibrant golf cart community with easy access to amenities and the acclaimed Pottsboro School District, this property offers a perfect lakeside lifestyle. Don’t miss out!
-
2025-06-27historical
-
2025-01-28$60,000 Active
-
2024-12-26historical
-
2024-10-11status Active
-
2024-09-18$60,000 Active
ⓘ Source: listings_history table (triggers on properties + properties_extension) + one-shot
backfill from property_details.listing_events for pre-trigger history.
Tax reassessment forecast TX · Resets to sale price
- Current annual tax
- $206 · $17/mo
- Projected year-2 tax
- $1,098 · $92/mo
- Expected delta
- +$892/yr (+$74/mo · 431.9%)
ⓘ Screening estimate from a state-policy table — verify with the county assessor before closing.
Nearby sold comps map
Loading sold comps map…
Walkable amenities ~0.75 mi
Loading nearby amenities…
Taxation est. · year 1
- Rental income
- $15,463
- − Mortgage interest
- −$3,361
- − Property taxes
- −$206
- − Insurance
- −$300
- − Repairs & maintenance
- −$1,237
- − Management
- −$1,237
- − HOA
- −$2,700
- − Depreciation
- −$1,745
- Taxable income
- $4,676
- Est. tax owed @ 24.0%
- −$1,122
- After-tax cash flow
- $4,111/yr
For passive investors: Depreciation is non-cash, so a rental often shows a tax loss while cash-flowing — sheltering income. Rental losses are passive: they offset passive income freely, and up to $25,000/yr can offset ordinary (W-2) income if you actively participate and your MAGI is under $100k (phasing out to $0 by $150k); unused losses carry forward. On sale, claimed depreciation is recaptured at up to 25%, and gains may owe capital-gains tax (a 1031 exchange can defer both). Figures are a year-1 estimate at your 24.0% rate — not tax advice; consult a CPA.
Schools (NCES district)
- District
- Pottsboro ISD
- NCES district ID
- 4835580
- Math proficiency
- 39% ▼ -11.00%
- Reading proficiency
- 48% ▼ -6.00%
- Median HH income
- $50,811
- Composite
- 37.44/100
- National rank
- #4414
- State rank
- #288 of 826 in TX
Livability — Preston
- Score
- 56/100
- State rank
- #1306
- US rank
- #22637
Category grades
Schools grade is shown separately in the Schools card above.
Census & demographics
- Census place
- Preston, TX
- County
- Grayson County · 108,053 people
- Metro
- Sherman-Denison, TX
- Population (ZIP)
- 7,989
- Household income
- $76,919
- Rent vs Own
- Severe rent burden
- 169.0
Population outlook (Grayson County) Hauer SSP2
- Today (2025)
- 134,540 people
- By 2030
- 138,653 · +3.1%
- By 2040
- 145,958 · +8.5%
- By 2050
- 151,218 · +12.4%
- By 2075
- 161,802 · +20.3%
- By 2100
- 159,036 · +18.2%
Race, ethnicity, and origin ACS 2023
- Neighborhood character
- Predominantly White (88%)
- Race & ethnicity
- White 88% Two or more races 7% Hispanic / Latino 3% Asian 1% Native American 1%
- Common ancestry
- Serbian 2% Scottish 2% Scotch-Irish 2%
- Foreign-born
- 2% · Canada
- Languages at home
- 95% English-only · Spanish 3%
Political lean MEDSL · Grayson
- 2024 margin
- Solid R (+54.3) · D 22.5% · R 76.7%
- 2008→2024 swing
- -16.4pp toward R · 2008: -37.9pp · 2024: -54.3pp
- All cycles
- 2024: R+54.3 2020: R+49.9 2016: R+53.1 2012: R+48.0 2008: R+37.9
Not yet ingested
- Civics
- —
Market trends
- HPI YoY
- ▼ -51.29%
- Current HPI
- 244.52
- Rent YoY
- —
- Metro
- Sherman-Denison, TX
- State GDP YoY
- ▲ 3.95%
- F500 in state
- 110
Industry mix (Fortune 500 HQ in TX)
| Industry | F500 HQs | Revenue |
|---|---|---|
| Energy | 16 | $1,198B |
|
||
| Technology | 5 | $198B |
|
||
| Engineering / Construction | 4 | $72B |
|
||
| Energy Services | 3 | $60B |
|
||
| Utilities | 3 | $41B |
|
||
| Healthcare | 2 | $330B |
|
||
Price history
+0.0% since first listed6 events — show timeline
- 2026-04-21 Listed $60,000 NTREIS
- 2025-06-27 Listing Removed — NTREIS
- 2025-01-28 Listed $60,000 NTREIS
- 2024-12-26 Listing Removed — NTREIS
- 2024-10-11 Relisted — NTREIS
- 2024-09-18 Listed $60,000 NTREIS
Property tax history
-2.4%/yrLatest (2025): $206 · +6.7% YoY. Source: county tax records.
Cash-flow waterfall
monthlySold comps — $/sqft
last 12 mo · ≤1 miLoading sold comps…