 Multi-family
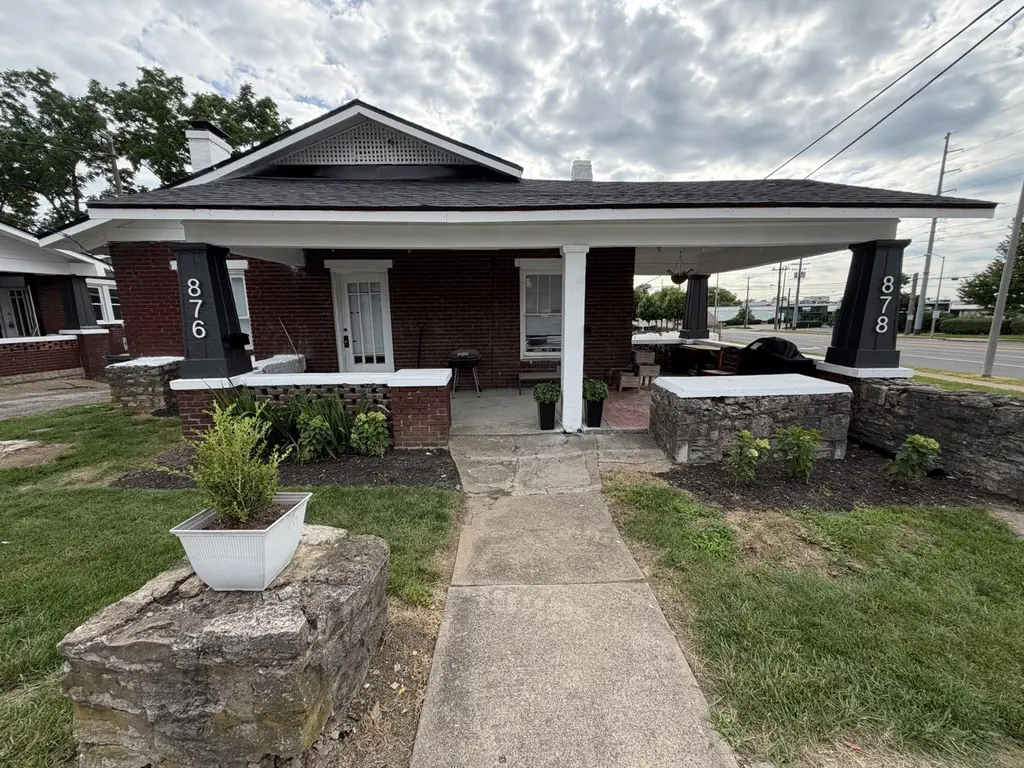
876-878 Angliana Ave · Lexington-Fayette, KY
Flood risk 1/10 · Minimal
- FEMA flood zone
- X (unshaded)
- Chance of flooding over 30 yrs
- 0.0%
- Est. flood insurance / yr
- $473 – $860
Fire risk 1/10 · Minimal
- Est. fire insurance / yr
- $839 – $1,559
Heat risk 5/10 · Moderate
- Hot days now (above 101°F)
- 7 days/yr
- Hot days in 30 yrs
- 20 days/yr
Wind risk 2/10 · Minimal
- Chance of severe wind over 30 yrs
- 1.0%
Air-quality risk 1/10 · Minimal
- Unhealthy air days now
- 0 days/yr
- Unhealthy air days in 30 yrs
- 0 days/yr
Risk factors via First Street. Map © Google.
Why this score? — see what drove the C- grade
The composite is a weighted blend of 9 inputs, each scored 0–100. Each bar is that input's sub-score; the figure is the points it added to the 100-point composite (weight × sub-score).
- Cash flow +21.7/30.0
- ARV discount +7.5/15.0
- DSCR +6.9/10.0
- Rent growth +5.0/5.0
- 1% rule +4.4/10.0
- Schools +3.4/10.0
- Livability +2.5/5.0
- Condition / age +2.5/5.0
- Appreciation +0.0/10.0
$239,500
🖨 Deal sheet (PDF) 📄 Offer letter ✓ Due diligence
Multi-family units
County records classify this as Multi-Family (2-4 Unit). Listing-text estimate: 1 unit. estimate disagrees with records
Listing remarks
Duplex near campus! Recent updates: Brand New Roof; New soffit & fascia boards; 2 New HVAC units (1 per side) with 10 year warranties. Utilities are metered separately. Large Basement houses mechanicals & extra storage. Each unit features 1 Bedroom & 1 bath, Hardwood Floors, with 704 sq ft. per side. Backyard enjoys new Fire-pit! Shared driveway with 2 parking spots in back. The 876 side has washer & dryer hookup. Located close to the Distillery District, Rupp Arena, & Lextran bus stop! LexTran offers free city transit for UK students/faculty - bus stop is just . 02 miles away to quickly get to UK!. Walk to Gatton park - just . 7 miles; Red Mile is just 1.3 mil
Key facts
- Extra storage
- New hvac units
- New fascia boards
Tags
Property features AI
Exterior
- Parking: Off-street parking
- Utilities: Public water; Public sewer; Electricity connected; Natural gas connected; Cable available
- Home design: Duplex; One story
- Construction: Brick veneer and vinyl siding exterior; Block foundation; Dimensional-style roof; Total building area approximately 1,408
- Exterior features: Fire pit; Landscaped lot; Wood fencing
Interior
- Bedrooms: 2 total rooms (bedroom count not explicitly specified beyond rooms total)
- Flooring: Hardwood floors
- Bathrooms: 2 full bathrooms
- Heating & cooling: Forced air heating (natural gas); Electric cooling
- Interior features: Primary bedroom on the first floor; Unfinished basement with exterior entry; Fireplace
Neighborhood map
What this means for you Summary
Snapshot
- This is a 2-bed/2.0-bath multifamily listed at $240k.
Deal economics
- At list price, monthly cash flow is $368 ($4k/yr) — positive.
- The deal already cash-flows at list — no discount required.
- To meet the 1% rule (rent ≥ 1% of price), the offer needs to be $225k (6.0% below list).
- Recommended offer: $225k (6.0% below list) — sets the bar for 1% rule.
- Cap rate 8.1% vs local median 3.8% in Lexington-Fayette — top-decile yield for the area; either an underpriced asset or a hidden risk that comps aren't pricing in. Stress-test before assuming the spread holds.
Location & tenants
- Location reads: area grade C — affects rentability + tenant quality, not the cash-flow math above.
- Fayette County (urban): math 35% / reading 45% proficiency, ranked #27 of 165 in KY (top 16%) — families likely to look elsewhere, expect single-tenant / working-renter base with shorter leases.
- Zoned schools: Harrison Elementary School (math 8% / reading 17%, grade F, #630 of 676 statewide, top 95%, 179 students, 84% FRL); Lexington Trad Magnet School (math 11% / reading 29%, grade F, #206 of 217 statewide, top 95%, 296 students, 81% FRL); Lafayette High School (math 47% / reading 54%, grade D+, #10 of 254 statewide, top 4%, 2,432 students, 38% FRL) — zoned schools average 68% FRL vs 44% district-wide (23 pts higher); higher-poverty schools than district average — tighter screening recommended.
- Zoned-school proficiency averages 28% at this address vs 40% district-wide (-12 pts) — the specific schools serving this property underperform the Fayette County average; the district grade overstates school quality for this exact location.
- Market conditions: Rents rising fast (+11.8%/yr); 83 active listings in the ZIP; 30 comparable units currently listed for rent nearby; rentals at typical pace (median 25d on market — plan ~3-4 weeks tenant-placement turnaround); lower-income renter base — watch delinquency; 1,036 units permitted in Fayette County in 2024 (542 in 5+ unit buildings).
Forward outlook
- Local home prices are declining (-3.0%/yr); year-one equity from $2k of loan paydown is wiped out by about $7k of value loss. Plan a longer hold.
- Fayette County population projected at +35% by 2050 — long-run rental-demand tailwind backs the buy-and-hold thesis.
- At projected returns (-3.0% appreciation + 8.0% rent growth), your $67k cash investment doubles in ~9 years — after that, you're playing with house money.
Negotiation context
- It's been on market 18 days — a 2% lower offer ($236k) is reasonable based on typical stale-listing flexibility.
- 3 sale attempts since 4y ago with the ask held roughly flat each time — persistent listings suggest the price (not the market) is what's stuck; bring a comps-based counter.
Risks & watch-outs
- Watch-outs: built in 1930 — expect roof / HVAC / electrical / plumbing capex.
- Climate carrying-cost: extreme-heat days projected 7→20/yr by 2055 (HVAC capex compounding) — expect insurance premiums to compound above CPI over the hold.
Questions for the listing agent
- Built in 1930 — when were the roof, HVAC, electrical panel, plumbing, and water heater last replaced?
- Is there a deadline driving the sale (1031 exchange, divorce, estate, relocation)? That informs how much negotiation room exists.
- What's the average days-on-market for RENTAL listings here right now (not sales)? A rising rental-DOM trend means longer vacancies and softer asking-rent achievability than the comps imply.
- What's the recent tenant-quality profile in this submarket — average credit score on applications, eviction rate, late-payment / NSF rate, and stable-employment percentage? A property-management company in the area should have these aggregated.
- How much new apartment / multifamily construction is in the pipeline within 1–3 miles? Heavy new supply (>2% of stock underway) typically softens rents 12–24 months out; light construction supports rent growth.
Investment metrics
- 1% rule
- 0.94% ✗
- Cap rate
- 8.14%
- Cash-on-cash
- 6.58%
- DSCR
- 1.29
- GRM
- 8.9
CMA / ARV
No comps found within radius.
Projected returns pro-forma
-3.0% appreciation · 8.0% rent growth · sell at horizon
- IRR
- -1.4%
- Equity multiple
- 0.95×
- Total profit
- $-3,587
- Equity at exit
- $35,710
- IRR
- 12.6%
- Equity multiple
- 2.20×
- Total profit
- $80,752
- Equity at exit
- $20,708
Cash invested: $67,060 (down + closing). Projections, not guarantees.
Landlord ↔ Tenant lean methodology
- Overall (STATE)
- 83 Strongly Landlord-Friendly
- State Kentucky
- 83 Strongly Landlord-Friendly · R+16
- County
- — inherits STATE
- City
- — inherits STATE
ZIP-level market 40508
- Rents YoY
- 11.8%
- Active inventory
- 83
- Price-to-rent
- 17.7×
Monthly cashflow live
- Estimated rent
- $2,252 high interval (Pro) →
- Mortgage (P&I)
- −$1,256
- Tax from tax record
- −$55 /mo · $664/yr
- Insurance
- −$100
- HOA
- −$0
- Vacancy / Maint / Mgmt
- −$473
- Net cashflow
- $368
Break-even live
Sensitivity live
| Price | -10% $504 | -5% $436 | +0% $368 | +5% $300 | +10% $232 |
|---|---|---|---|---|---|
| Rent | -10% $190 | -5% $279 | +0% $368 | +5% $457 | +10% $546 |
| Rate | -1.0pp $489 | -0.5pp $429 | base $368 | +0.5pp $306 | +1.0pp $243 |
2-unit breakdown (identical units grouped — click to expand)
| Units | Beds | Baths | Est. rent |
|---|---|---|---|
| 2× units | 1 | 1 | $2,252 |
| #1 | 1 | 1 | $1,126 |
| #2 | 1 | 1 | $1,126 |
| Total (2 units) | $2,252 | ||
UW: 25.0% down · 7.5% · 30yr · 1.5% tax · 5.0% vac · 8.0% maint · 8.0% mgmt
Financing live
Cash to close
- Down payment
- $59,875
- Closing costs
- $7,185
- Reserves months
- —
- Total cash needed
- —
Loan-product check · same deal, 3 products live
Conventional
25% down · 7.5% · 30yr
- Down + closing
- —
- Monthly P&I
- —
- Monthly cashflow
- —
- DSCR
- —
- Eligible?
- —
Personal DTI + credit; lowest rate.
DSCR
20% down · 8.5% · 30yr
- Down + closing
- —
- Monthly P&I
- —
- Monthly cashflow
- —
- DSCR
- —
- Eligible?
- —
No personal income docs; deal must DSCR.
Hard money
10% down · 12.0% · 12mo
- Down + closing
- —
- Monthly P&I
- —
- Monthly cashflow
- —
- DSCR
- —
- Eligible?
- —
Short-term bridge; refi at stabilization.
Rent comps 30 comps
| Address | Beds | Baths | Sqft | Rent | $/sqft | DOM | Units | Dist |
|---|---|---|---|---|---|---|---|---|
| 832 W High St Unit 1 Lexington, KY | 3.0 | 1.5 | 900 | $1,400 | $1.56 | 25d | 1 | 0.46mi |
| 301 Thompson Rd Lexington, KY | 3.0 | 1.0 | 1008 | $1,450 | $1.44 | 15d | 1 | 0.61mi |
| 845 Red Mile Rd Lexington, KY | 1.0–3.0 | 1.0–2.0 | 821 | $1,487 | $1.81 | 15d | 33 | 0.64mi |
| 208 Clyde St Lexington, KY | 2.0 | 1.0 | 982 | $1,100 | $1.12 | 22d | 1 | 0.66mi |
| 355 S Broadway #305 Lexington, KY | 2.0 | 2.0 | 1436 | $2,900 | $2.02 | 25d | 1 | 0.72mi |
| 120 Clyde St Lexington, KY | 3.0 | 1.0 | 1242 | $1,450 | $1.17 | 25d | 1 | 0.74mi |
| 585 S Upper St #114 Lexington, KY | 2.0 | 2.0 | 1000 | $1,995 | $2.00 | 25d | 1 | 0.77mi |
| 1079 Duncan Ave Lexington, KY | 3.0 | 1.0 | 1175 | $1,950 | $1.66 | 25d | 1 | 0.78mi |
| 1100 Horsemans Ln Unit HM37 Lexington, KY | 3.0 | 2.5 | 1500 | $1,500 | $1.00 | 25d | 1 | 0.79mi |
| 1100 Horsemans Ln Lexington, KY | 3.0 | 2.0 | 1250 | $1,500 | $1.20 | 25d | 1 | 0.80mi |
| 380 Virginia Ave Lexington, KY | 2.0 | 1.0–2.0 | 771 | $2,615 | $3.39 | 15d | 50 | 0.85mi |
| 261 S Limestone #303 Lexington, KY | 2.0 | 2.0 | 1102 | $2,995 | $2.72 | 25d | 1 | 0.91mi |
| 275 S Limestone #135 Lexington, KY | 3.0 | 2.0 | 1142 | $2,950 | $2.58 | 15d | 1 | 0.92mi |
| 275 S Limestone #115 Lexington, KY | 2.0 | 2.0 | 1010 | $2,500 | $2.48 | 25d | 1 | 0.92mi |
| 275 S Limestone #140 Lexington, KY | 2.0 | 2.0 | 1578 | $4,700 | $2.98 | 25d | 1 | 0.92mi |
| 1603 Glover Ave Lexington, KY | 3.0 | 1.0 | 1336 | $1,650 | $1.24 | 25d | 1 | 0.92mi |
| 261 Simpson Ave Lexington, KY | 3.0 | 2.0 | 1025 | $1,710 | $1.67 | 15d | 1 | 0.95mi |
| 330 Newtown Pike Lexington, KY | 1.0–3.0 | 1.0–2.0 | 976 | $1,205 | $1.23 | 25d | 1 | 1.02mi |
| 1861 Dunkirk Dr Lexington, KY | 3.0 | 1.0 | 975 | $1,595 | $1.64 | 15d | 1 | 1.03mi |
| 723 Charles Ave Lexington, KY | 3.0 | 1.0 | 992 | $1,300 | $1.31 | 15d | 1 | 1.04mi |
| 345 Blackburn Ave Lexington, KY | 2.0 | 2.0 | 946 | $1,925 | $2.03 | 15d | 1 | 1.06mi |
| 208 Linwood Dr Lexington, KY | 3.0 | 1.0 | 1200 | $1,600 | $1.33 | 25d | 1 | 1.07mi |
| 120 E Main St Lexington, KY | 2.0 | 1.0–2.0 | 710 | $2,486 | $3.50 | 15d | 20 | 1.09mi |
| 1885 Dunkirk Dr Lexington, KY | 3.0 | 1.0 | 1090 | $1,600 | $1.47 | 15d | 1 | 1.16mi |
| 120 Burley Ave Lexington, KY | 3.0 | 1.0 | 928 | $1,500 | $1.62 | 25d | 1 | 1.16mi |
| 444 Jefferson St Unit A Lexington, KY | 2.0 | 2.0 | 1220 | $1,950 | $1.60 | 15d | 1 | 1.24mi |
| 140 Gazette Ave Lexington, KY | 3.0 | 1.5 | 875 | $1,750 | $2.00 | 25d | 1 | 1.25mi |
| 405 Roosevelt Blvd Lexington, KY | 3.0 | 1.0 | 960 | $1,495 | $1.56 | 15d | 1 | 1.30mi |
| 444 N Broadway Lexington, KY | 3.0 | 1.0 | 1160 | $1,595 | $1.38 | 25d | 1 | 1.34mi |
| 341 Grosvenor Ave Unit 3 Lexington, KY | 3.0 | 3.0 | 875 | $2,500 | $2.86 | 25d | 1 | 1.36mi |
Listing history 13 events
-
2026-06-22days on market $239,500 Active 18 DOM
-
2026-06-18days on market $239,500 Active 15 DOM
-
2026-06-17days on market $239,500 Active 14 DOM
-
2026-06-16days on market $239,500 Active 13 DOM
-
2026-06-15days on market $239,500 Active 12 DOM
-
2026-06-14days on market $239,500 Active 10 DOM
-
2026-06-13days on market $239,500 Active 9 DOM
-
2026-06-10days on market $239,500 Active 7 DOM
-
2026-06-09days on market $239,500 Active 6 DOM
-
2026-06-08days on market $239,500 Active 5 DOM
-
2026-06-07days on market $239,500 Active 4 DOM
-
2026-06-05remarks 679-char remark
-
2026-06-05$239,500 Active 1 DOM
ⓘ Source: listings_history table (triggers on properties + properties_extension) + one-shot
backfill from property_details.listing_events for pre-trigger history.
Tax reassessment forecast KY · Resets to sale price
- Current annual tax
- $664 · $55/mo
- Projected year-2 tax
- $2,060 · $172/mo
- Expected delta
- +$1,396/yr (+$116/mo · 210.1%)
ⓘ Screening estimate from a state-policy table — verify with the county assessor before closing.
Climate risk First Street
- Flood 1/10 Low FEMA zone X (unshaded) · 0% chance over 30 yrs
- Wildfire 1/10 Low
- Heat 5/10 Major 7 d/yr ≥101°F today · 20 d/yr by 30 yrs out
- Wind 2/10 Low 100% chance of damaging wind over 30 yrs
- Air quality 1/10 Low 0 unhealthy d/yr today · 0 by 30 yrs out
Nearby sold comps map
Loading sold comps map…
Walkable amenities ~0.75 mi
Loading nearby amenities…
Taxation est. · year 1
- Rental income
- $27,024
- − Mortgage interest
- −$13,416
- − Property taxes
- −$664
- − Insurance
- −$1,198
- − Repairs & maintenance
- −$2,162
- − Management
- −$2,162
- − Depreciation
- −$6,967
- Taxable income
- $456
- Est. tax owed @ 24.0%
- −$109
- After-tax cash flow
- $4,306/yr
For passive investors: Depreciation is non-cash, so a rental often shows a tax loss while cash-flowing — sheltering income. Rental losses are passive: they offset passive income freely, and up to $25,000/yr can offset ordinary (W-2) income if you actively participate and your MAGI is under $100k (phasing out to $0 by $150k); unused losses carry forward. On sale, claimed depreciation is recaptured at up to 25%, and gains may owe capital-gains tax (a 1031 exchange can defer both). Figures are a year-1 estimate at your 24.0% rate — not tax advice; consult a CPA.
Schools (NCES district)
- District
- Fayette County
- NCES district ID
- 2101860
- Math proficiency
- 35% ▼ -16.00%
- Reading proficiency
- 45% ▼ -13.00%
- Median HH income
- $49,245
- Composite
- 34.38/100
- National rank
- #5211
- State rank
- #27 of 165 in KY
Livability — Lexington-Fayette
No livability data for this city. (Only ~50 U.S. cities are tracked.)
Census & demographics
- Census place
- Lexington-Fayette, KY
- County
- Fayette County · 317,143 people
- City population
- 321,882
- Metro
- Lexington-Fayette, KY
- Population (ZIP)
- 23,756
- Household income
- $29,440
- Rent vs Own
- Severe rent burden
- 2644.0
Population outlook (Fayette County) Hauer SSP2
- Today (2025)
- 363,454 people
- By 2030
- 388,270 · +6.8%
- By 2040
- 438,688 · +20.7%
- By 2050
- 490,667 · +35.0%
- By 2075
- 625,394 · +72.1%
- By 2100
- 721,354 · +98.5%
Race, ethnicity, and origin ACS 2023
- Neighborhood character
- Diverse neighborhood (Simpson 0.58)
- Race & ethnicity
- White 60% Black 22% Hispanic / Latino 9% Two or more races 7% Asian 3%
- Hispanic origin (detail)
- Mexican 5%
- Common ancestry
- Serbian 2% Italian 2% Lithuanian 2%
- Foreign-born
- 9% · Canada, China
- Languages at home
- 87% English-only · Spanish 8% Chinese 1% Other Indo-European 1%
Political lean MEDSL · Fayette
- 2024 margin
- D (+18.1) · D 58.0% · R 39.9% · Other 2.1%
- 2008→2024 swing
- +13.3pp toward D · 2008: 4.8pp · 2024: 18.1pp
- All cycles
- 2024: D+18.1 2020: D+20.8 2016: D+9.5 2012: D+1.0 2008: D+4.8
Not yet ingested
- Civics
- —
Market trends
- HPI YoY
- ▼ -251.04%
- Current HPI
- 204.3994
- Rent YoY
- ▲ 11.83%
- Metro
- Lexington-Fayette, KY
- State GDP YoY
- ▲ 1.81%
- F500 in state
- 4
Industry mix (Fortune 500 HQ in KY)
| Industry | F500 HQs | Revenue |
|---|---|---|
| Healthcare | 1 | $118B |
|
||
| Food / Beverage | 1 | $7B |
|
||
Price history
-60.1% since first listed6 events — show timeline
- 2026-06-03 Listed $239,500 ImagineMLS
- 2026-03-26 Sold (Public Records) $370,000 Public Records
- 2024-05-31 Listing Removed — ImagineMLS
- 2023-08-31 Relisted — ImagineMLS
- 2023-08-29 Listing Removed — ImagineMLS
- 2022-08-30 Listed $600,000 ImagineMLS
Property tax history
+1.9%/yrLatest (2015): $664 · +1.9% YoY. Source: county tax records.
Cash-flow waterfall
monthlySold comps — $/sqft
last 12 mo · ≤1 miLoading sold comps…