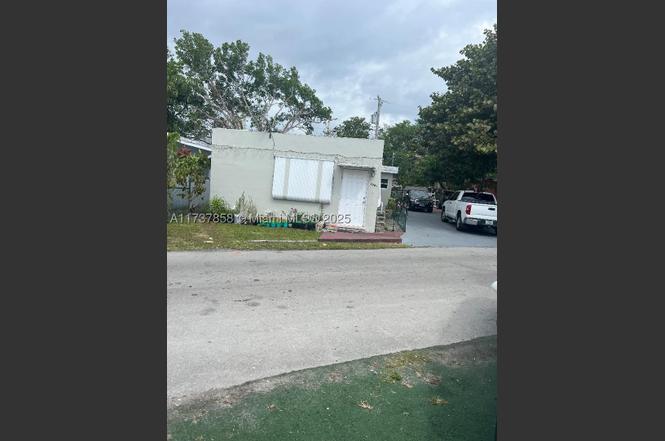
2381 NE 137 St · North Miami Beach, FL
Flood risk No data
- FEMA flood zone
- —
- Chance of flooding over 30 yrs
- —
- Est. flood insurance / yr
- —
Fire risk No data
- Est. fire insurance / yr
- —
Heat risk No data
- Hot days now (above threshold)
- —
- Hot days in 30 yrs
- —
Wind risk No data
- Chance of severe wind over 30 yrs
- —
Air-quality risk No data
- Unhealthy air days now
- —
- Unhealthy air days in 30 yrs
- —
Risk factors via First Street. Map © Google.
Why this score? — see what drove the D- grade
The composite is a weighted blend of 9 inputs, each scored 0–100. Each bar is that input's sub-score; the figure is the points it added to the 100-point composite (weight × sub-score).
- Cash flow +10.4/30.0
- ARV discount +7.5/15.0
- Schools +4.2/10.0
- Livability +4.1/5.0
- DSCR +3.0/10.0
- Rent growth +2.5/5.0
- Condition / age +2.5/5.0
- 1% rule +2.0/10.0
- Appreciation +0.0/10.0
$450,000
🖨 Deal sheet (PDF) 📄 Offer letter ✓ Due diligence
Listing remarks
Investors Dream! No HOA! Great opportunity to own this 3/2 home already have a tenant or this charming starter home in North Miami Beach is tastefully decorated and perfect for first-time buyers. Three bedroom and Two bathroom offer a cozy and intimate living space. The kitchen boasts stainless steel appliances, adding a modern touch to the home. The property is in perfect condition, ensuring safety and energy efficiency. The location is ideal, with easy access to shops, restaurants, and major highways. Don't miss this opportunity to own a stylish, affordable home in a desirable neighborhood. Tax roll show it as 1/1
Key facts
- Ideal location
- Easy access to shops
- 2,400 sq ft lot
Tags
Property features AI
Finance
- Financial info: Pets allowed (no restrictions)
- HOA & community: Park nearby
Exterior
- Parking: Detached carport; Driveway; Carport with 4 covered spaces
- Security: Storm/security shutters
- Utilities: Public water; Public sewer; Cable available
- Home design: Single-story; Faces south; Slab foundation
- Construction: Brick and block construction; Shingle roof; Resale property
- Exterior features: Fruit trees; Storm/security shutters; City street frontage; Less than quarter acre lot
Interior
- Kitchen: Electric range; Refrigerator
- Bedrooms: Bedroom on main level
- Flooring: Concrete flooring
- Bathrooms: 1 full bathroom
- Heating & cooling: Central air; Ceiling fan(s); Wall/window unit(s); Electric heating; Wall furnace
- Interior features: First-floor entry; Bedroom on main level; Unfurnished
- Laundry & utility: Laundry room; Utility room
Neighborhood map
What this means for you Summary
Snapshot
- This is a 1-bed/1.0-bath single-family listed at $450k.
Deal economics
- At list price, monthly cash flow is $-242 ($-3k/yr) — negative.
- To cash-flow at today's rent, offer at most $407k (9.5% below list).
- To meet the 1% rule (rent ≥ 1% of price), the offer needs to be $313k (30.5% below list).
- Recommended offer: $313k (30.5% below list) — sets the bar for 1% rule.
Location & tenants
- Location reads 82/100 on livability (#71 in FL, #1,177 nationally) — a professional / high-income tenant draw. Strengths: commute A+, housing A+, health & safety A+; Watch: employment D+, crime F.
- Miami-Dade (suburban): math 45% / reading 54% proficiency, ranked #40 of 73 in FL (top 55%) — families likely to look elsewhere, expect single-tenant / working-renter base with shorter leases; 64% free/reduced lunch — lower-income household profile, screen leases tightly.
- Zoned schools: David Lawrence Jr. K-8 Center (math 43% / reading 50%, grade D-, #1,223 of 2,144 statewide, top 57%, 1,282 students, 55% FRL); John F. Kennedy Middle School (math 47% / reading 55%, grade C, #237 of 571 statewide, top 43%, 1,074 students, 67% FRL); Alonzo & Tracy Mourning Senior High School (math 38% / reading 50%, grade F, #244 of 667 statewide, top 37%, 1,597 students, 48% FRL).
- Market conditions: Rents soft (-0.1%/yr); 340 active listings in the ZIP; 10,051 units permitted in Miami-Dade County in 2024 (7,758 in 5+ unit buildings).
- At $3,129/mo this rent would consume 59% of the median local household income ($63k/yr) (locally 1914% of renters already pay >50% of income on rent) — very limited rent-growth headroom before tenants either downsize or default.
Forward outlook
- Local home prices are declining (-3.0%/yr); year-one equity from $3k of loan paydown is wiped out by about $14k of value loss. Plan a longer hold.
- Miami-Dade County population projected at +28% by 2050 — long-run rental-demand tailwind backs the buy-and-hold thesis.
Negotiation context
- It's been on market 487 days — a 12% lower offer ($396k) is reasonable based on typical stale-listing flexibility.
- Current owner paid $51k; list at $450k implies a 782% gain — meaningful room to come down on a strong offer.
Risks & watch-outs
- Watch-outs: built in 1952 — expect roof / HVAC / electrical / plumbing capex.
Questions for the listing agent
- What do current leases actually rent for vs. the listed asking? Can we see a recent rent roll and the last 12 months of T-12 income?
- It's been on market 487 days. Have you received any prior offers? Is the seller open to a 30% concession, seller financing, or rate buy-down credit?
- Built in 1952 — when were the roof, HVAC, electrical panel, plumbing, and water heater last replaced?
- Why hasn't it sold? Are there any deal-killer items the seller is aware of (foundation, flood, title, zoning, code violations)?
- Is there a deadline driving the sale (1031 exchange, divorce, estate, relocation)? That informs how much negotiation room exists.
- Crime grade is F in this area — have there been break-ins, vandalism, or insurance claims at this property in the last 3 years? What carrier currently insures it and at what premium?
- The area grade is low — what's the realistic commute time and amenity access for the typical tenant pool here? Any planned neighborhood developments (good or bad) we should know about?
- What's the average days-on-market for RENTAL listings here right now (not sales)? A rising rental-DOM trend means longer vacancies and softer asking-rent achievability than the comps imply.
- What's the recent tenant-quality profile in this submarket — average credit score on applications, eviction rate, late-payment / NSF rate, and stable-employment percentage? A property-management company in the area should have these aggregated.
- How much new for-sale + rental construction is in the pipeline within 1–3 miles? Heavy new supply typically softens prices + rents 12–24 months out; constrained supply supports both.
Investment metrics
- 1% rule
- 0.70% ✗
- Cap rate
- 5.65%
- Cash-on-cash
- -2.31%
- DSCR
- 0.90
- GRM
- 12.0
CMA / ARV
No comps found within radius.
Projected returns pro-forma
-3.0% appreciation · 0.0% rent growth · sell at horizon
- IRR
- -23.1%
- Equity multiple
- 0.22×
- Total profit
- $-97,712
- Equity at exit
- $67,096
- IRR
- -26.5%
- Equity multiple
- -0.12×
- Total profit
- $-141,185
- Equity at exit
- $38,908
Cash invested: $126,000 (down + closing). Projections, not guarantees.
Landlord ↔ Tenant lean methodology
- Overall (STATE)
- 87 Strongly Landlord-Friendly
- State Florida
- 87 Strongly Landlord-Friendly · R+3
- County
- — inherits STATE
- City
- — inherits STATE
ZIP-level market 33181
- Rents YoY
- -0.1%
- Active inventory
- 340
- Price-to-rent
- 12.0×
Monthly cashflow live
- Estimated rent
- $3,129 medium interval (Pro) →
- Mortgage (P&I)
- −$2,360
- Tax from tax record
- −$167 /mo · $2,002/yr
- Insurance
- −$188
- HOA
- −$0
- Vacancy / Maint / Mgmt
- −$657
- Net cashflow
- $-242
Break-even live
Sensitivity live
| Price | -10% $13 | -5% $-115 | +0% $-242 | +5% $-370 | +10% $-497 |
|---|---|---|---|---|---|
| Rent | -10% $-489 | -5% $-366 | +0% $-242 | +5% $-119 | +10% $5 |
| Rate | -1.0pp $-16 | -0.5pp $-128 | base $-242 | +0.5pp $-359 | +1.0pp $-477 |
UW: 25.0% down · 7.5% · 30yr · 1.5% tax · 5.0% vac · 8.0% maint · 8.0% mgmt
Financing live
Cash to close
- Down payment
- $112,500
- Closing costs
- $13,500
- Reserves months
- —
- Total cash needed
- —
Loan-product check · same deal, 3 products live
Conventional
25% down · 7.5% · 30yr
- Down + closing
- —
- Monthly P&I
- —
- Monthly cashflow
- —
- DSCR
- —
- Eligible?
- —
Personal DTI + credit; lowest rate.
DSCR
20% down · 8.5% · 30yr
- Down + closing
- —
- Monthly P&I
- —
- Monthly cashflow
- —
- DSCR
- —
- Eligible?
- —
No personal income docs; deal must DSCR.
Hard money
10% down · 12.0% · 12mo
- Down + closing
- —
- Monthly P&I
- —
- Monthly cashflow
- —
- DSCR
- —
- Eligible?
- —
Short-term bridge; refi at stabilization.
Listing history 20 events
-
2026-06-22days on market $450,000 Active 487 DOM
-
2026-06-18days on market $450,000 Active 484 DOM
-
2026-06-17days on market $450,000 Active 483 DOM
-
2026-06-16days on market $450,000 Active 482 DOM
-
2026-06-15days on market $450,000 Active 481 DOM
-
2026-06-13days on market $450,000 Active 479 DOM
-
2026-06-09days on market $450,000 Active 475 DOM
-
2026-06-08days on market $450,000 Active 474 DOM
-
2026-06-08days on market $450,000 Active 473 DOM
-
2026-06-04days on market $450,000 Active 470 DOM
-
2026-06-03days on market $450,000 Active 469 DOM
-
2026-06-02days on market $450,000 Active 468 DOM
-
2026-06-01days on market $450,000 Active 467 DOM
-
2026-05-31days on market $450,000 Active 466 DOM
-
2025-09-02price $450,000
-
2025-02-09$525,000 Active
-
2003-02-14soldstatus $51,000
-
1989-12-27soldstatus $37,000
-
1989-01-01soldstatus $28,000
-
1979-04-01soldstatus $28,000
ⓘ Source: listings_history table (triggers on properties + properties_extension) + one-shot
backfill from property_details.listing_events for pre-trigger history.
Tax reassessment forecast FL · Resets to sale price
- Current annual tax
- $2,002 · $167/mo
- Projected year-2 tax
- $3,735 · $311/mo
- Expected delta
- +$1,733/yr (+$144/mo · 86.6%)
ⓘ Screening estimate from a state-policy table — verify with the county assessor before closing.
Nearby sold comps map
Loading sold comps map…
Walkable amenities ~0.75 mi
Loading nearby amenities…
Taxation est. · year 1
- Rental income
- $37,549
- − Mortgage interest
- −$25,207
- − Property taxes
- −$2,002
- − Insurance
- −$2,250
- − Repairs & maintenance
- −$3,004
- − Management
- −$3,004
- − Depreciation
- −$13,091
- Taxable loss
- −$11,009
- Est. tax savings @ 24.0%
- +$2,642
- After-tax cash flow
- $-264/yr
For passive investors: Depreciation is non-cash, so a rental often shows a tax loss while cash-flowing — sheltering income. Rental losses are passive: they offset passive income freely, and up to $25,000/yr can offset ordinary (W-2) income if you actively participate and your MAGI is under $100k (phasing out to $0 by $150k); unused losses carry forward. On sale, claimed depreciation is recaptured at up to 25%, and gains may owe capital-gains tax (a 1031 exchange can defer both). Figures are a year-1 estimate at your 24.0% rate — not tax advice; consult a CPA.
Schools (NCES district)
- District
- Miami-Dade
- NCES district ID
- 1200390
- Math proficiency
- 45% ▼ -16.00%
- Reading proficiency
- 54% ▼ -5.00%
- Median HH income
- $43,928
- Composite
- 41.76/100
- National rank
- #3397
- State rank
- #40 of 73 in FL
Livability — North Miami Beach
- Score
- 82/100
- State rank
- #71
- US rank
- #1177
Category grades
Schools grade is shown separately in the Schools card above.
Census & demographics
- Census place
- North Miami Beach, FL
- County
- Miami-Dade County · 2,697,751 people
- City population
- 90,324
- Metro
- Miami-Fort Lauderdale-Pompano Beach, FL
- Population (ZIP)
- 20,848
- Household income
- $63,275
- Rent vs Own
- Severe rent burden
- 1914.0
Population outlook (Miami-Dade County) Hauer SSP2
- Today (2025)
- 3,126,439 people
- By 2030
- 3,325,765 · +6.4%
- By 2040
- 3,697,561 · +18.3%
- By 2050
- 4,012,134 · +28.3%
- By 2075
- 4,605,612 · +47.3%
- By 2100
- 4,866,598 · +55.7%
Race, ethnicity, and origin ACS 2023
- Neighborhood character
- Diverse neighborhood (Simpson 0.67)
- Race & ethnicity
- Hispanic / Latino 44% Black 29% Two or more races 23% White 22% Asian 1%
- Hispanic origin (detail)
- Puerto Rican 2% Cuban 8% Dominican 2% Salvadoran 3%
- Common ancestry
- Hispanic 18% Lithuanian 3% Italian 1%
- Foreign-born
- 51% · Canada, Jamaica, Dominican Republic
- Languages at home
- 28% English-only · Spanish 44% French/Haitian/Cajun 18% Other Indo-European 4%
Political lean MEDSL · Miami-Dade
- 2024 margin
- R (+11.4) · D 43.9% · R 55.4%
- 2008→2024 swing
- -27.6pp toward R · 2008: 16.1pp · 2024: -11.4pp
- All cycles
- 2024: R+11.4 2020: D+7.3 2016: D+29.6 2012: D+23.7 2008: D+16.1
Not yet ingested
- Civics
- —
Market trends
- HPI YoY
- ▼ -334.57%
- Current HPI
- 341.3285
- Rent YoY
- ▼ -0.11%
- Metro
- Miami-Fort Lauderdale-Pompano Beach, FL
- State GDP YoY
- ▲ 3.28%
- F500 in state
- 36
Industry mix (Fortune 500 HQ in FL)
| Industry | F500 HQs | Revenue |
|---|---|---|
| Industrial Technology | 2 | $29B |
|
||
| Insurance | 2 | $17B |
|
||
| Retail | 1 | $60B |
|
||
| Technology Distribution | 1 | $58B |
|
||
| Homebuilding | 1 | $35B |
|
||
| Technology Manufacturing | 1 | $35B |
|
||
Price history
+1507.1% since first listed6 events — show timeline
- 2025-09-02 Price Changed $450,000 MARMLS
- 2025-02-09 Listed $525,000 MARMLS
- 2003-02-14 Sold (Public Records) $51,000 Public Records
- 1989-12-27 Sold (Public Records) $37,000 Public Records
- 1989-01-01 Sold (Public Records) $28,000 Public Records
- 1979-04-01 Sold (Public Records) $28,000 Public Records
Property tax history
+7.4%/yrLatest (2025): $2,002 · -12.8% YoY. Source: county tax records.
Cash-flow waterfall
monthlySold comps — $/sqft
last 12 mo · ≤1 miLoading sold comps…